News Corp
Product Designer & Data Visualizations
Role
Contractor with Data Science & Engineering team creating interactive data visualizations, dashboards, presentations, infographics, and internal web apps. Design and front-end development for internal dashboards with data visualizations created using D3js.
Responsibilities
Jump To Section
Dashboards

Infographics
Presentations
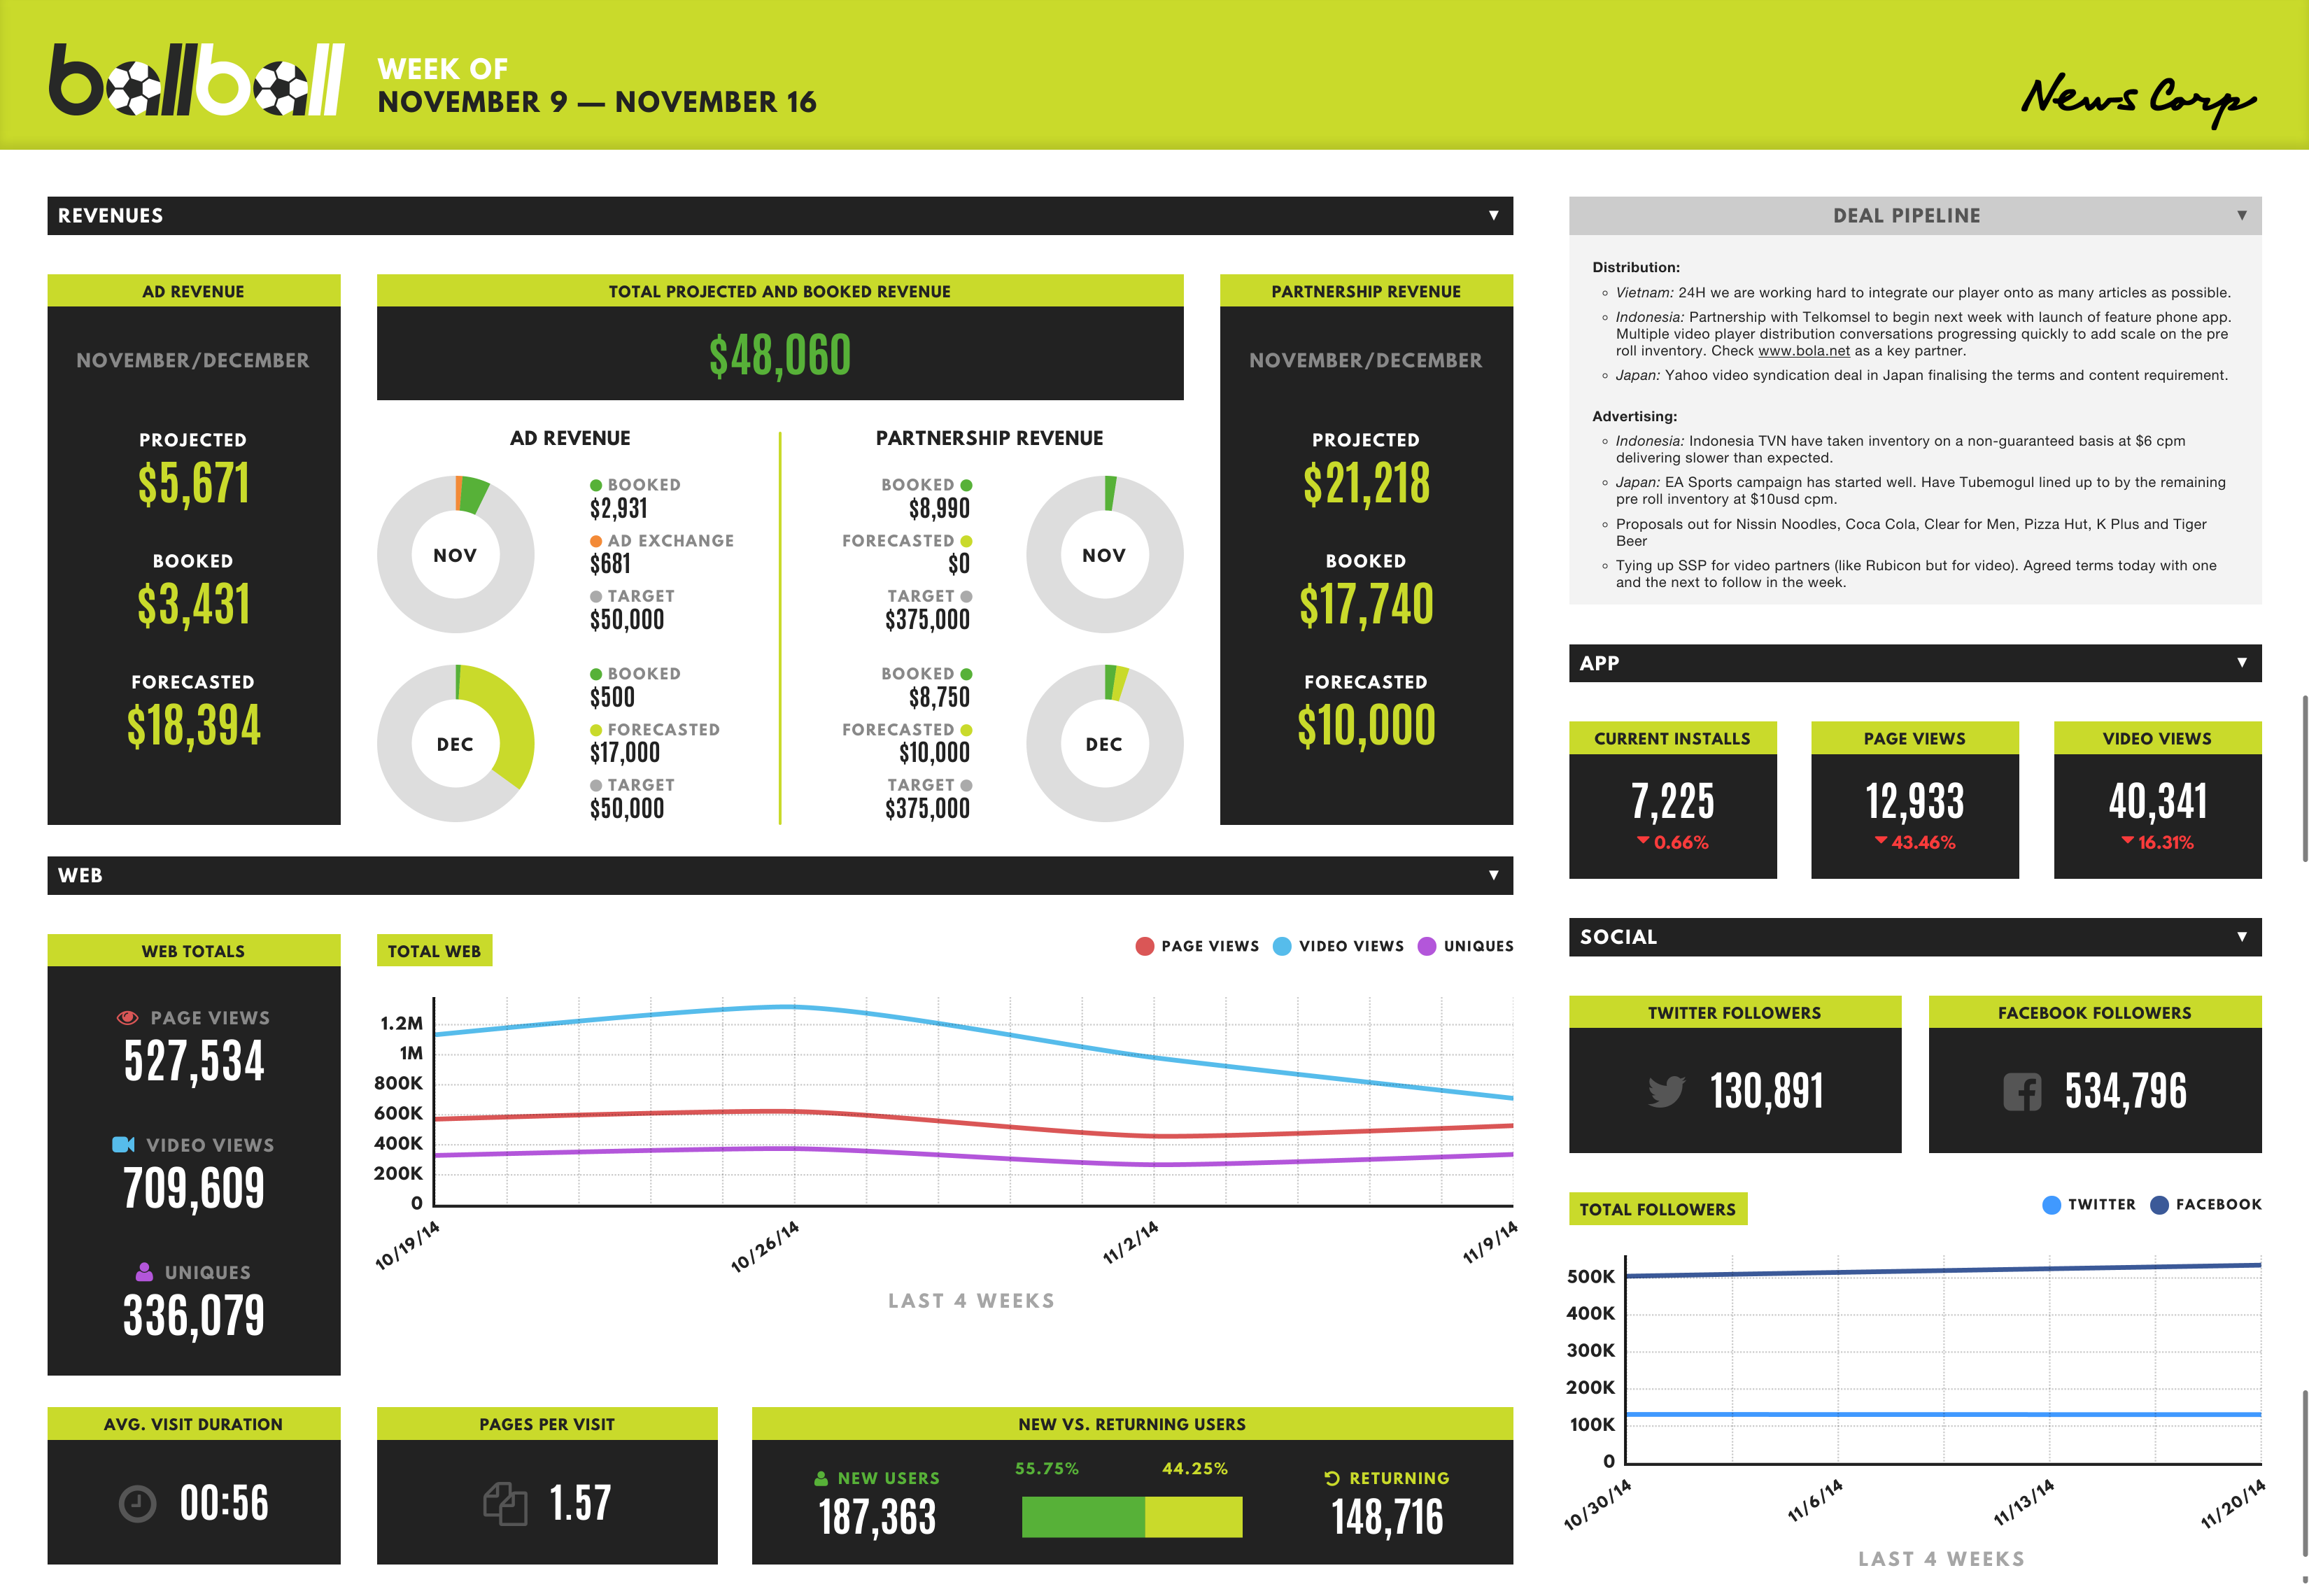
Dashboards
Description
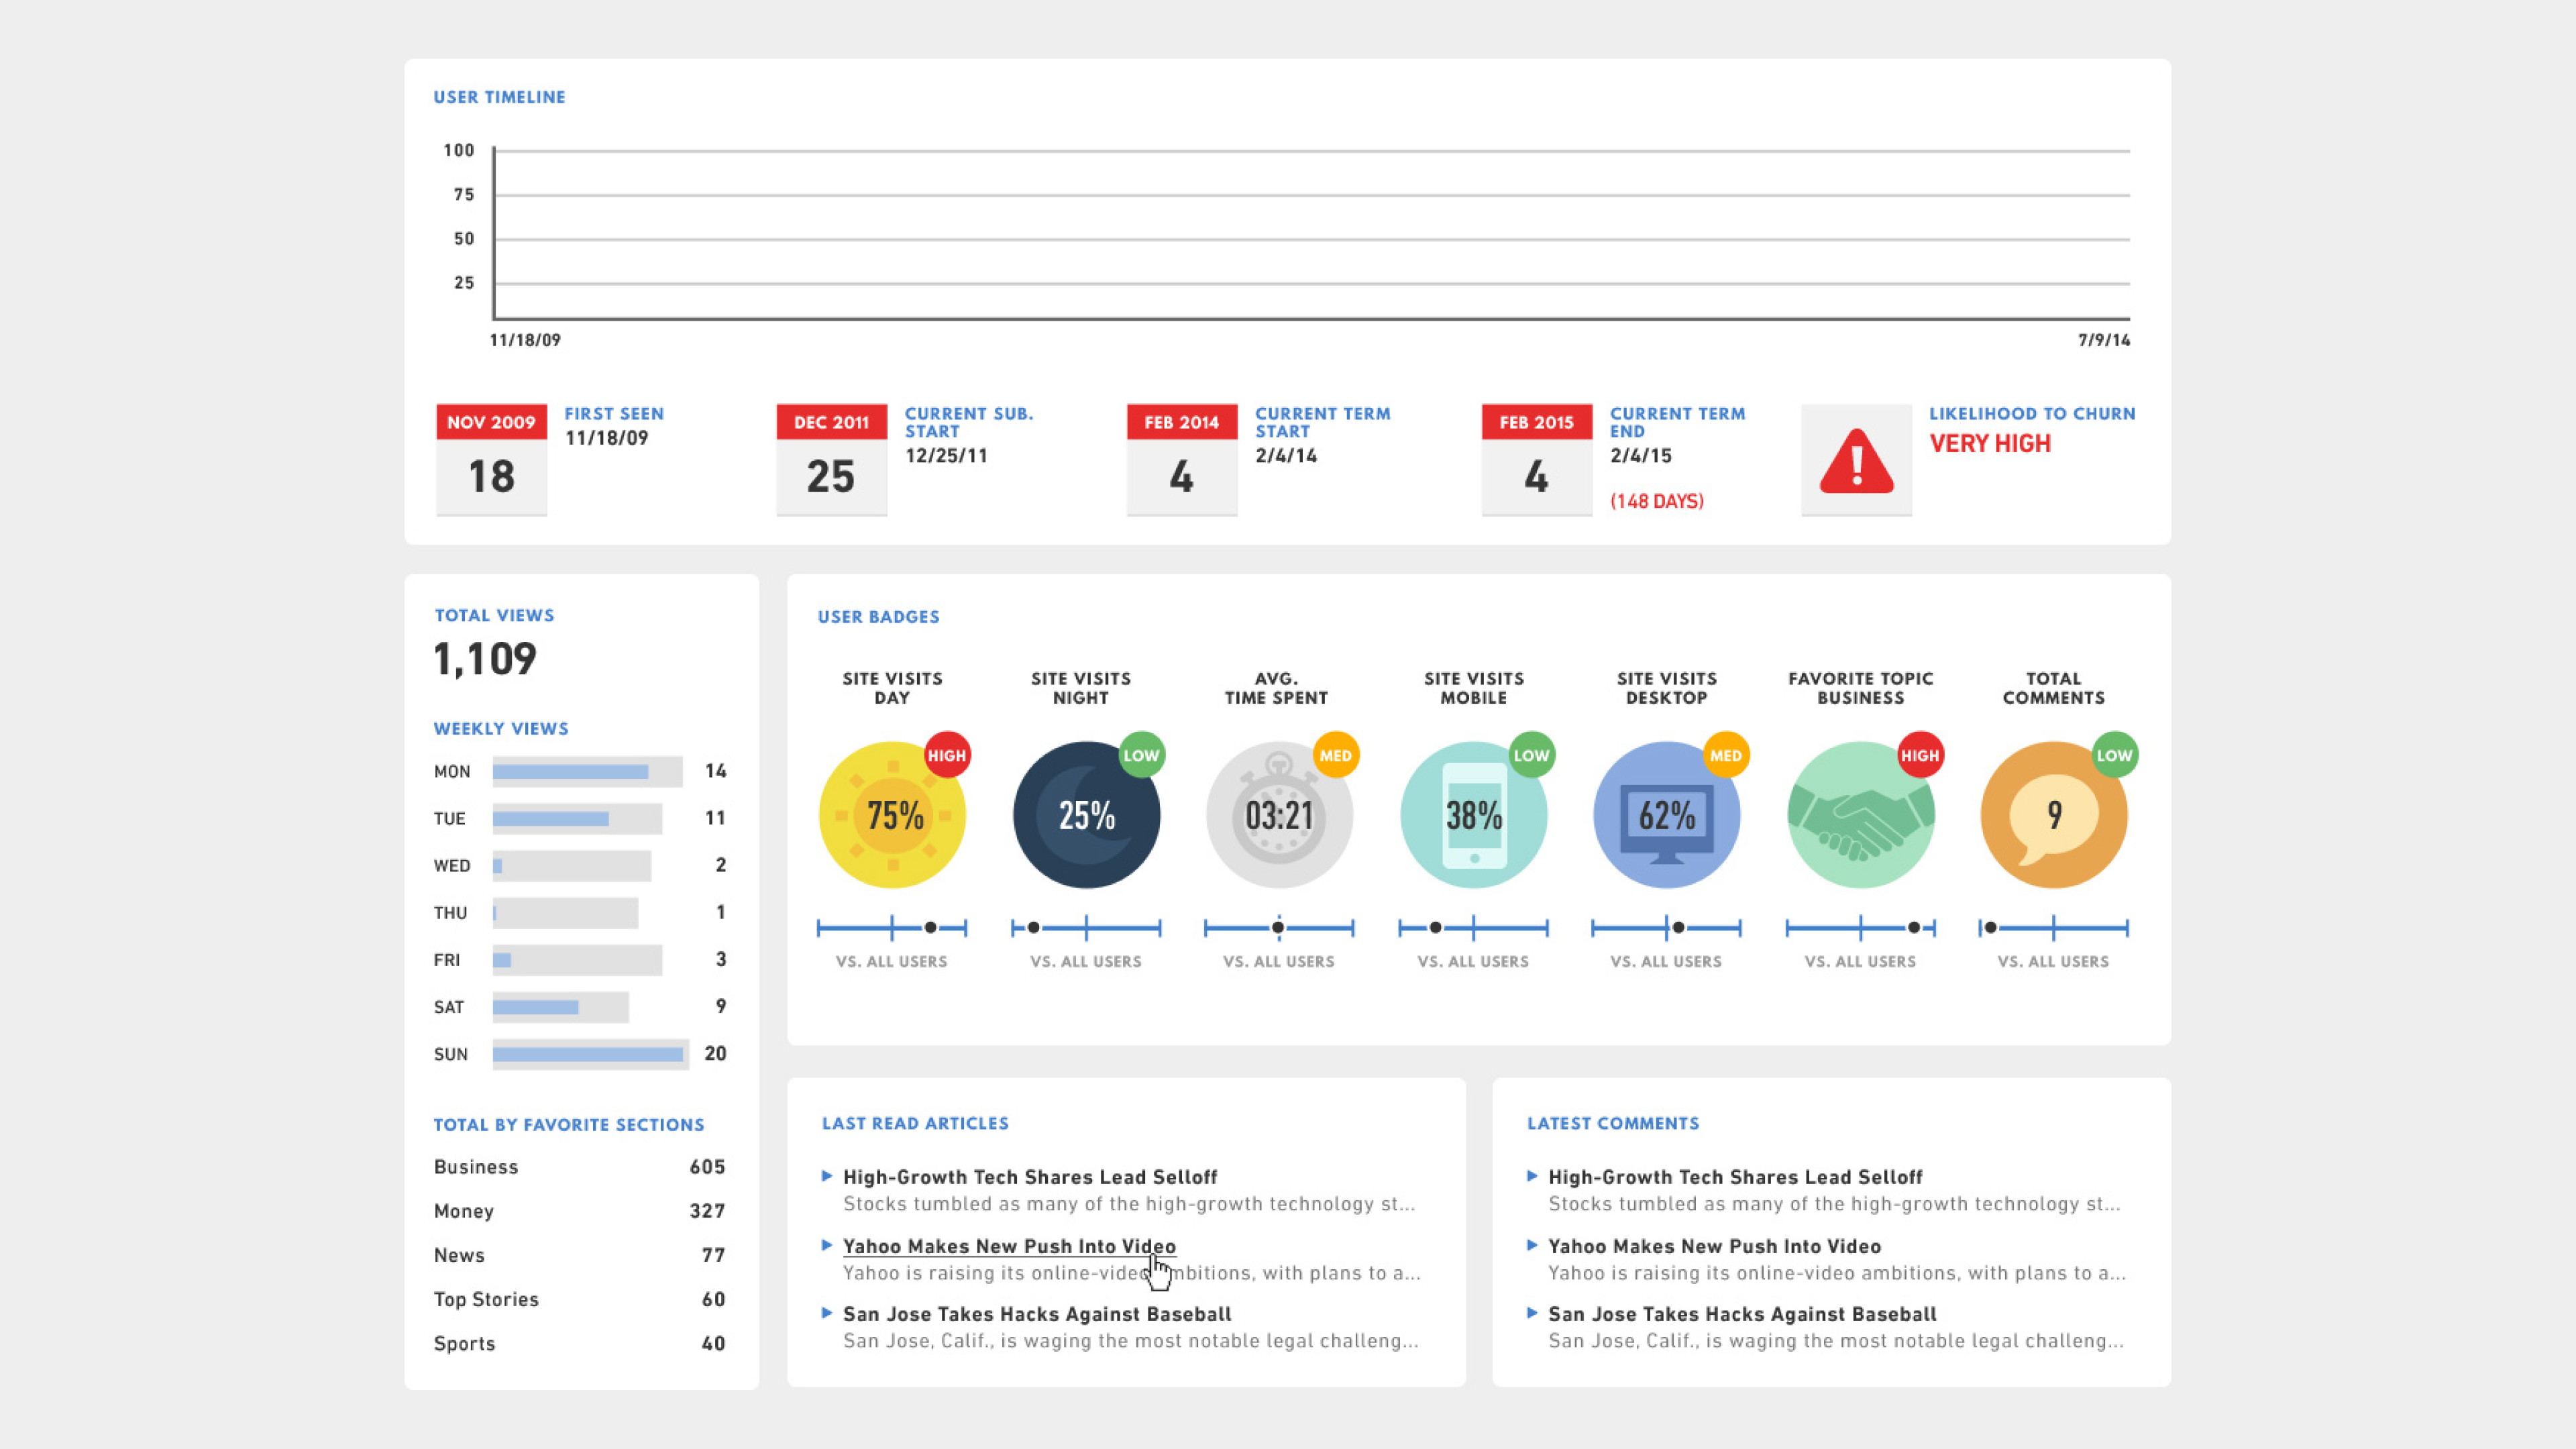
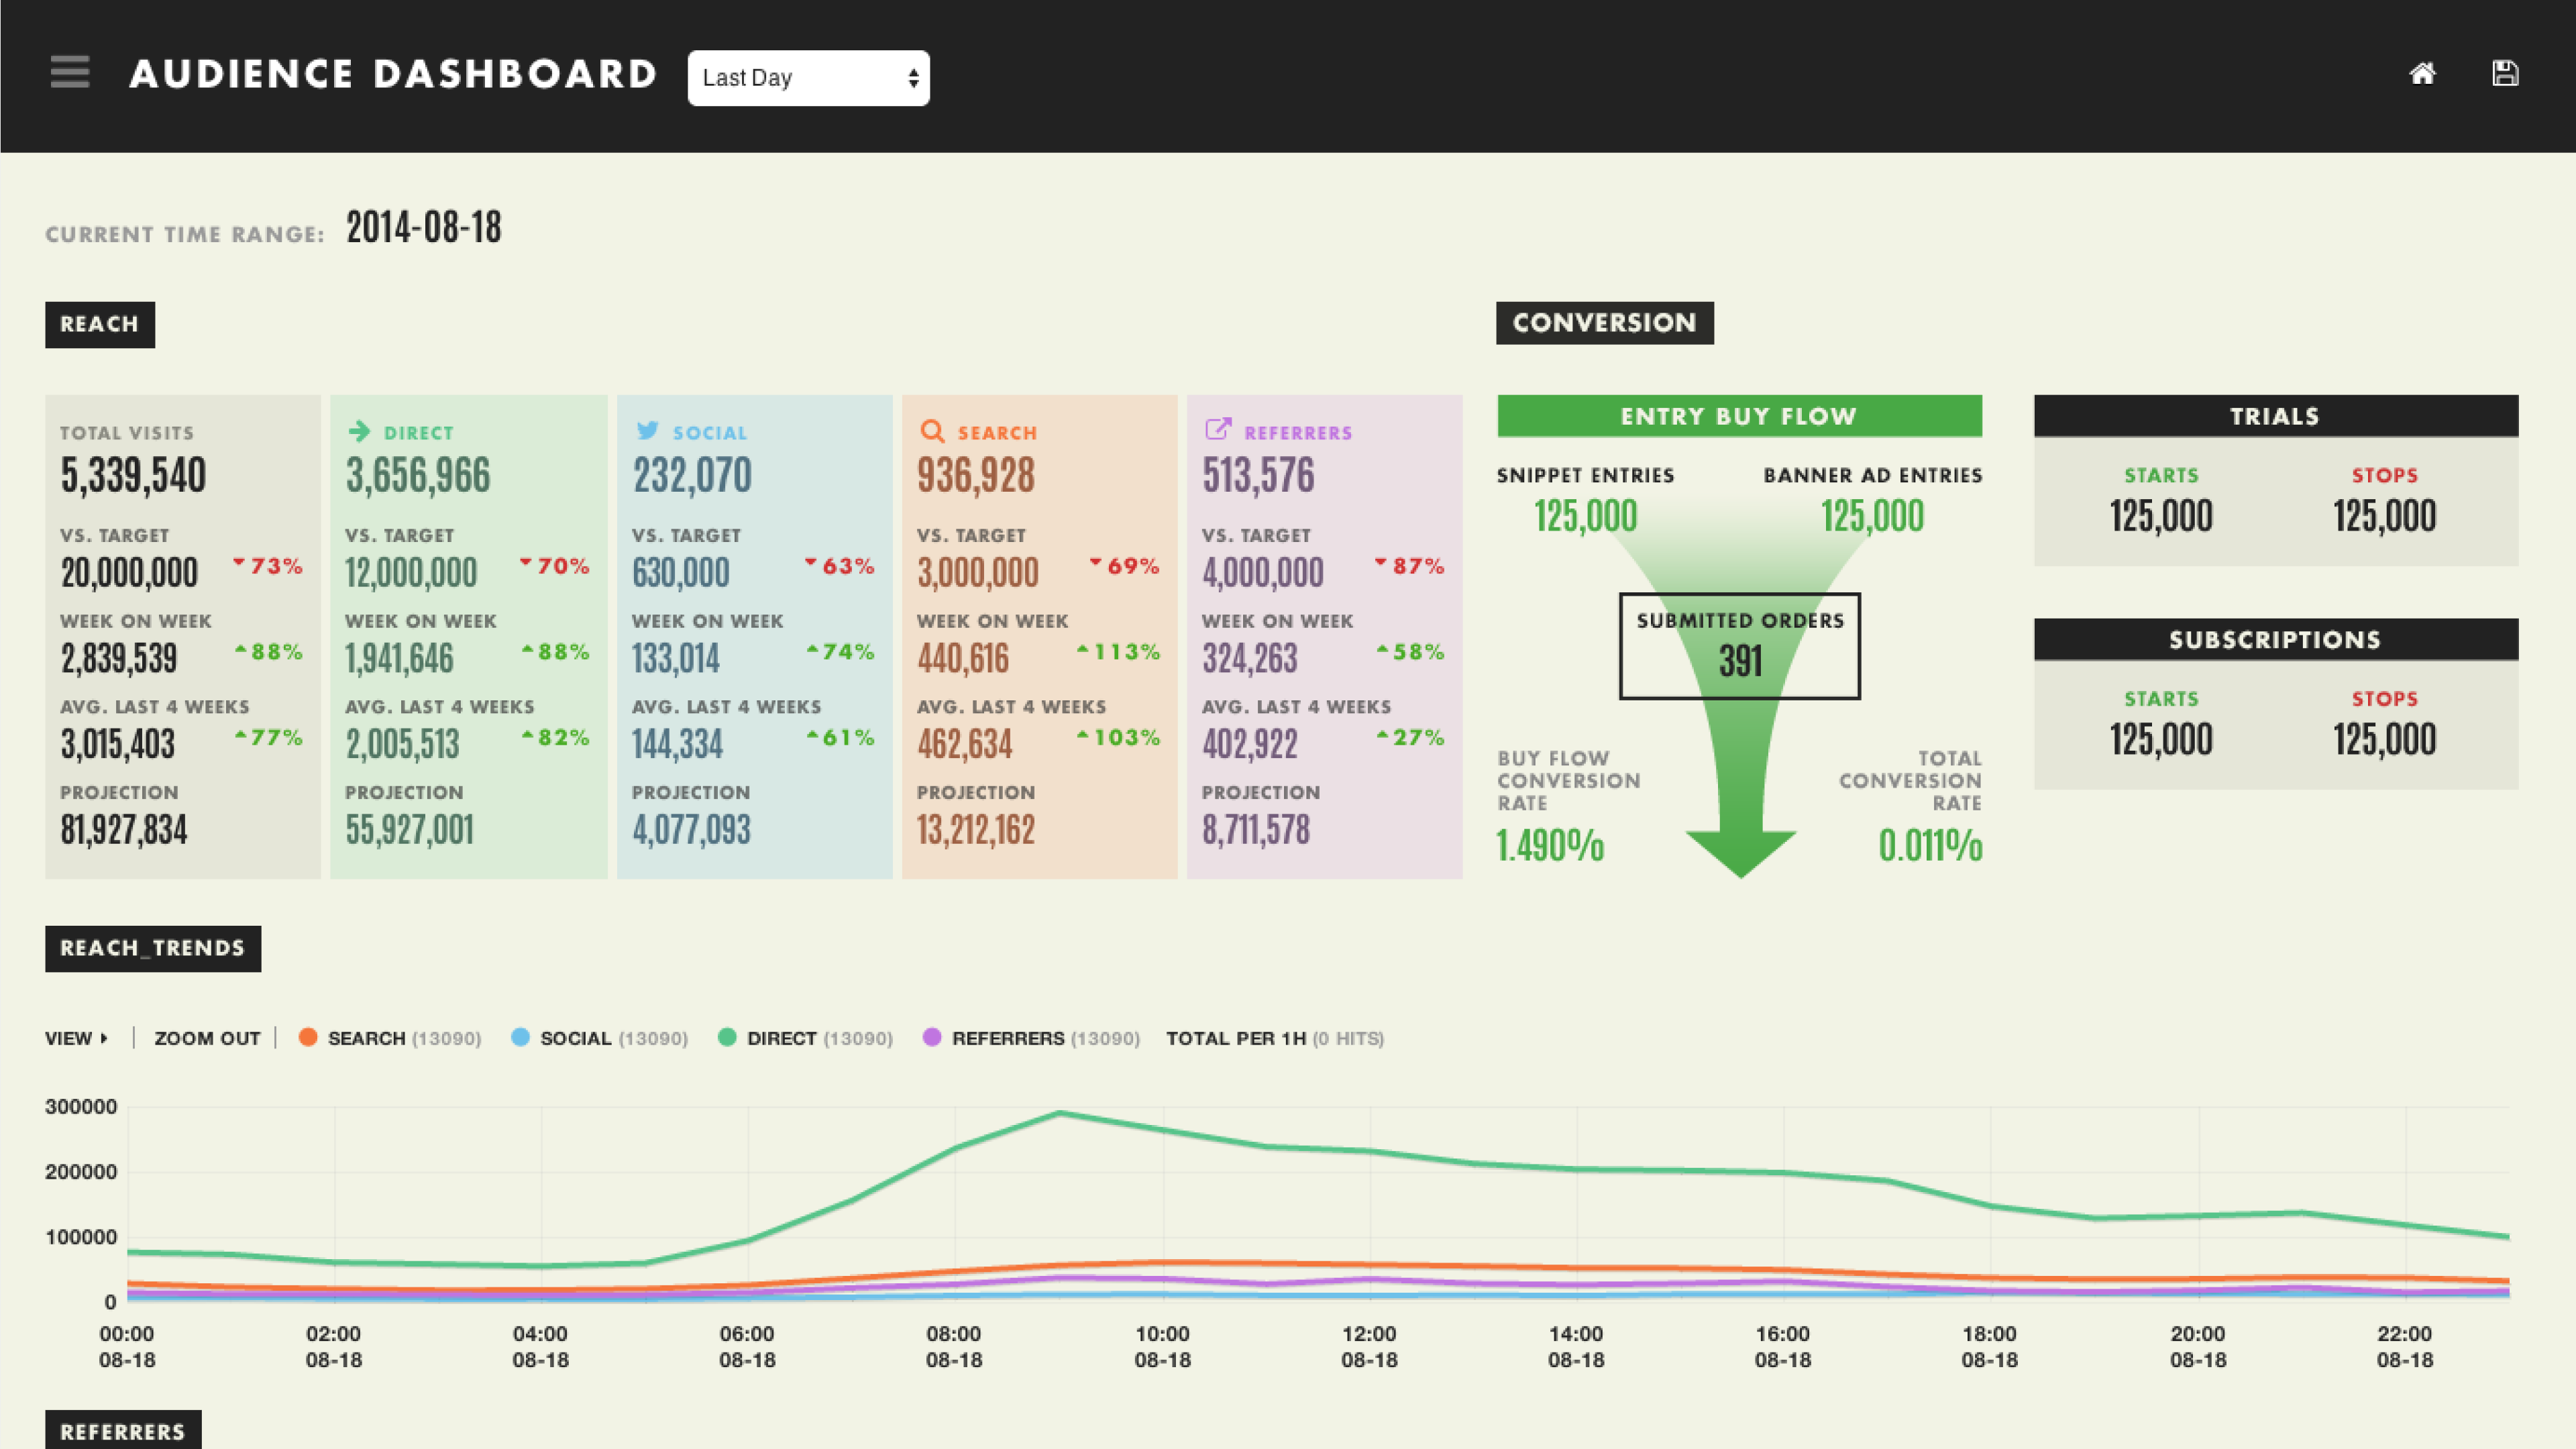
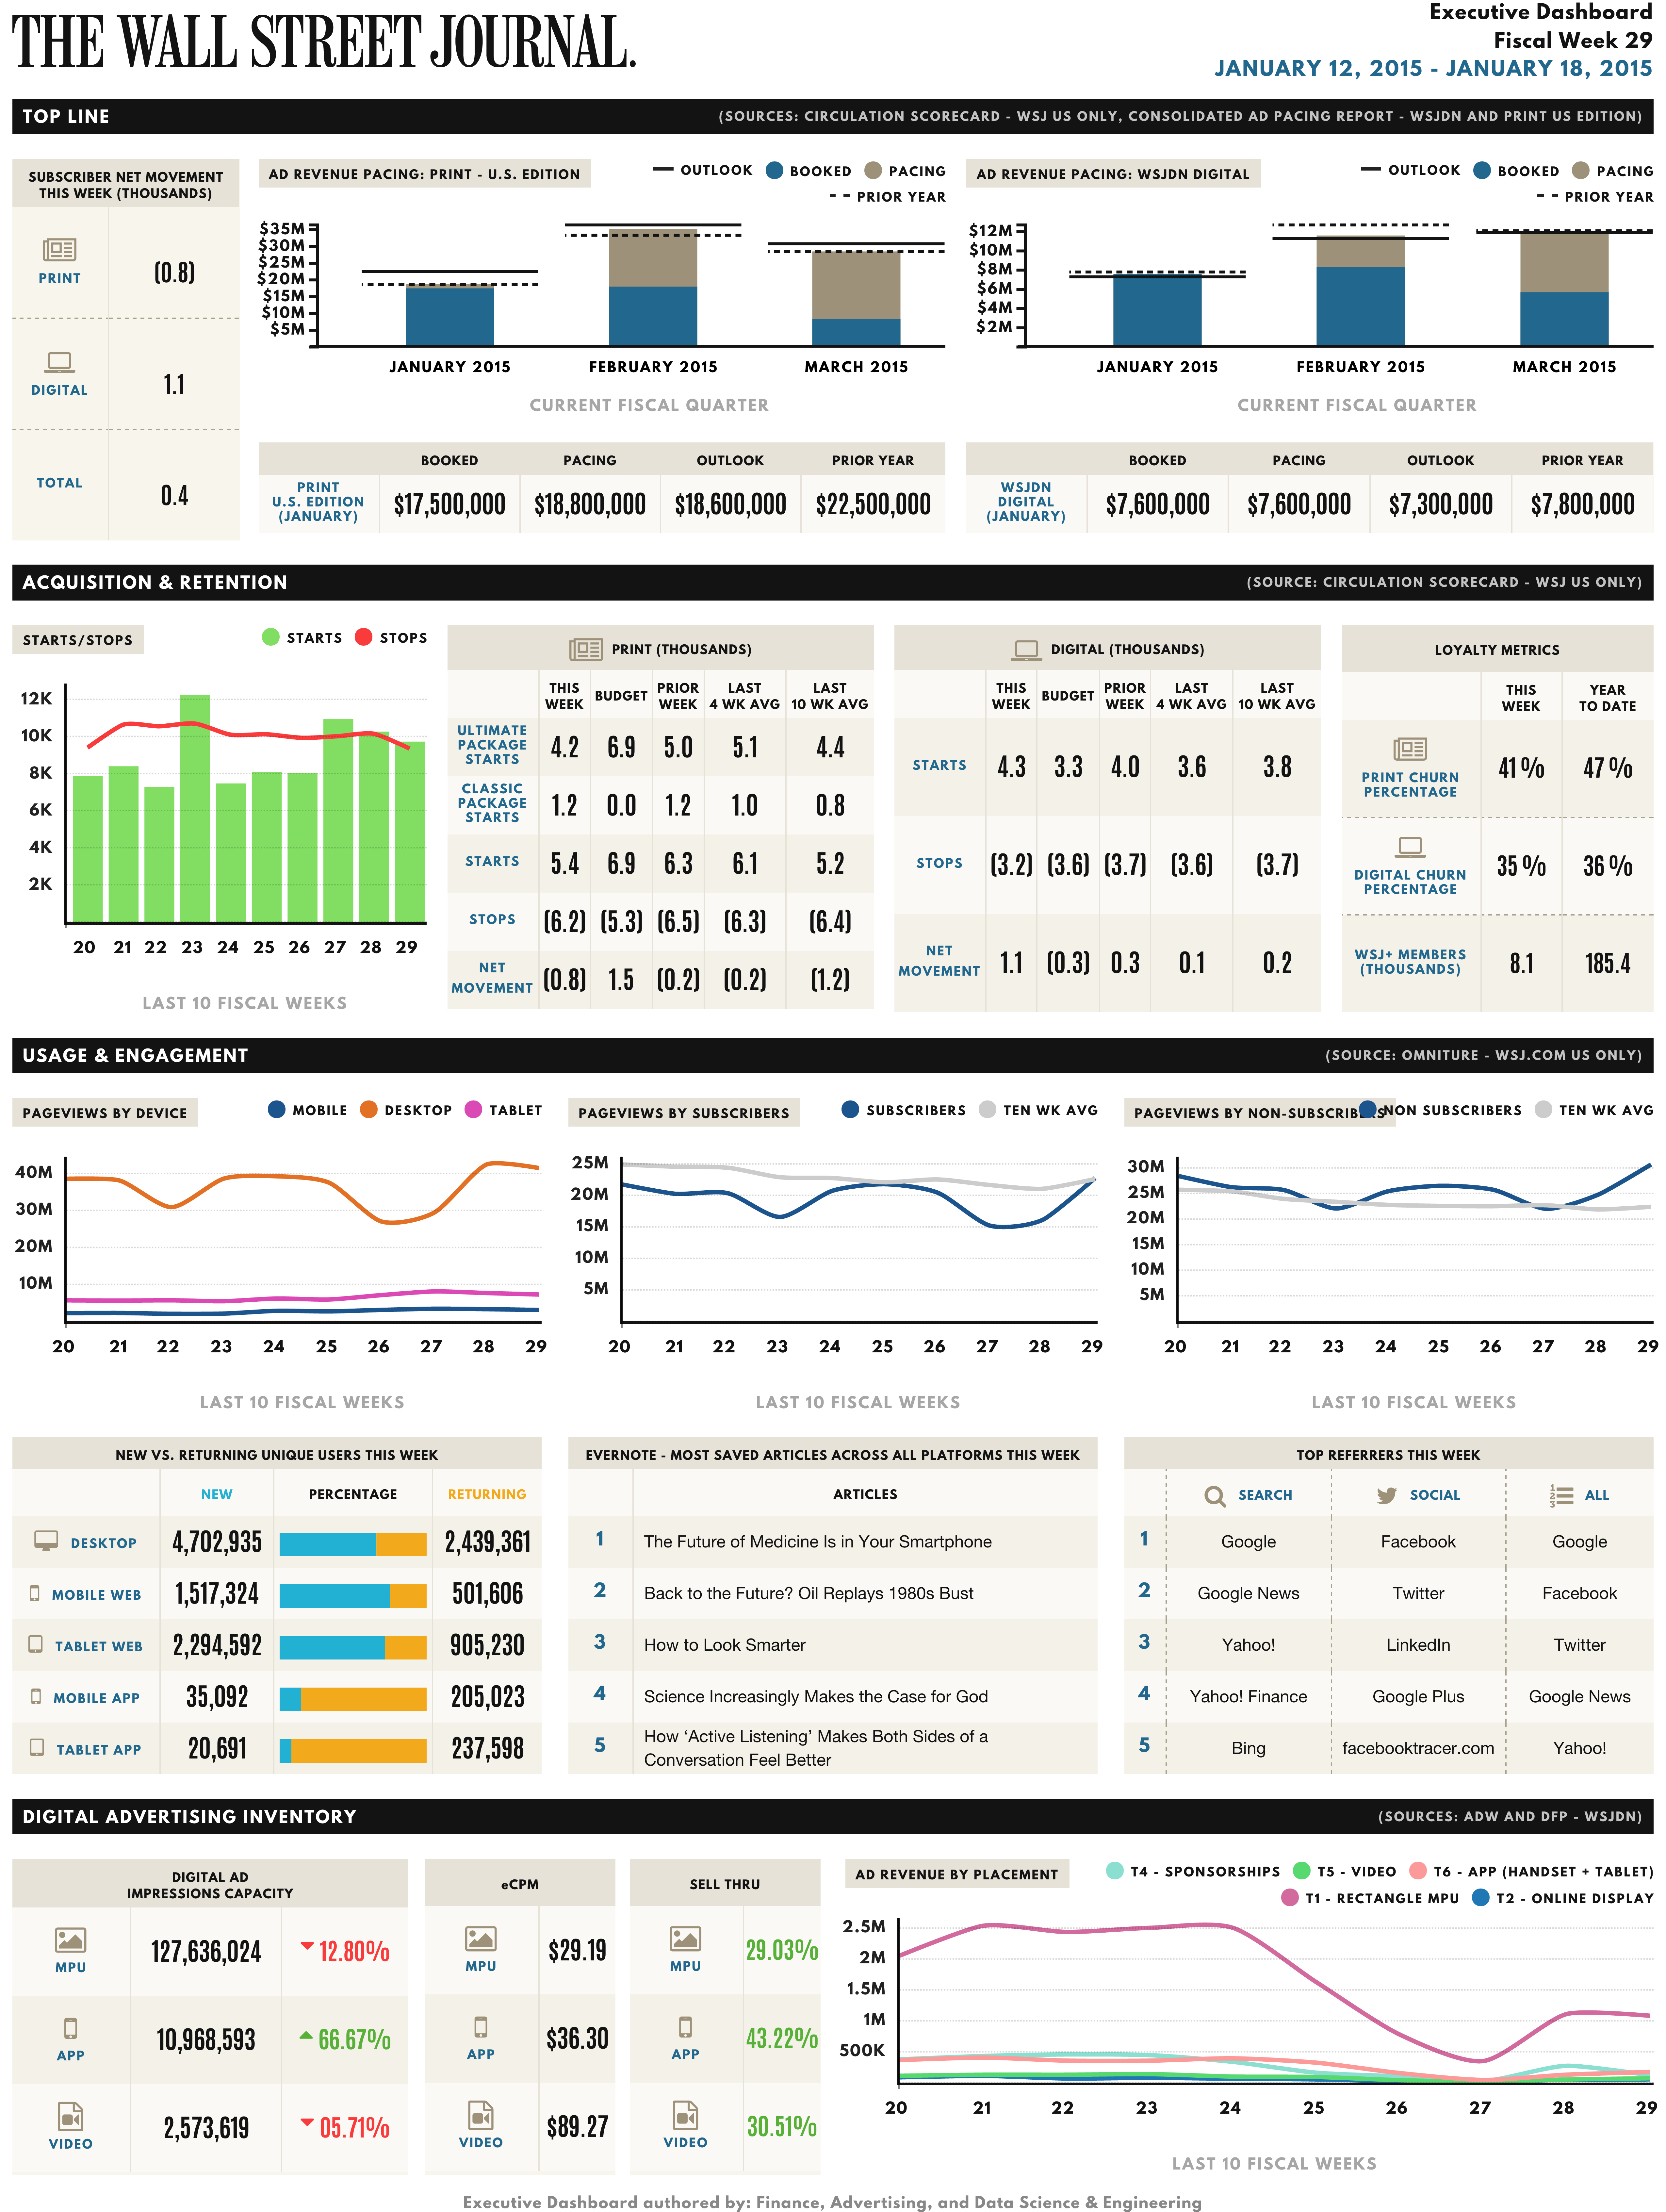
I worked alongside the data engineers from the Dow Jones Data Science & Engineering team to design and develop interactive, mobile responsive, and printable dashboards for various companies under the News Corp umbrella (WSJ, BallBall, Move.com).
TEAM
Data Science & Engineering
Responsibilities
- UX/UI design
- Print design
- Front-end development (HTML/CSS/D3js)
BallBall
Move.com Dashboard

Wall Street Journal User Dashboard
Wall Street Journal Audience Dashboard
Wall Street Journal Executive Dashboard (2014)
Wall Street Journal Executive Dashboard (2015)
Wall Street Journal iPad Dashboard

Infographics
Description
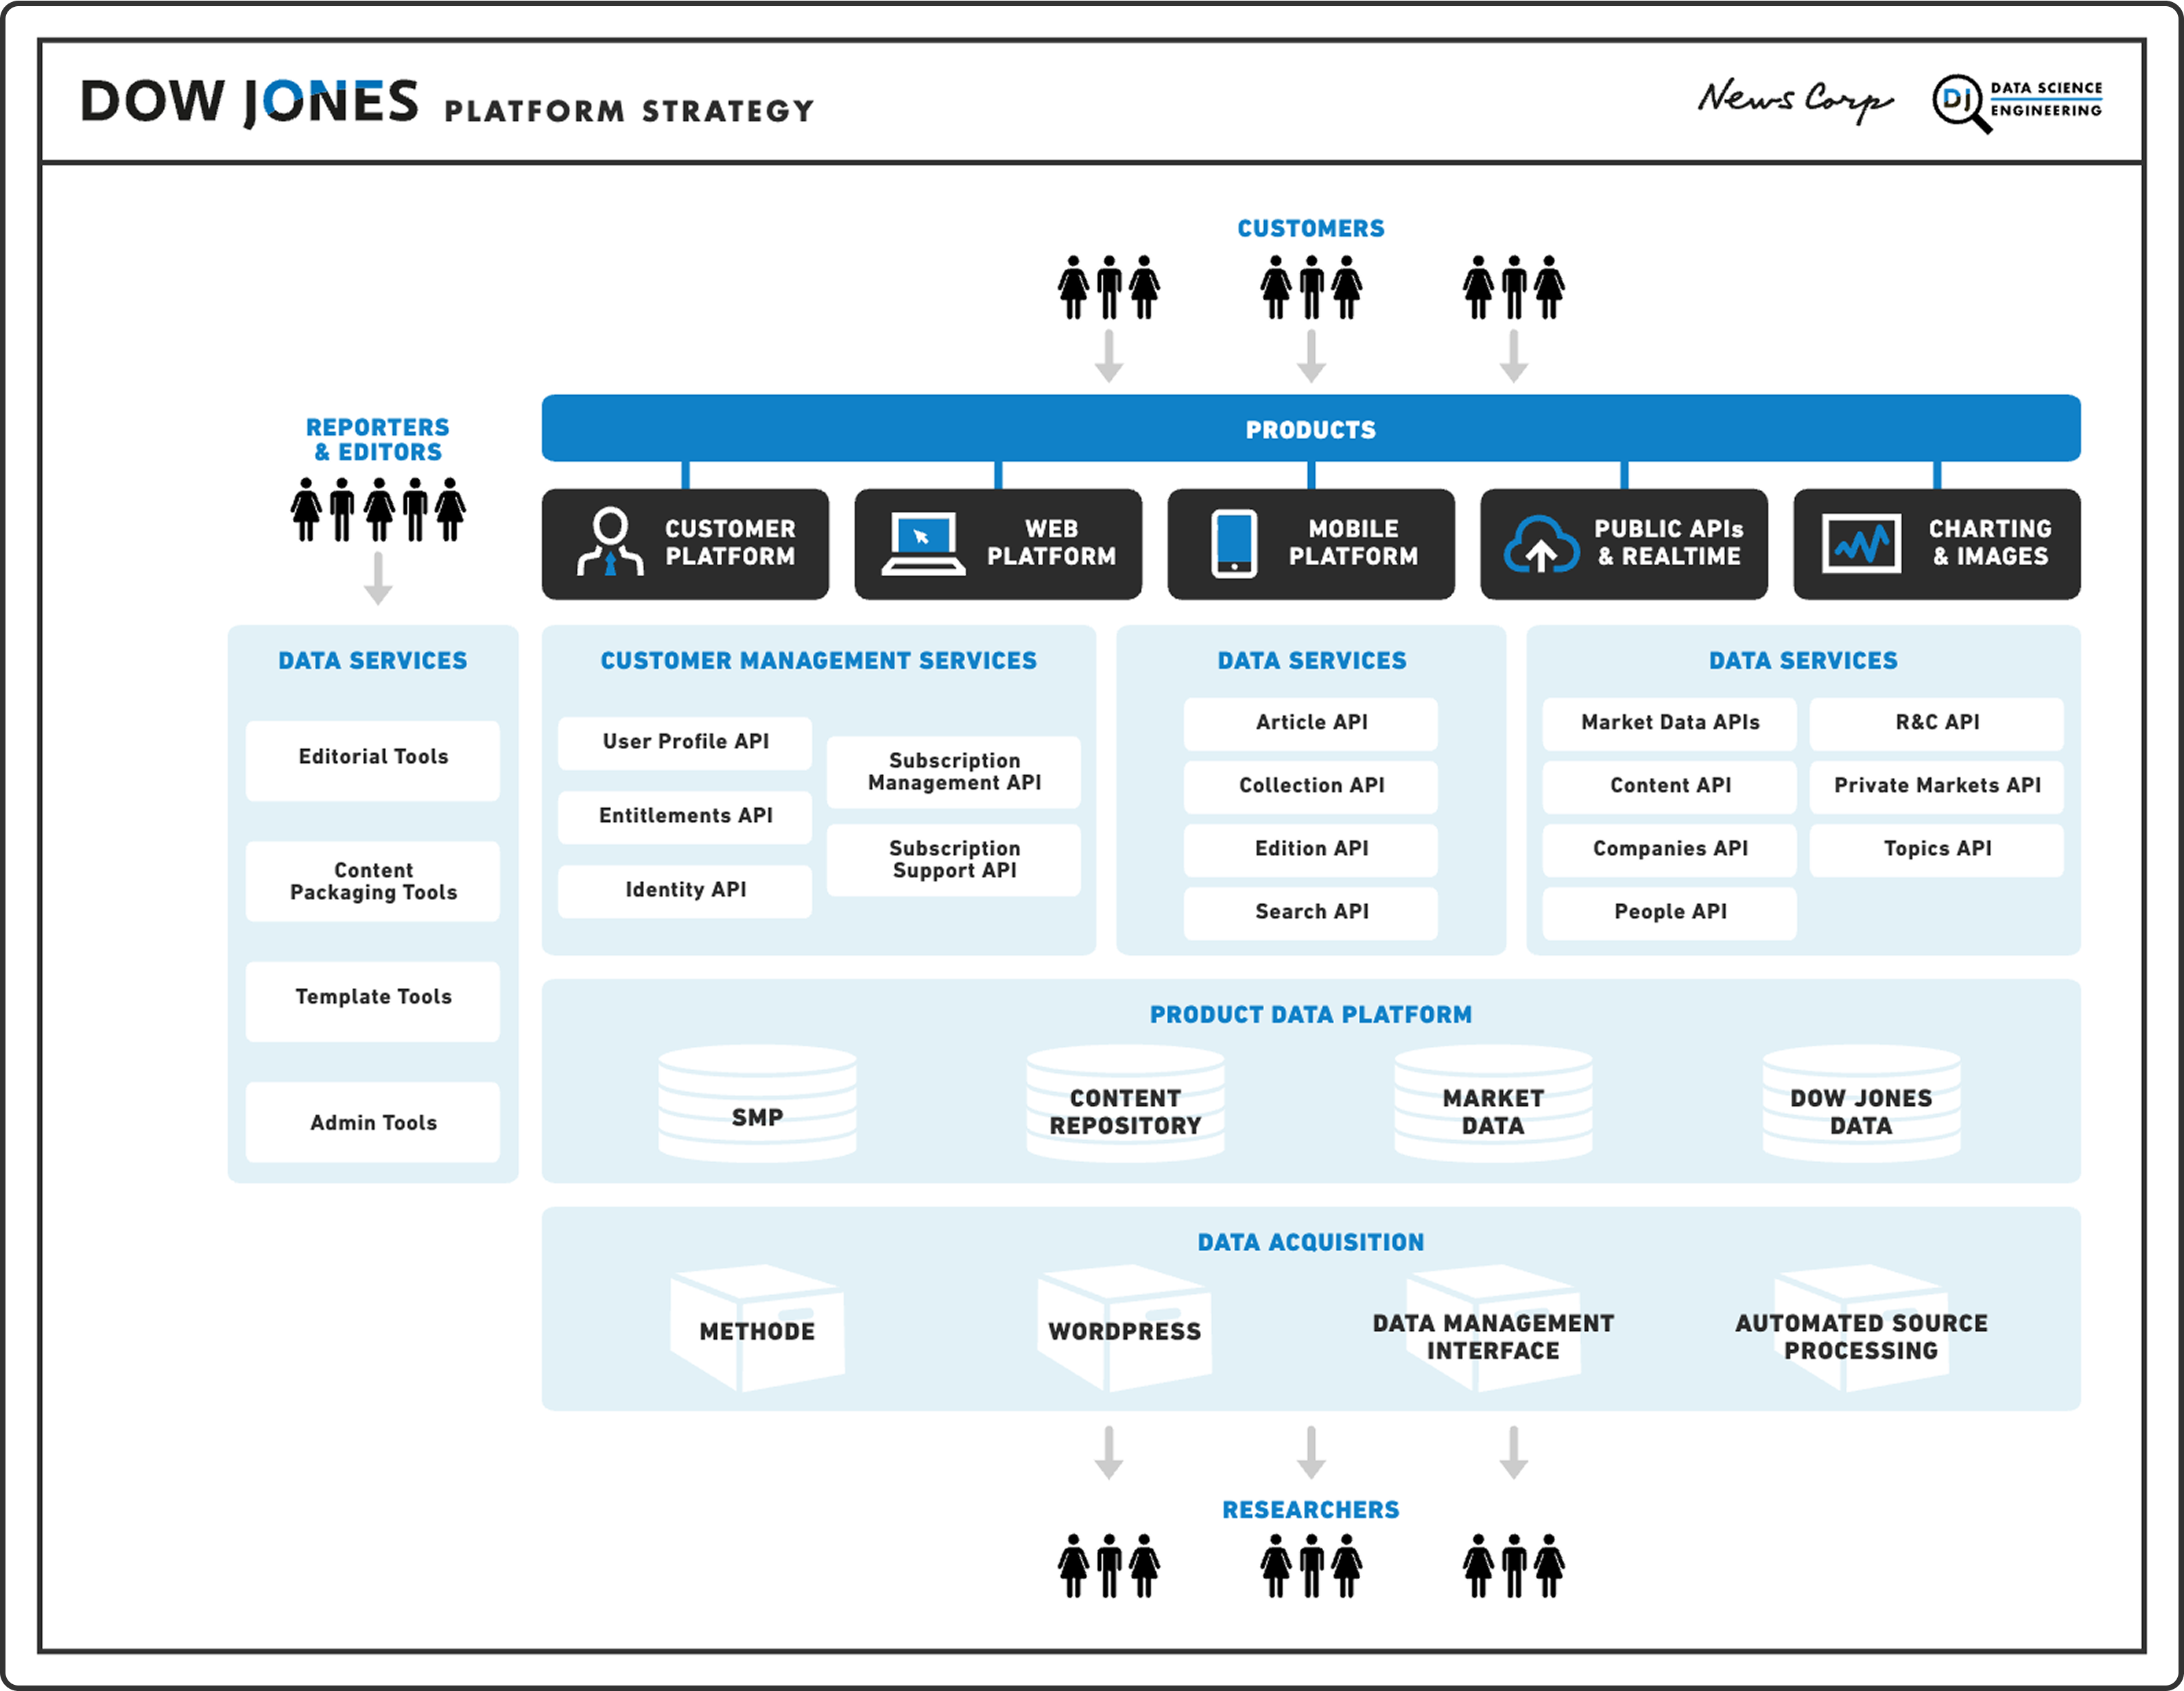
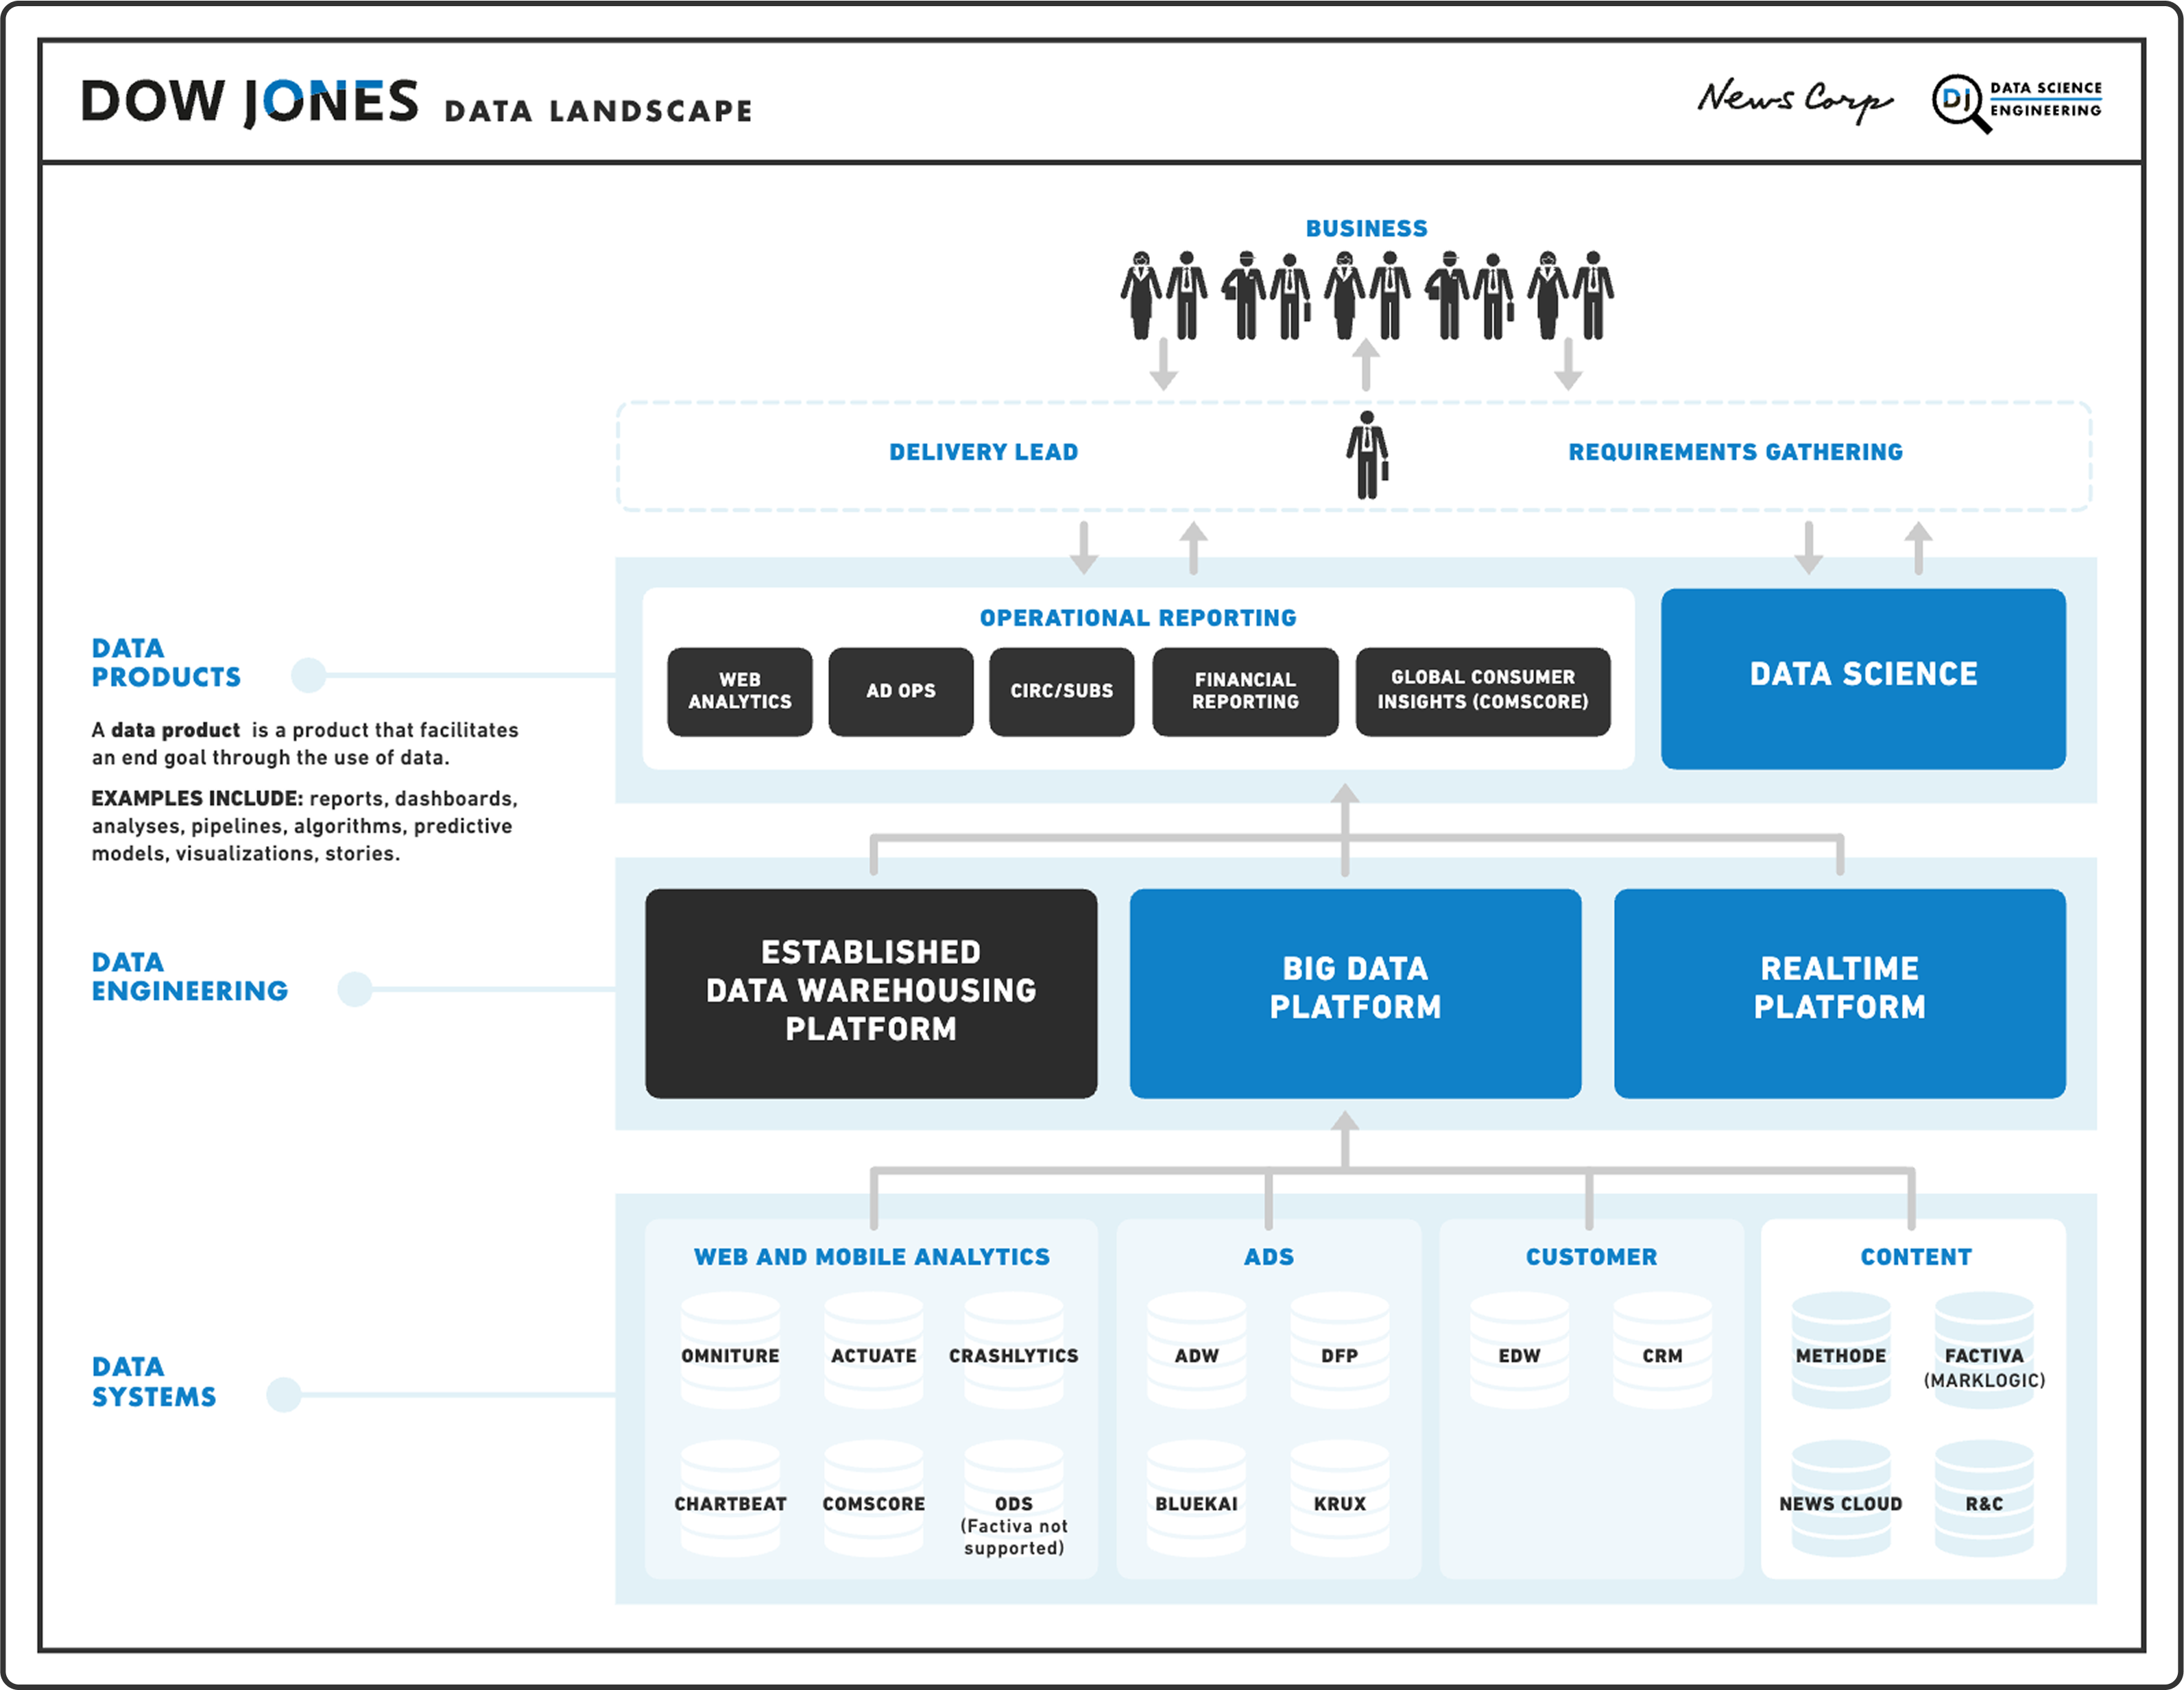
While part of the Data Science & Engineering team, design played a large role in communicating information and explaining process and concepts. I was responsible for creating infographics that were used on various presentations for News Corp and Dow Jones exectutives and leadership.
Responsibilities
- Visual Communication
- Explainer Diagrams
- Presentation Design
Dow Jones Infographics
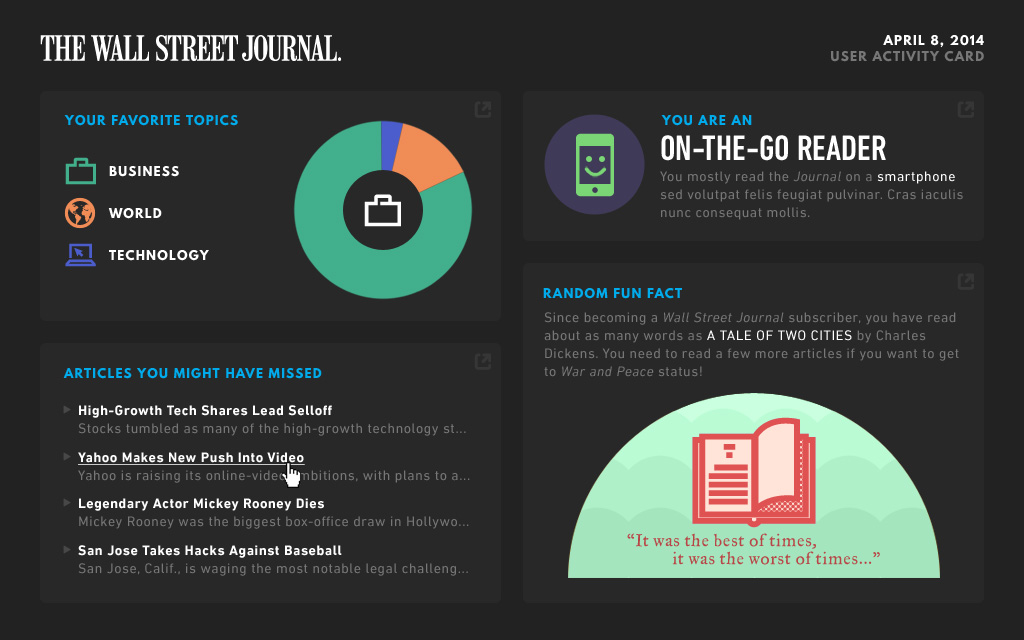
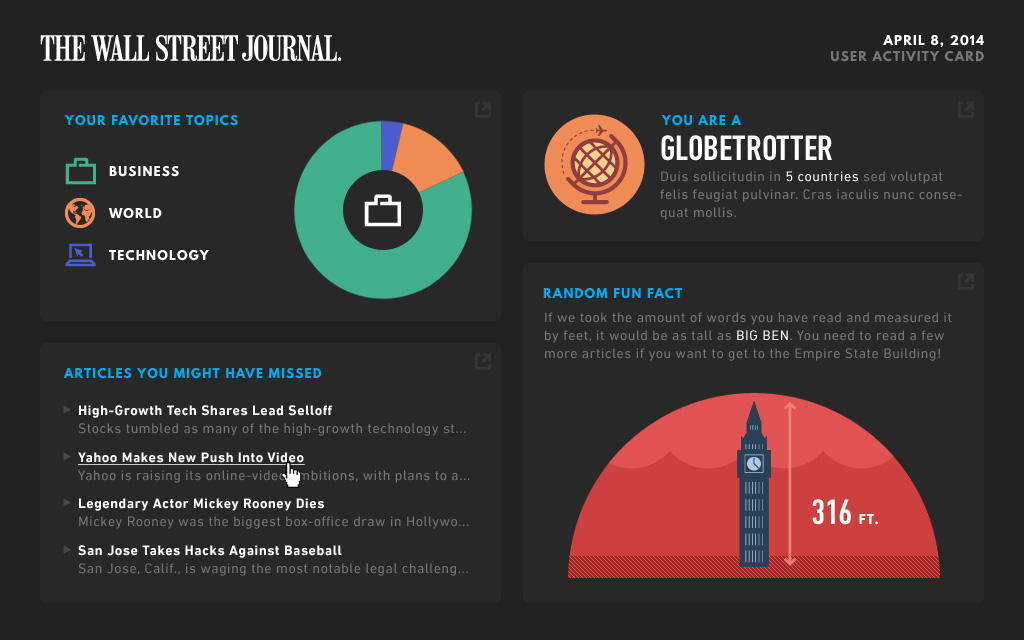
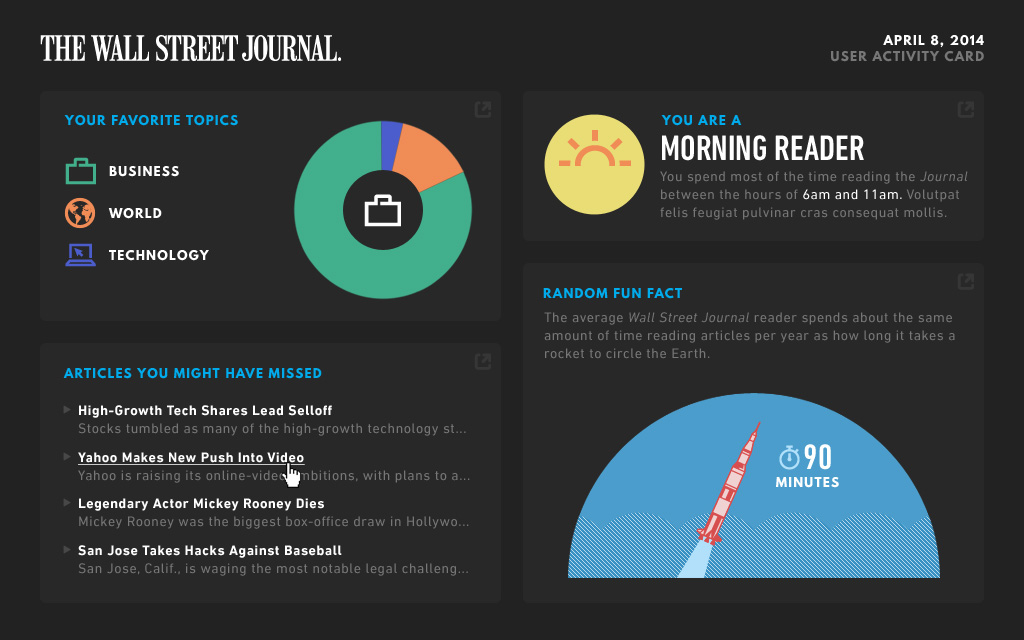
Wall Street Journal User Activity Cards
Infographic for News Corp
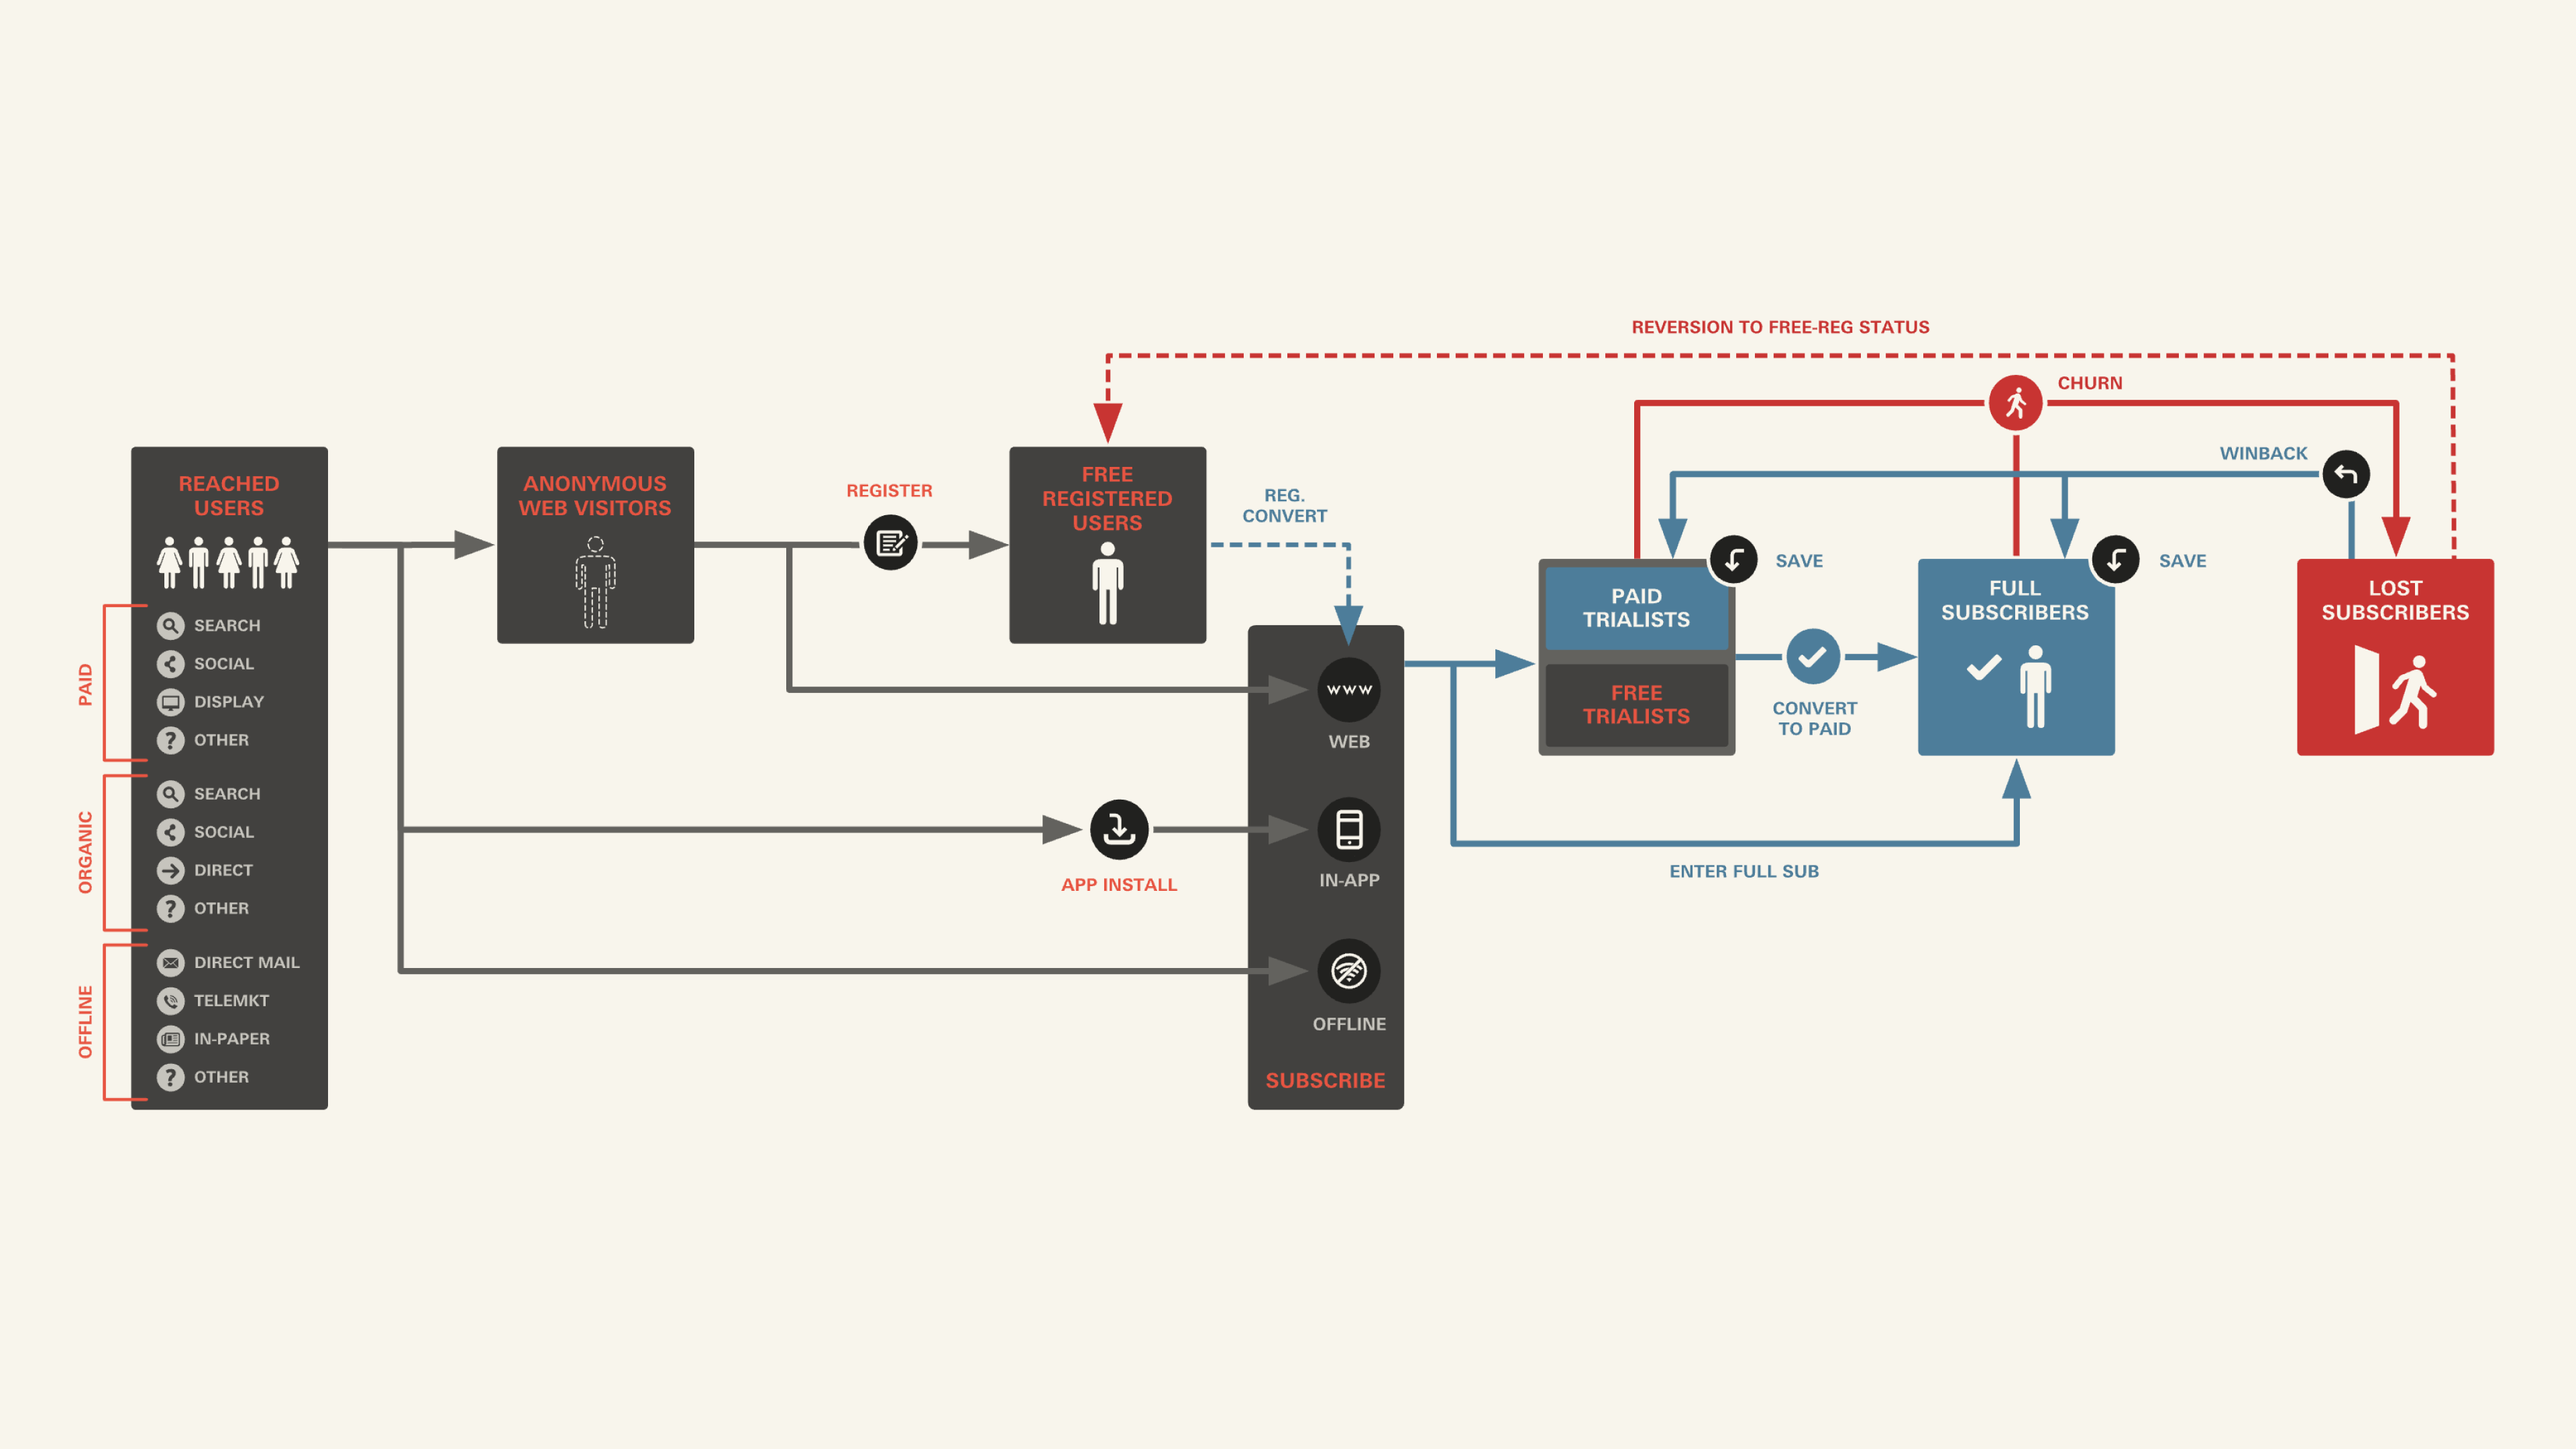
Infographic for The Wall Street Journal
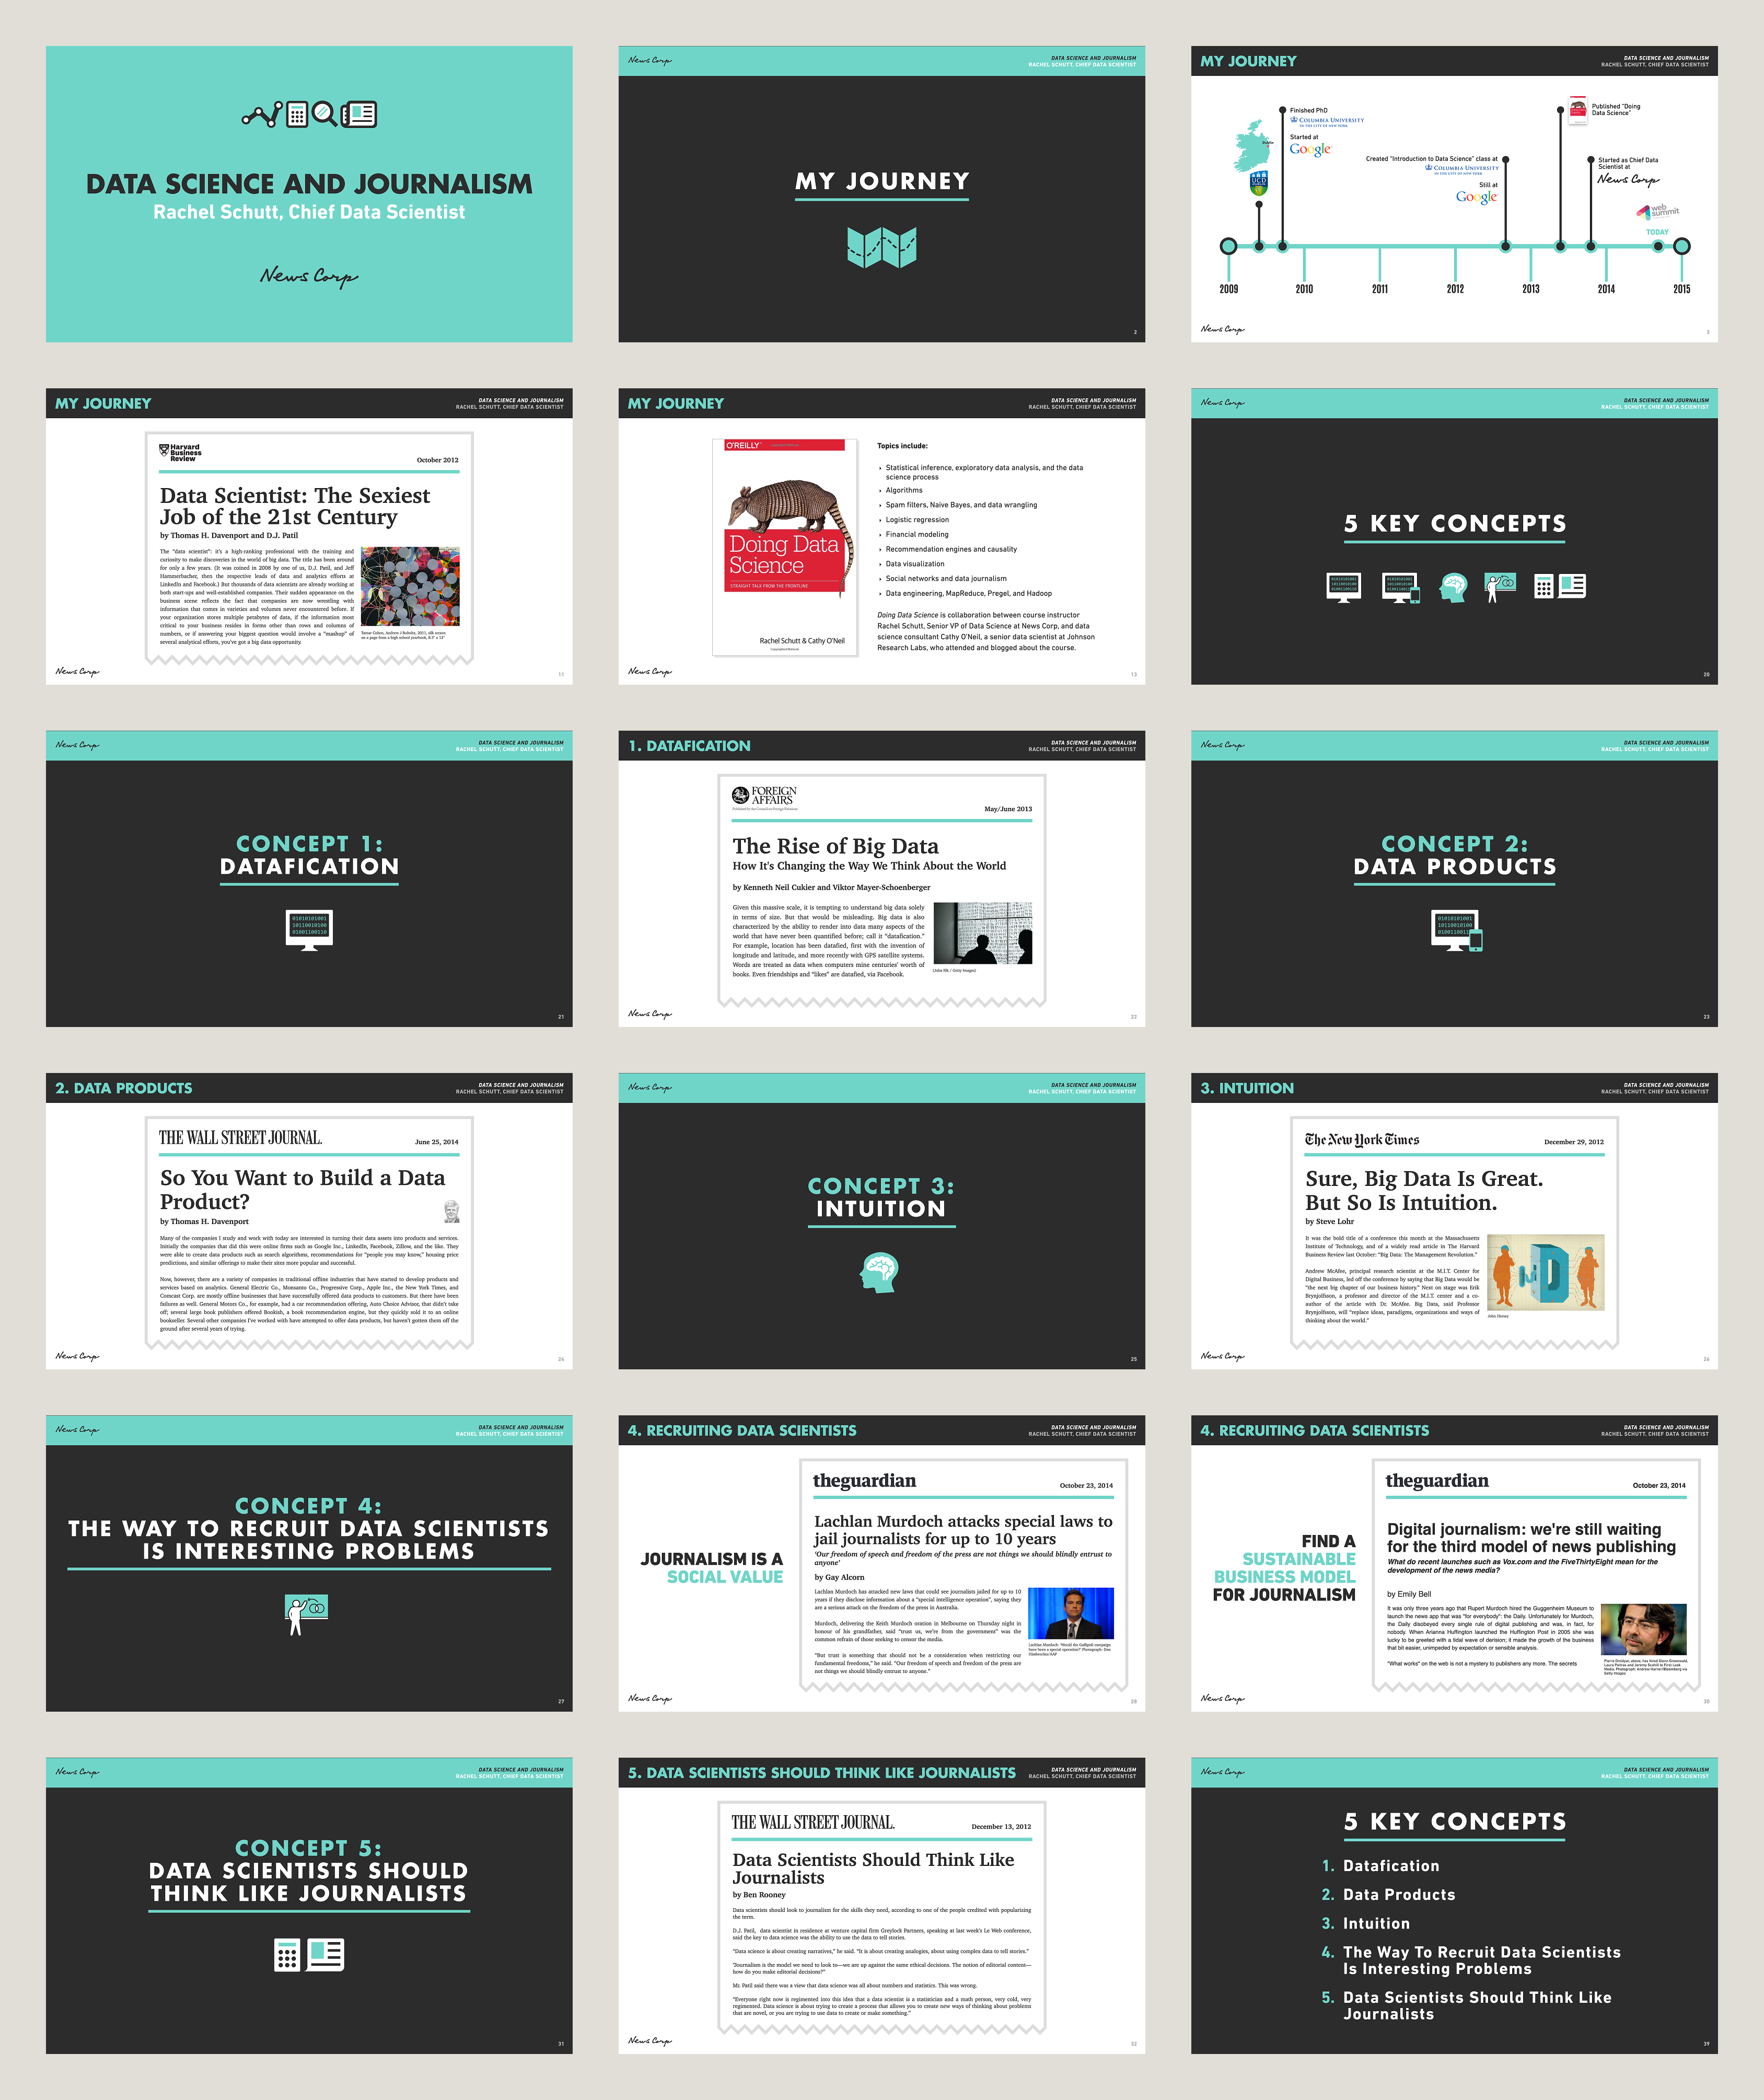
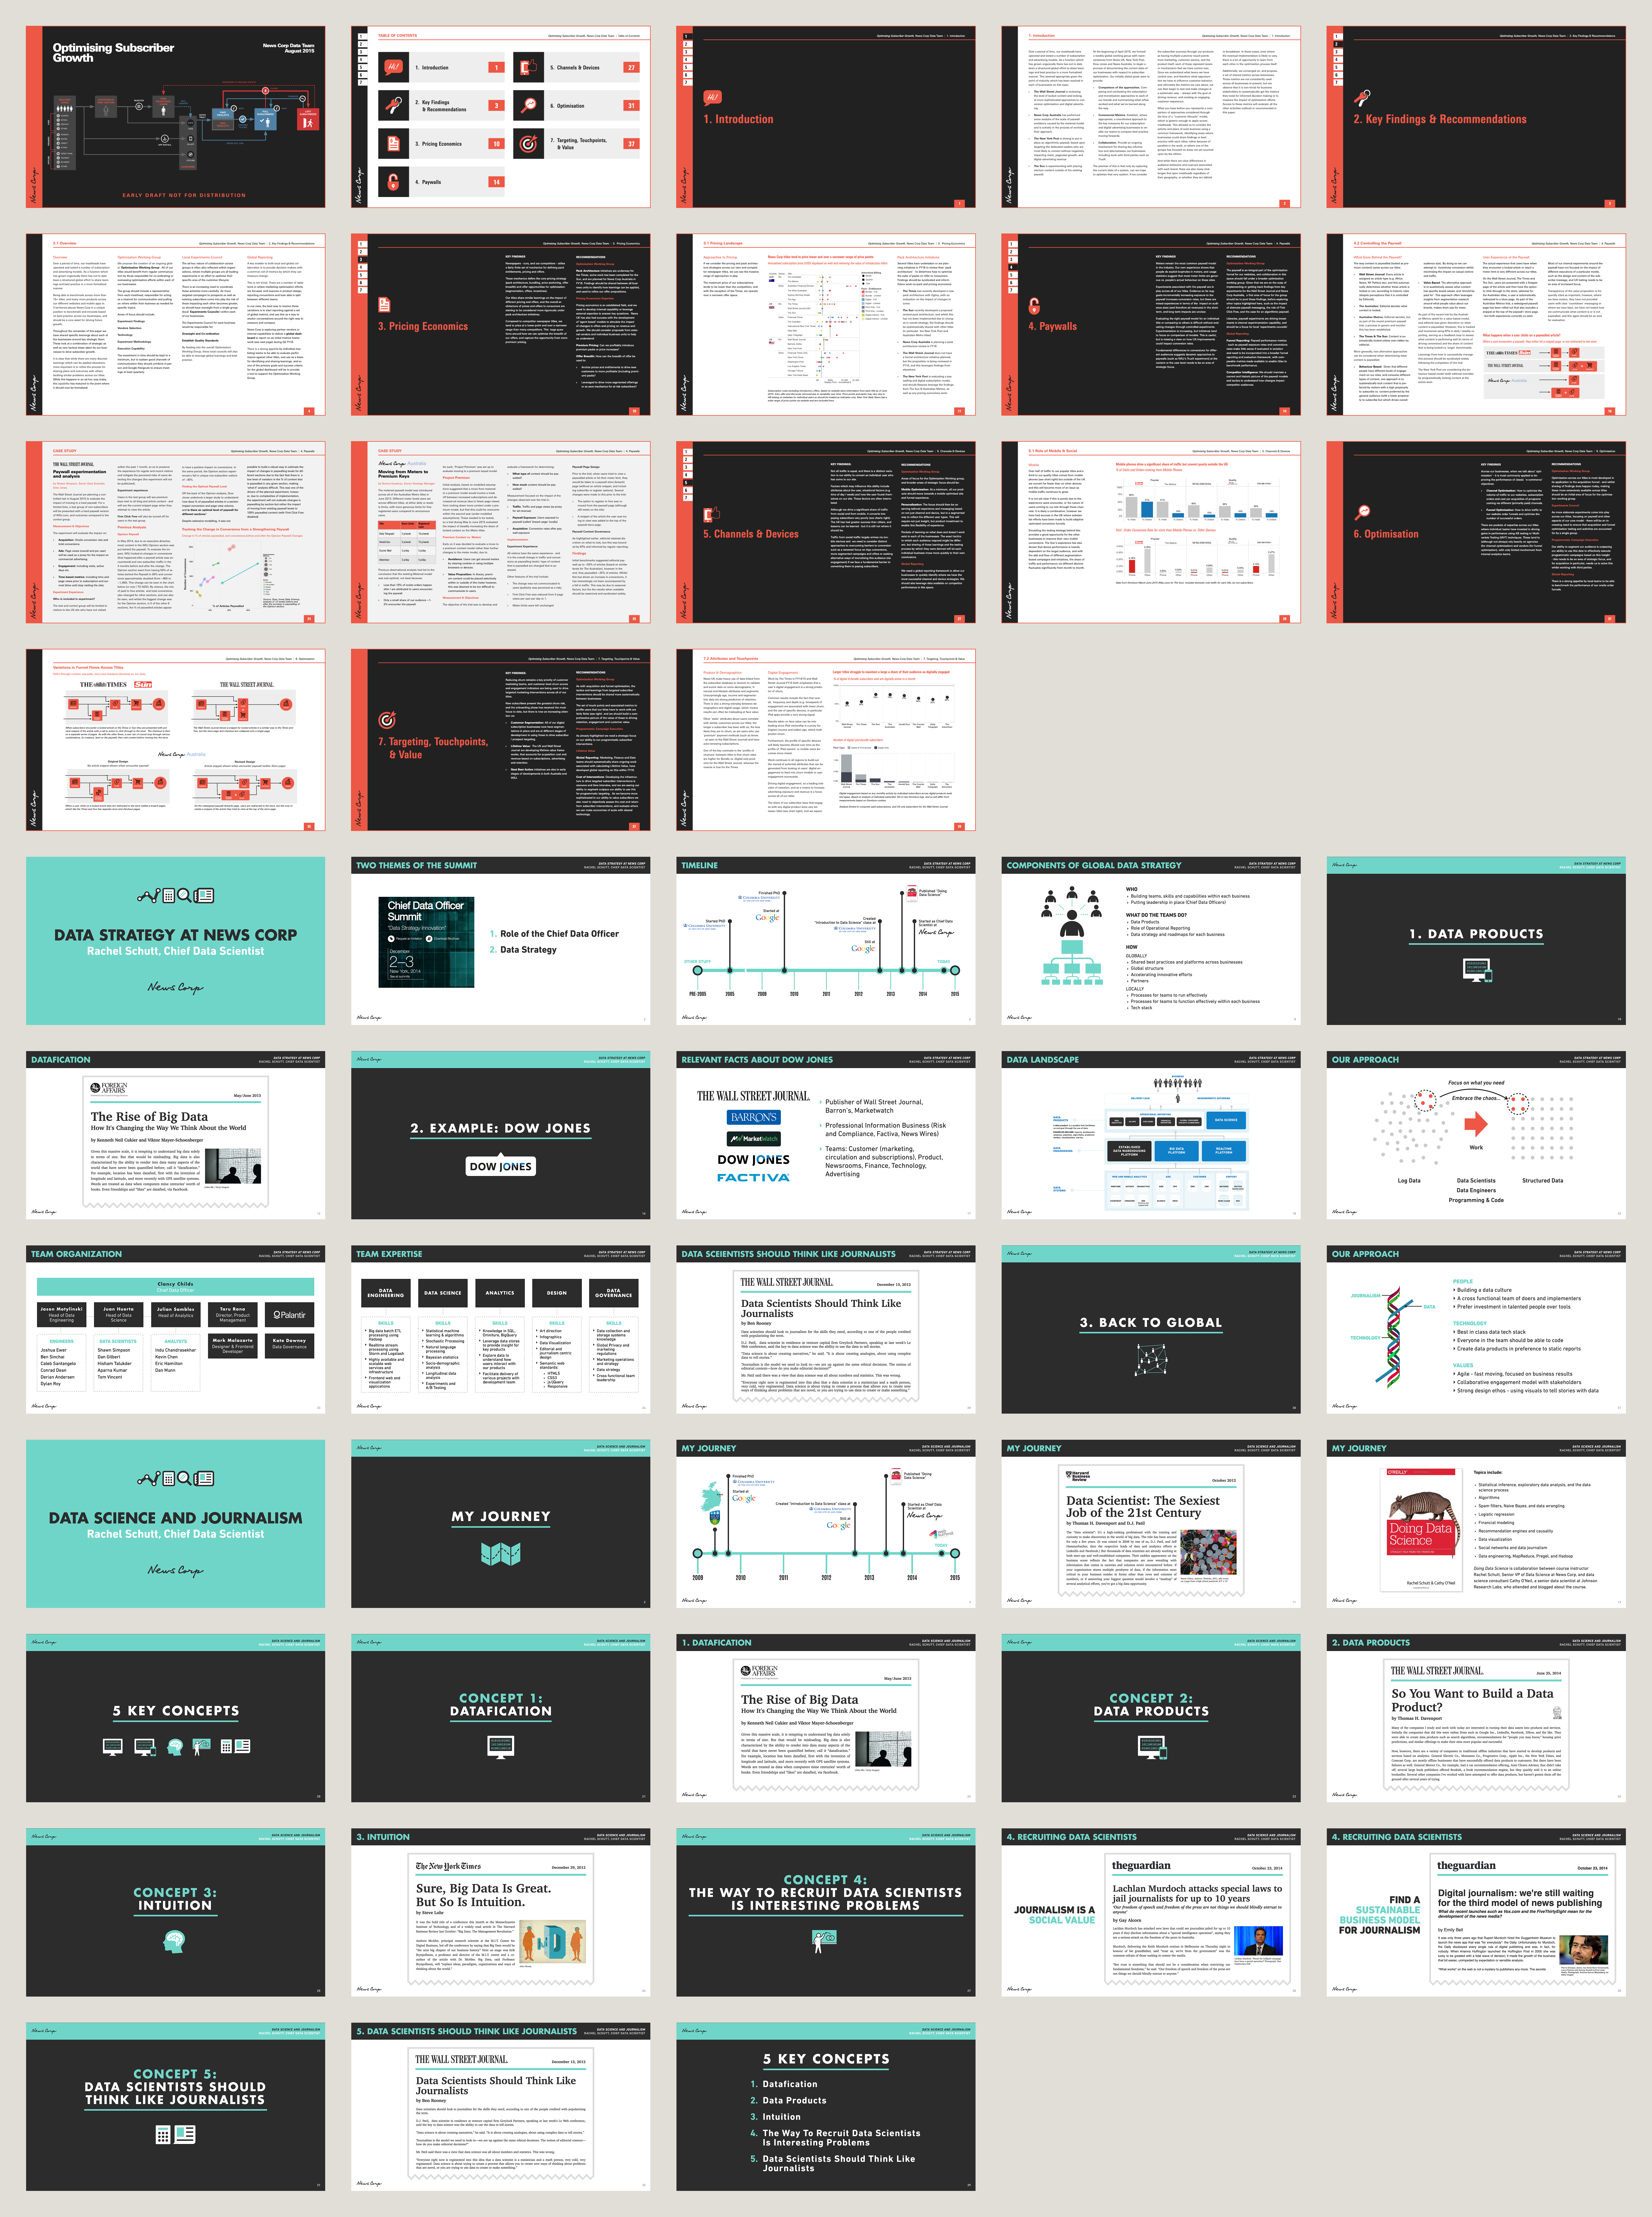
Presentations
Description
I worked alongside tech and product leads at News Corp and Dow Jones to design various presentations for both print and digital. These presentations were used in internal board meetings as well as seen by large public audiences.
Responsibilities
- Presentation Design
- Print Design
- Visual Communication
- Explainer Diagrams
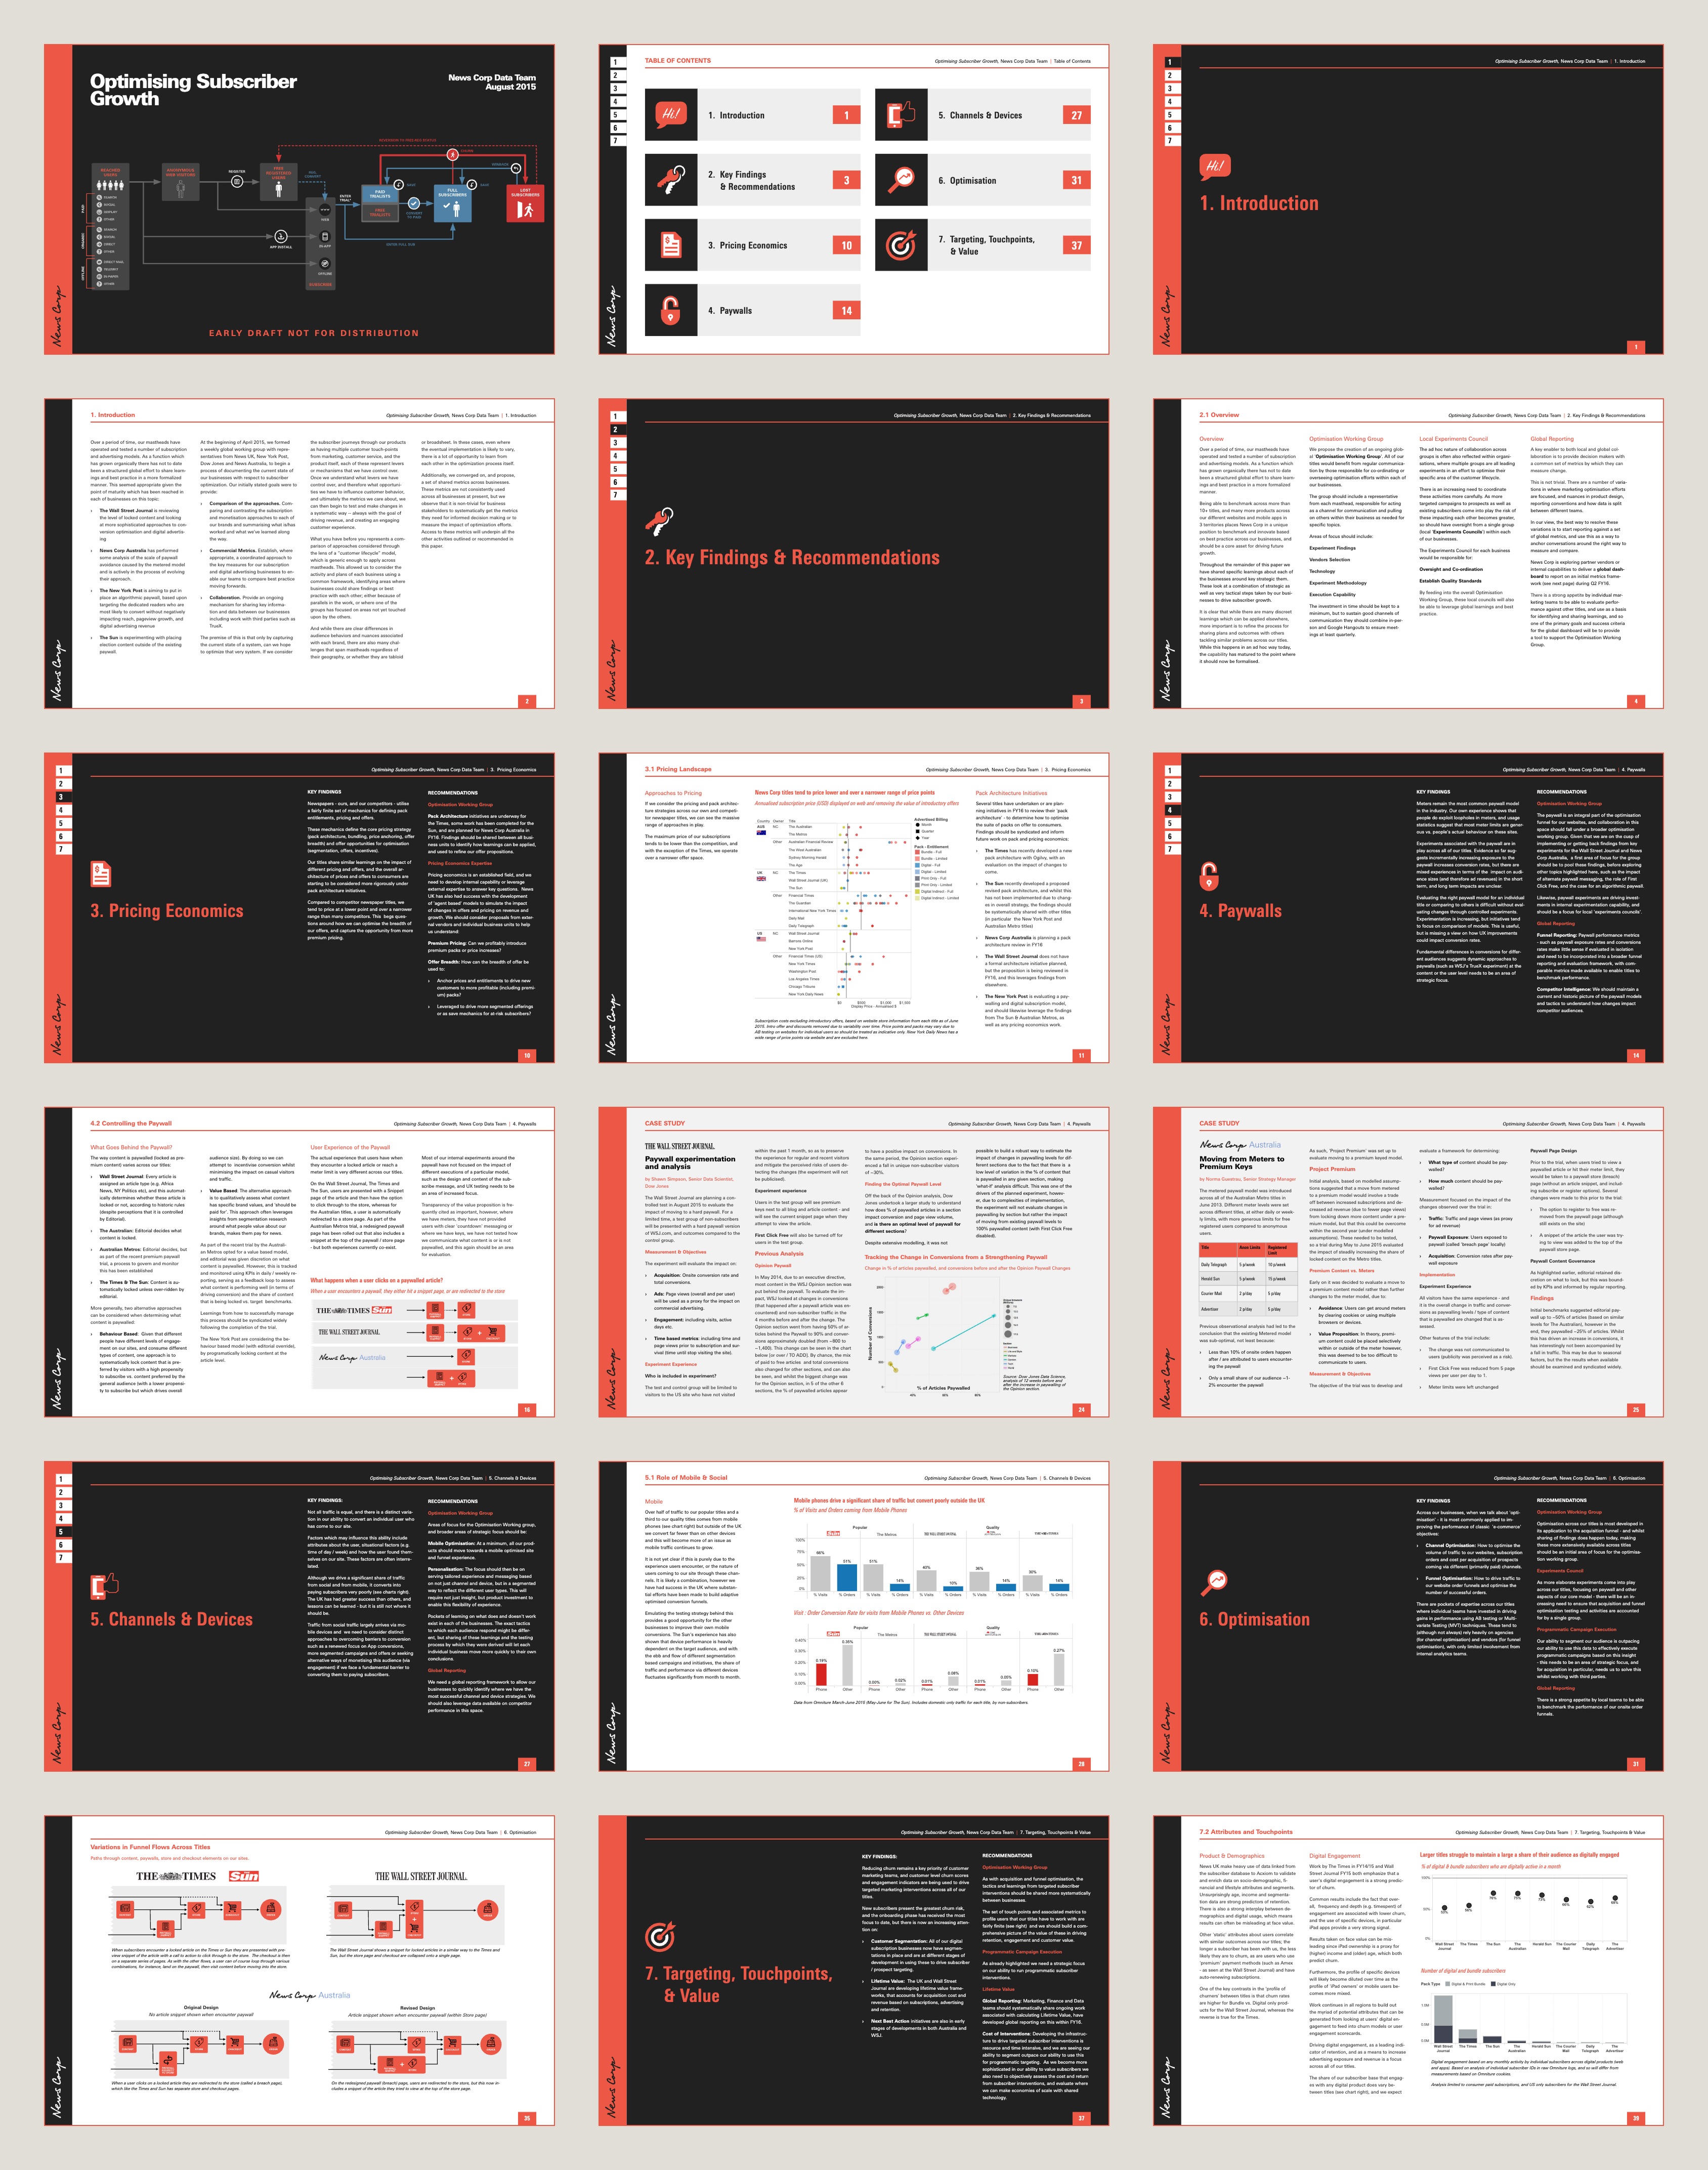
News Corp Data Team (2015)
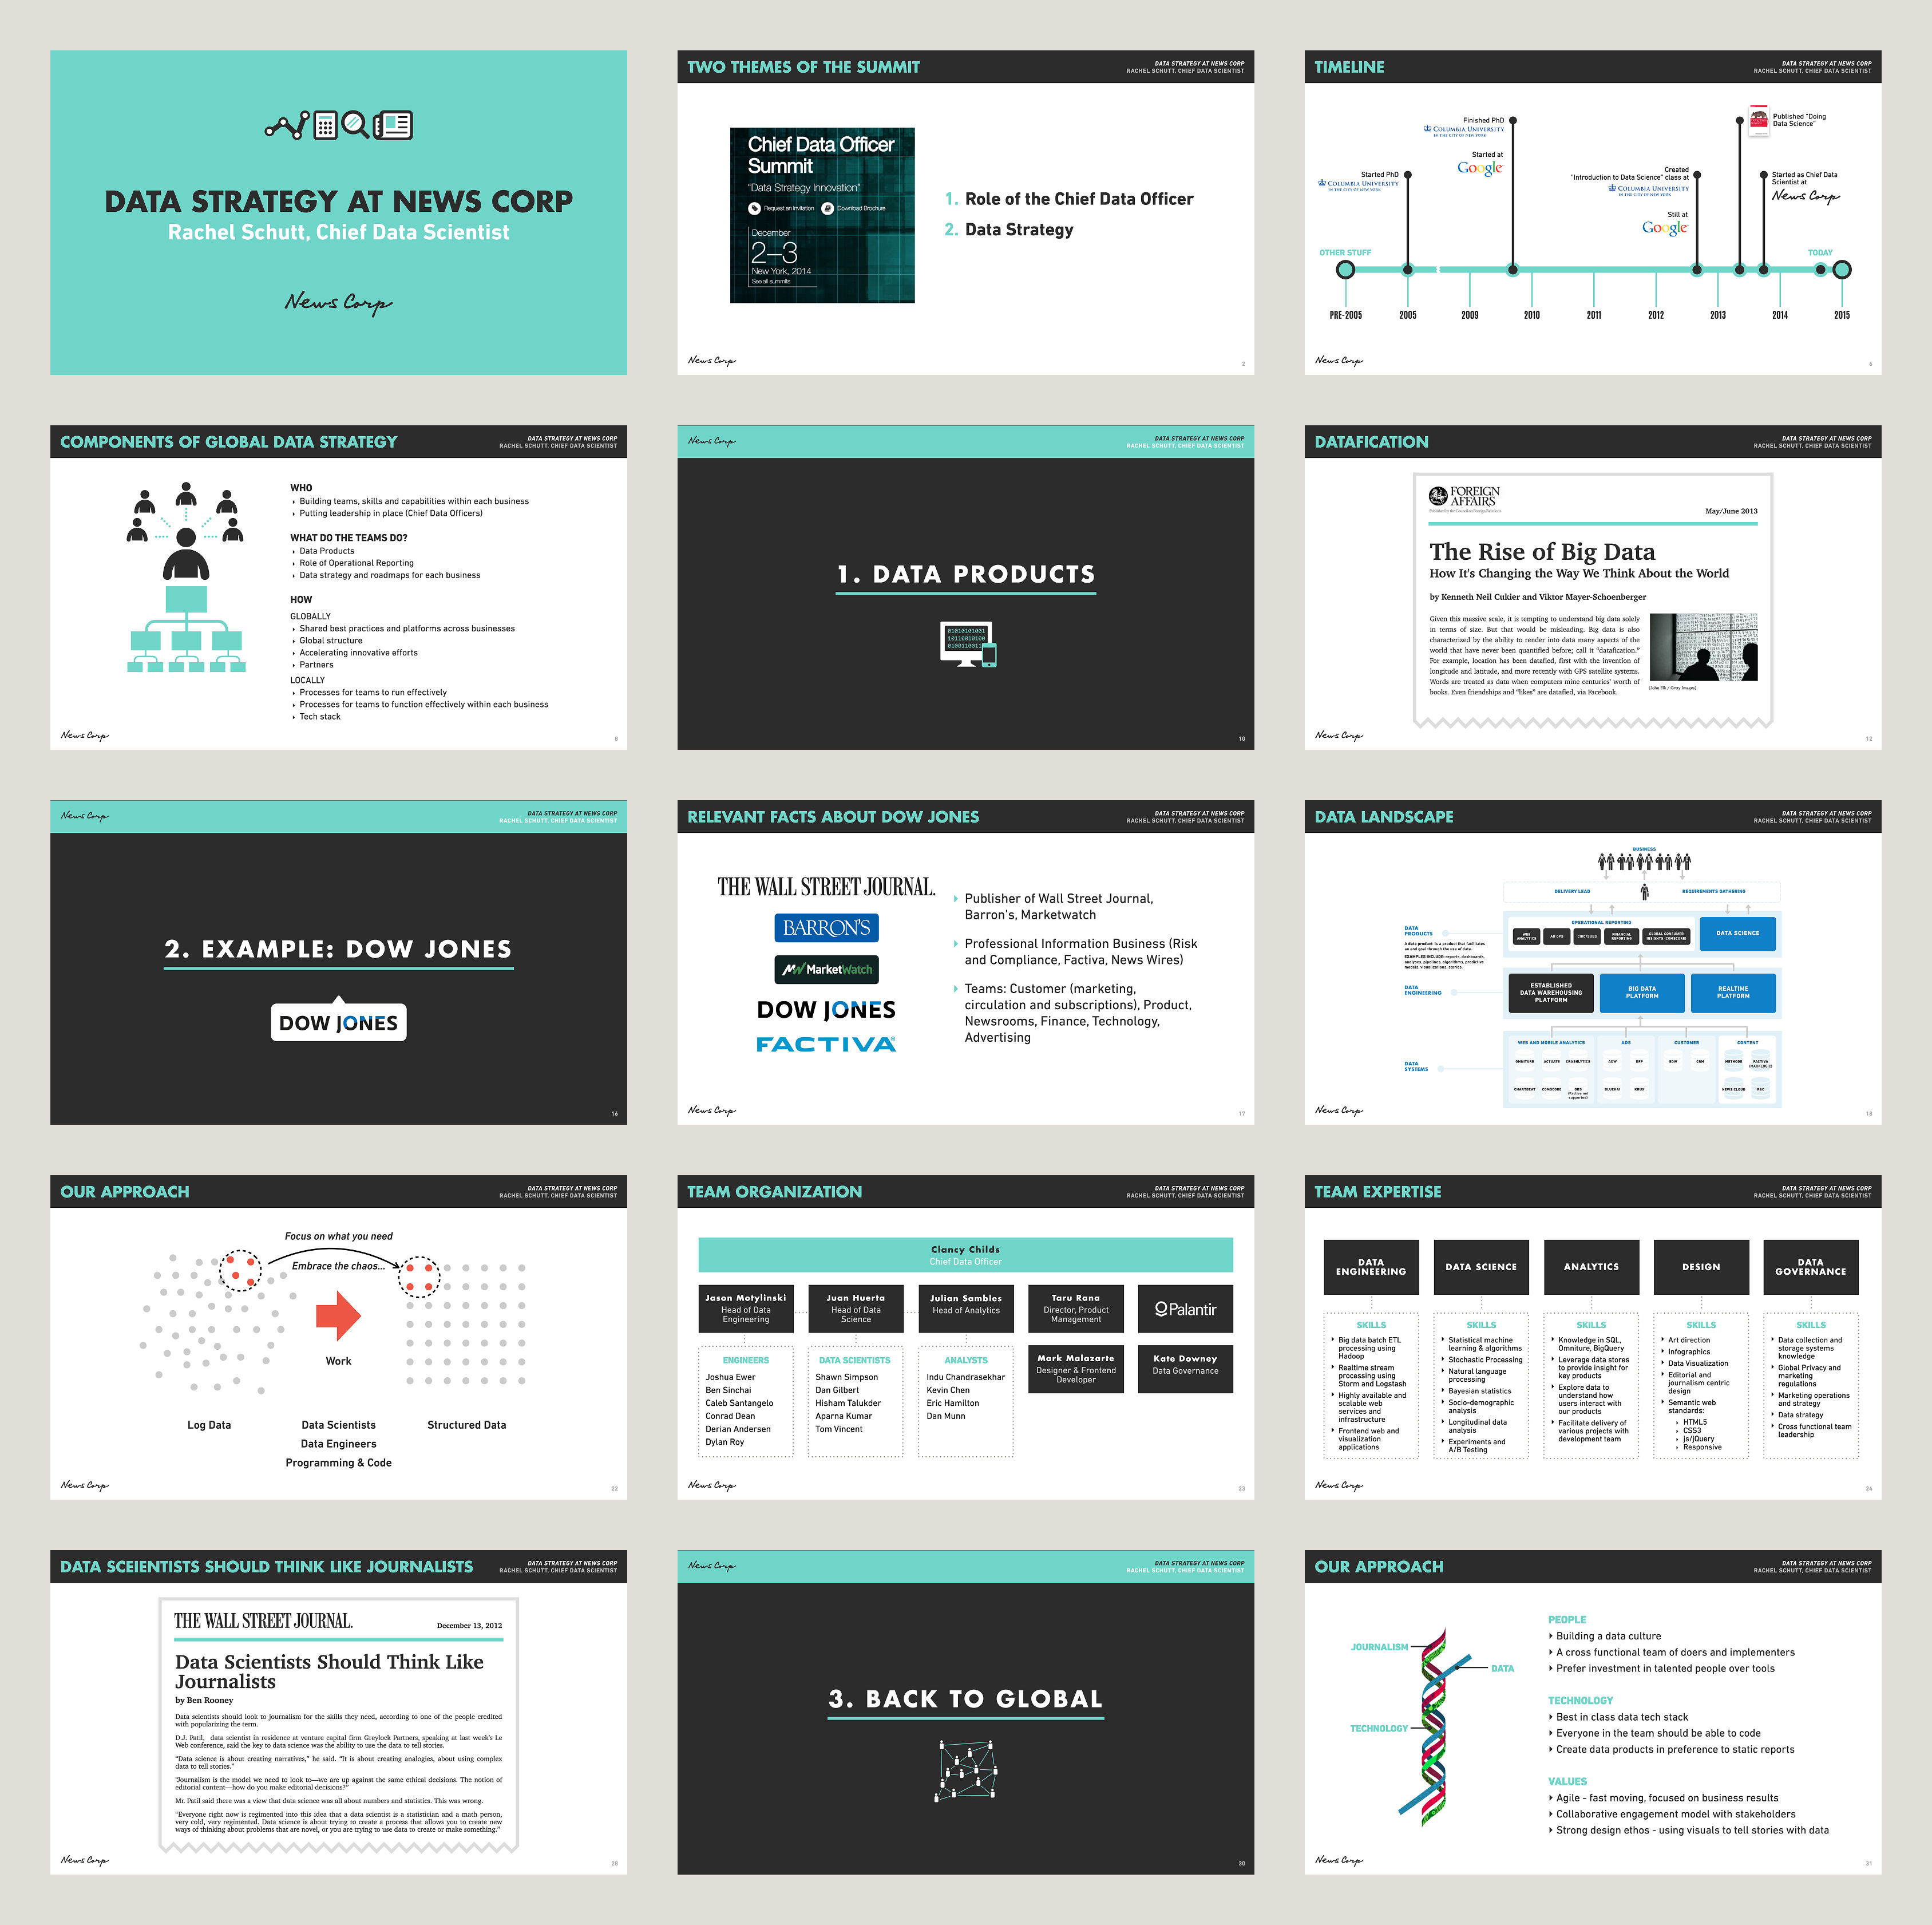
New York Chief Data Officer Summit (2014)
Dublin Web Summit (2014)