San Francisco Planning
Product Designer & Front-End Developer
Role
In this collaboration I worked alongside the San Francisco Planning department and design and research studio Openbox, in researching, designing, coding, and presenting this unique web experience.
This interactive data story was developed by mixing together both quantitative and qualitative research methods to reveal patterns and insights of San Francisco’s parklets program.
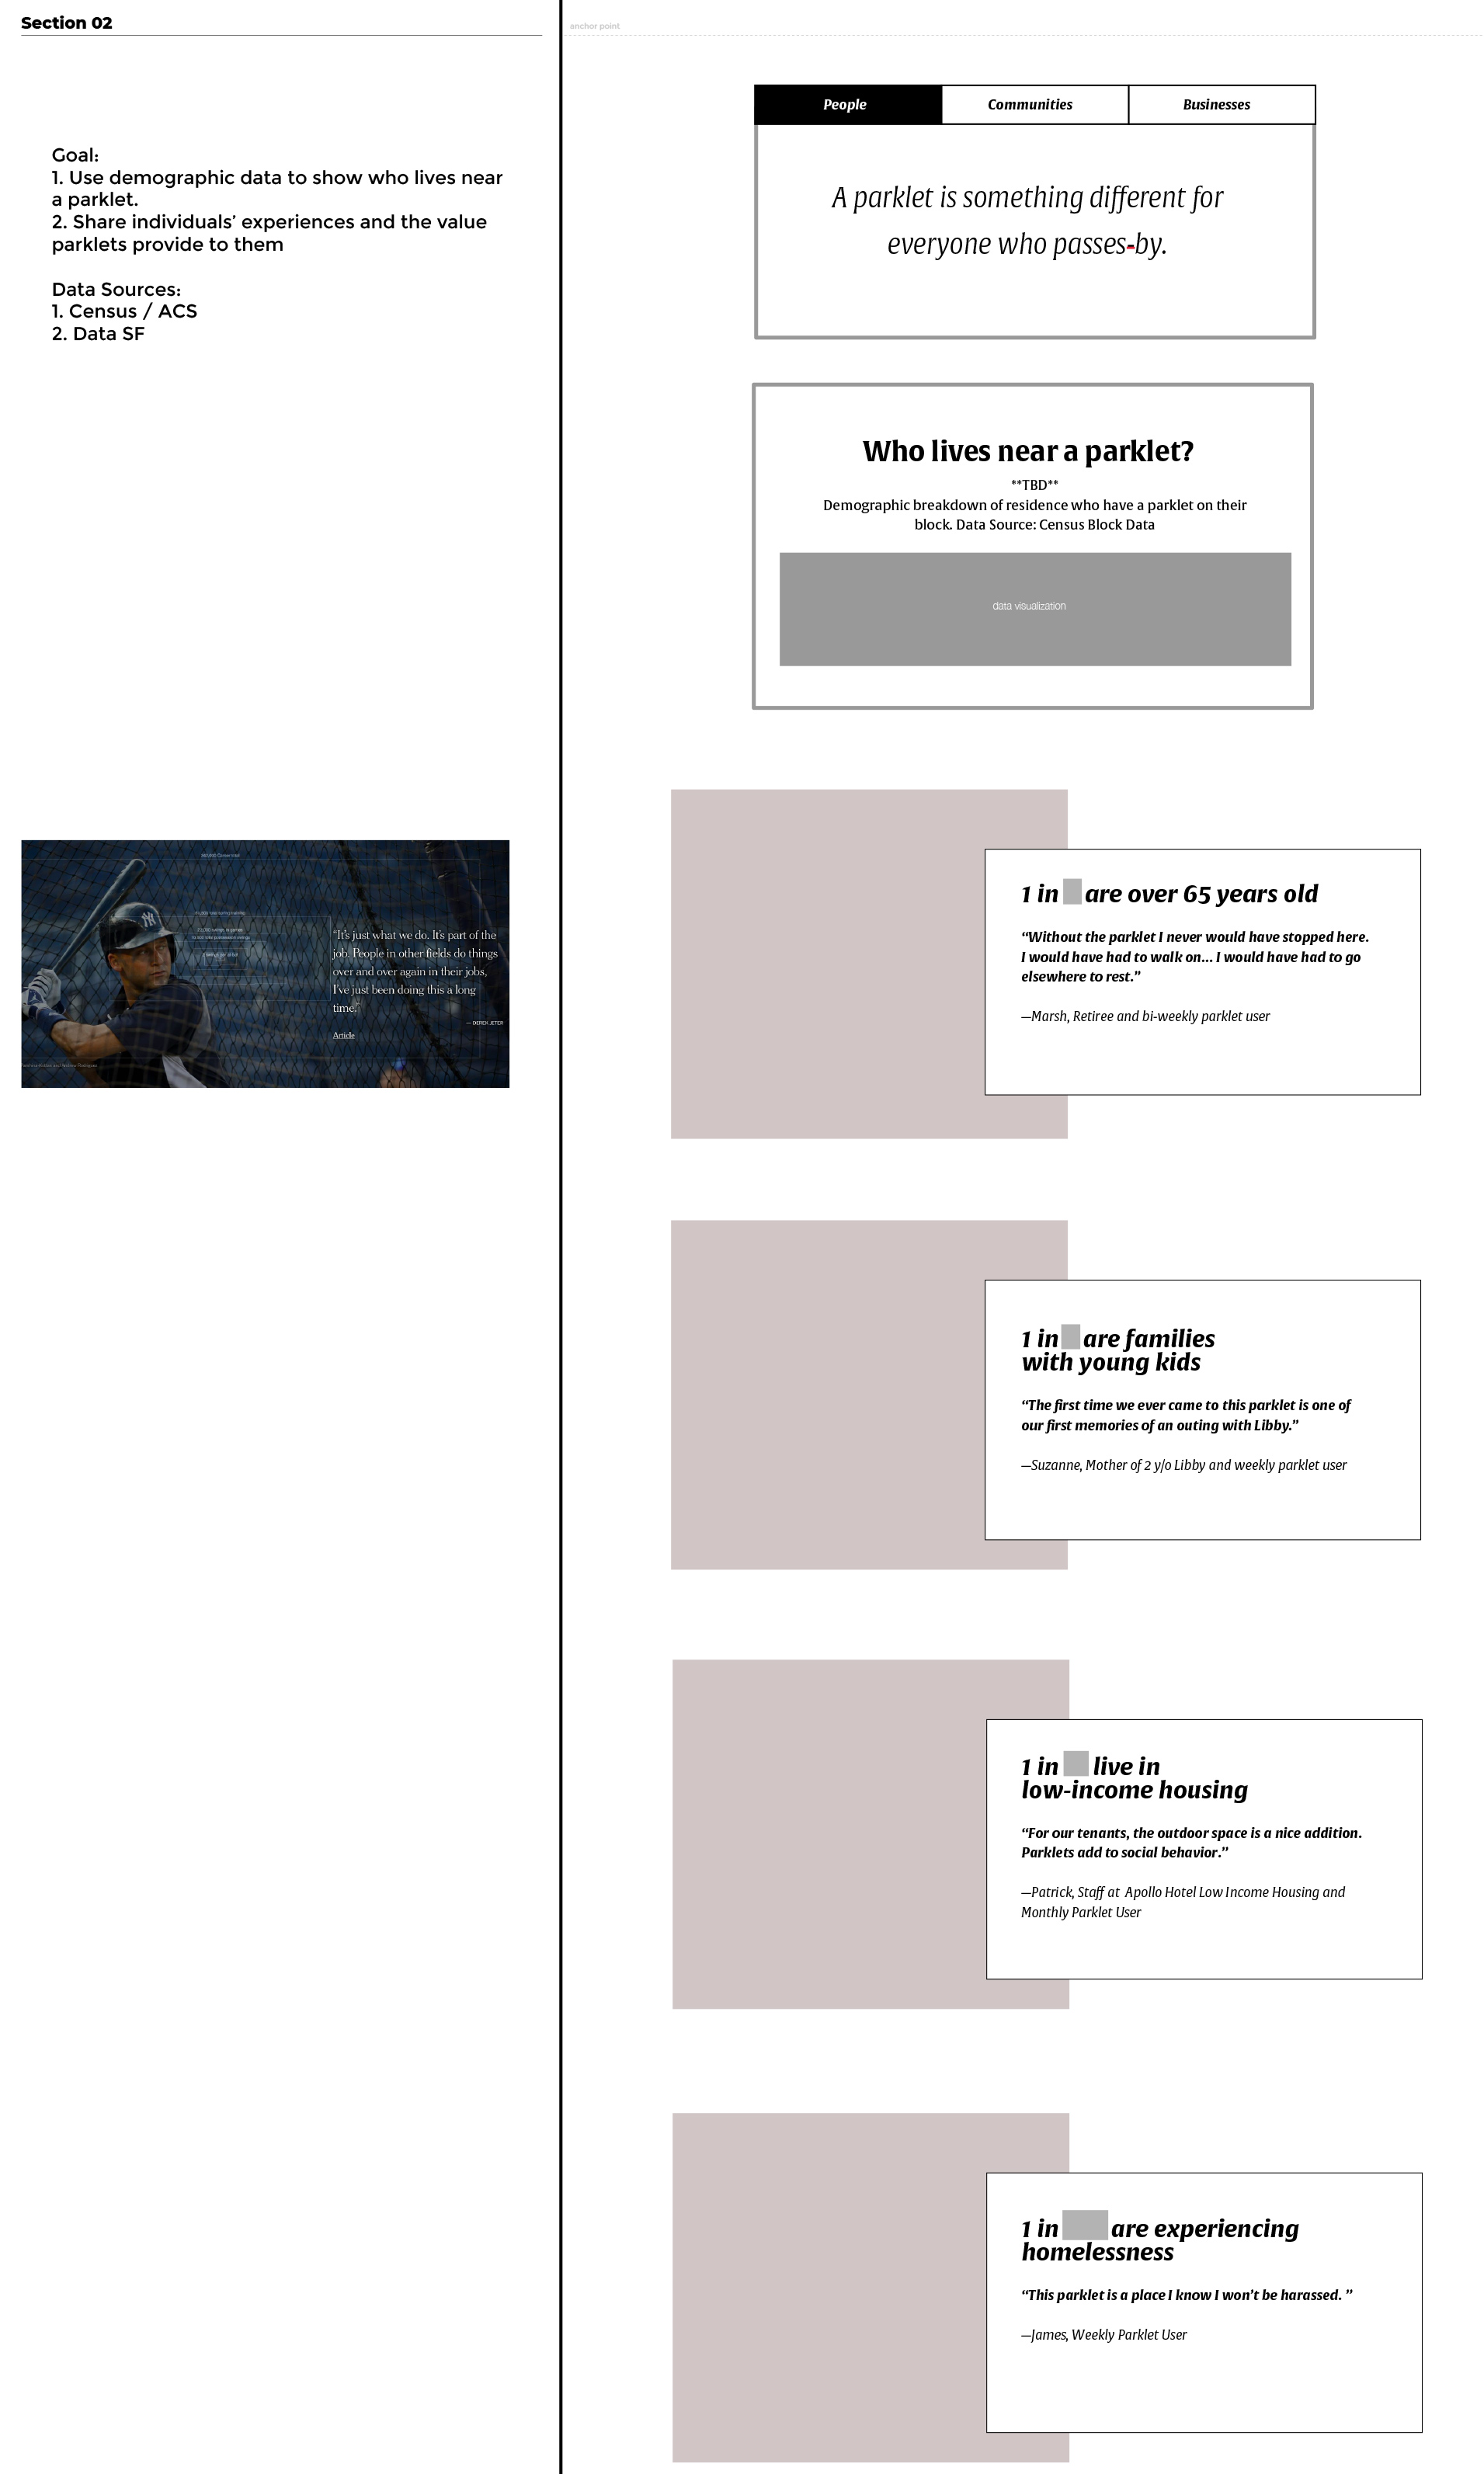
The goal of this project was to look at the impact and benefits of parklets using a people-centric and data-driven approach.
Responsibilities
Jump To Section

Overview

Collaboration
Research

Design

Deliverables
Overview
Description
The goal of this project was to look at the impact and benefits of parklets using a people-centric and
data-driven approach.
This interactive data story was developed by mixing together both quantitative and qualitative research methods to
reveal patterns and insights of San Francisco’s parklets program.
Year
2019
Industry
Government, Civic Tech
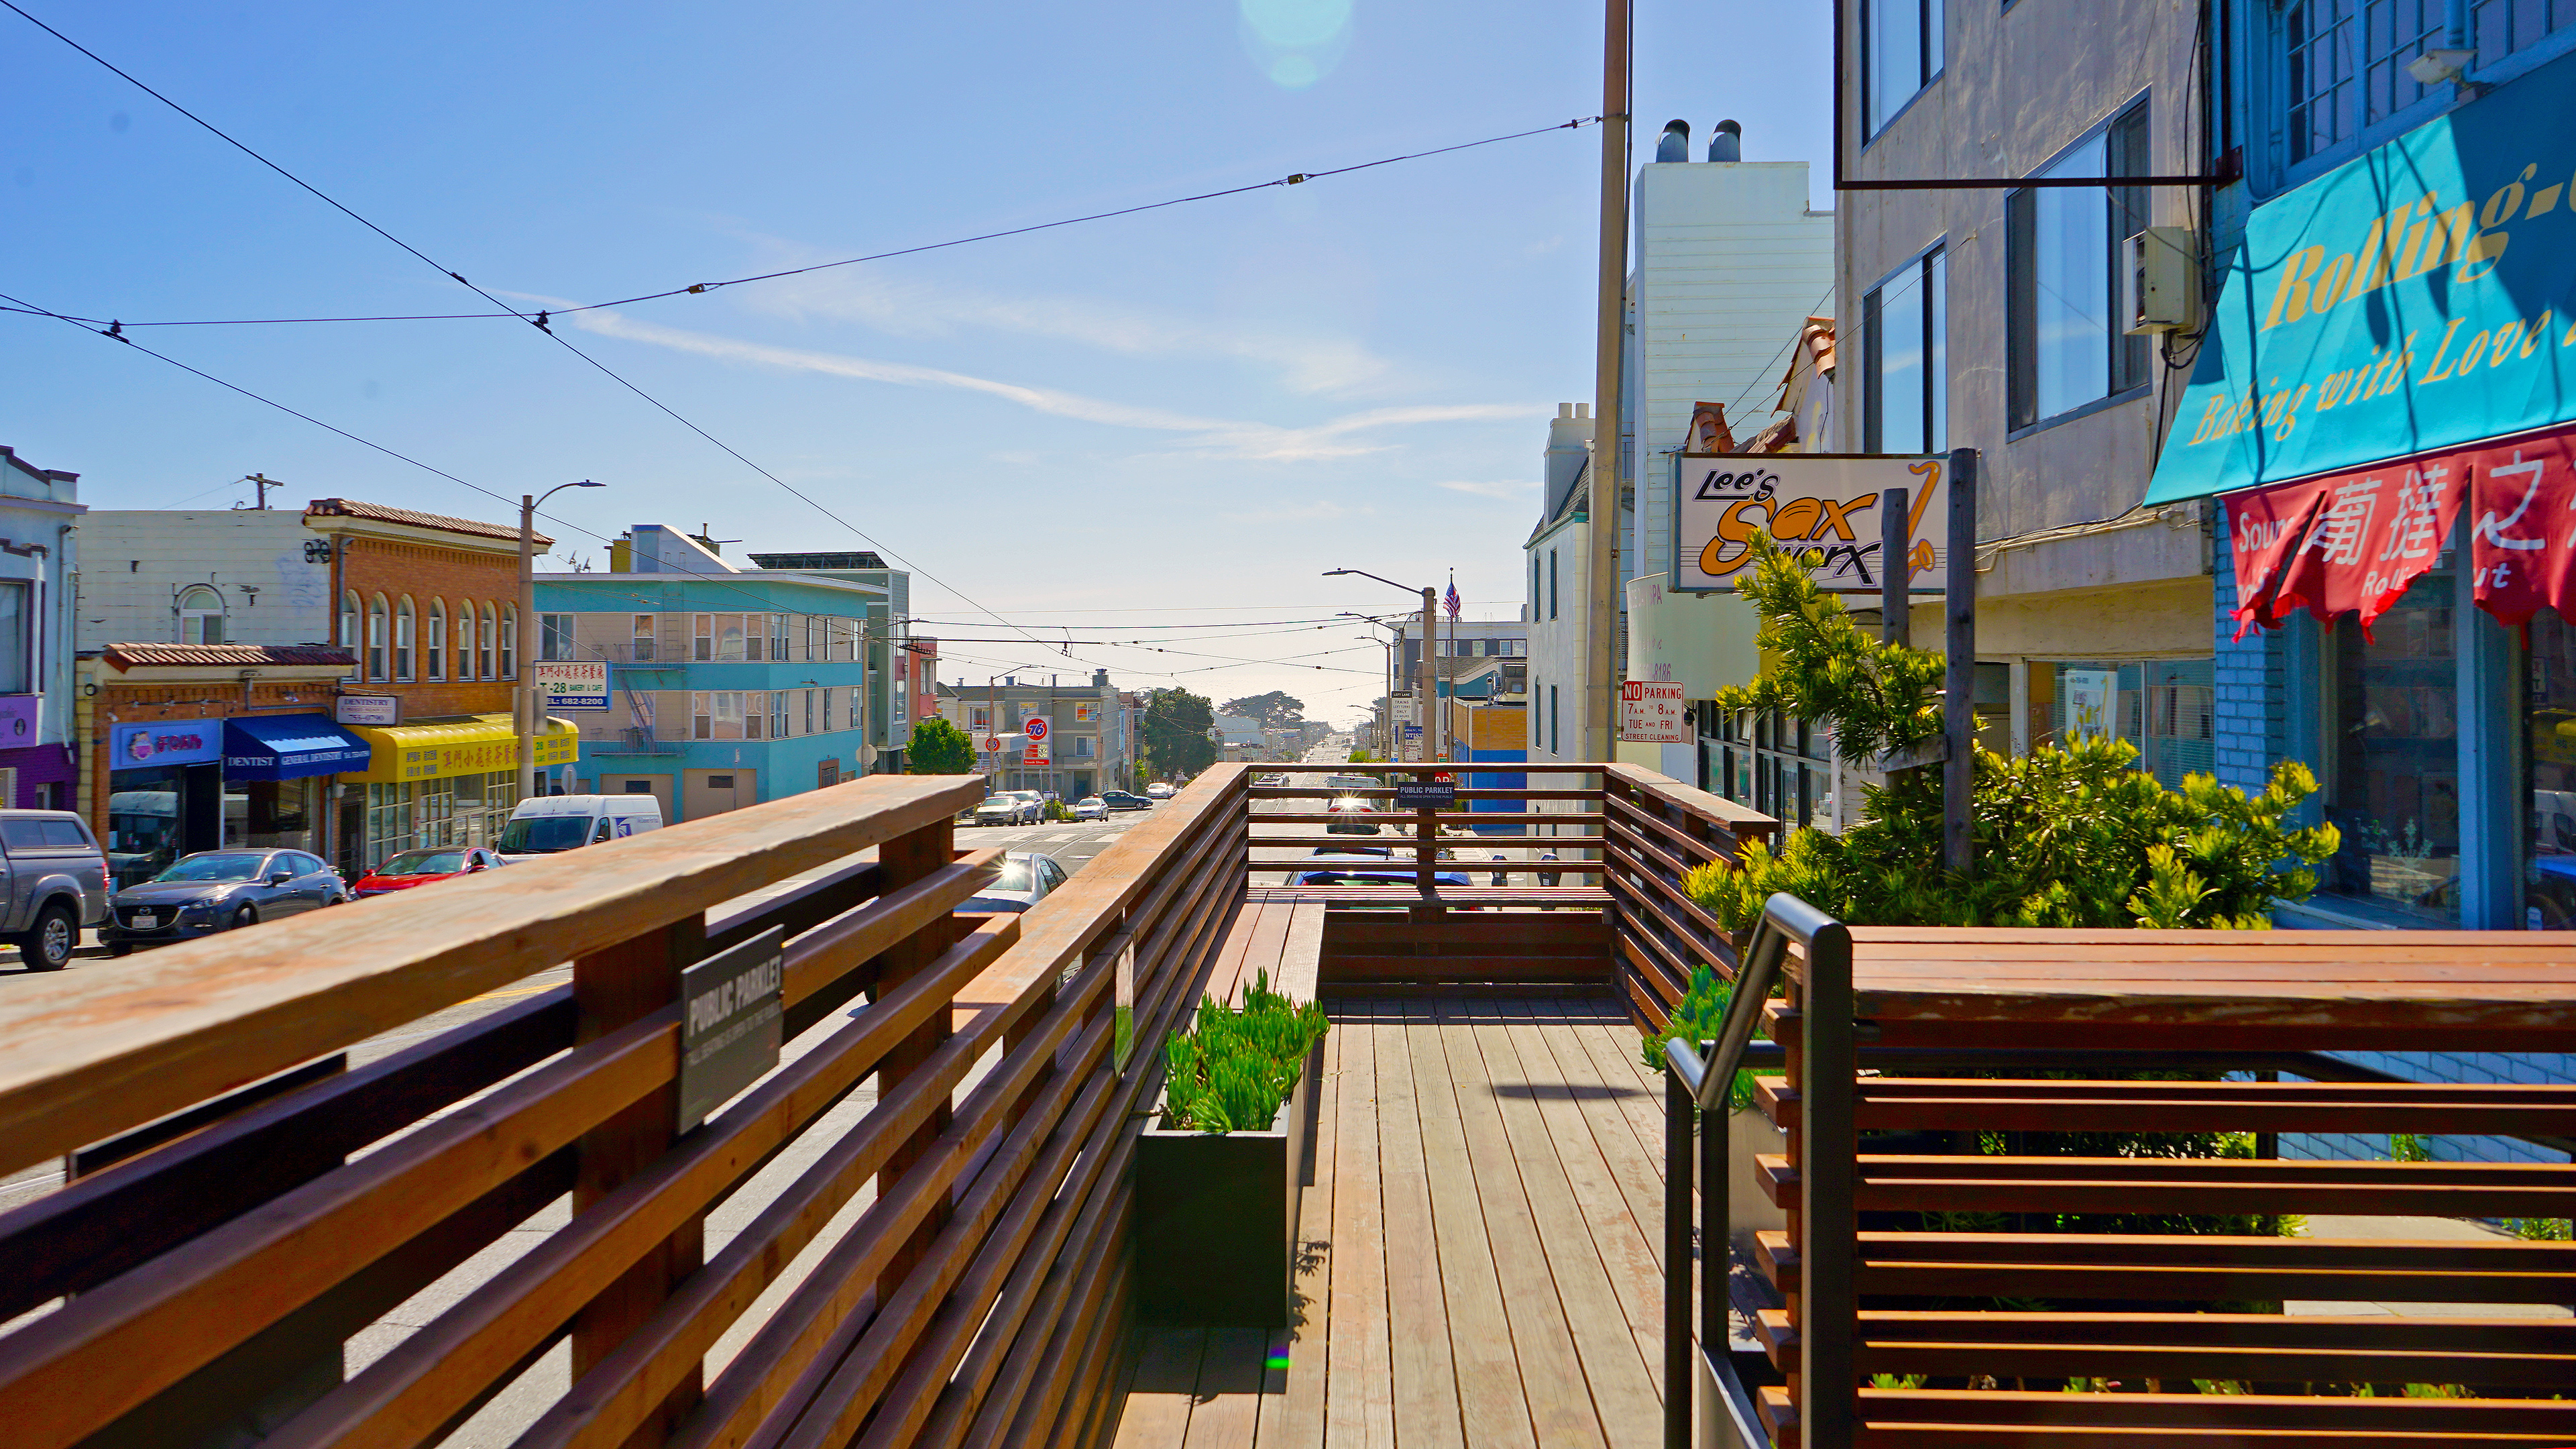
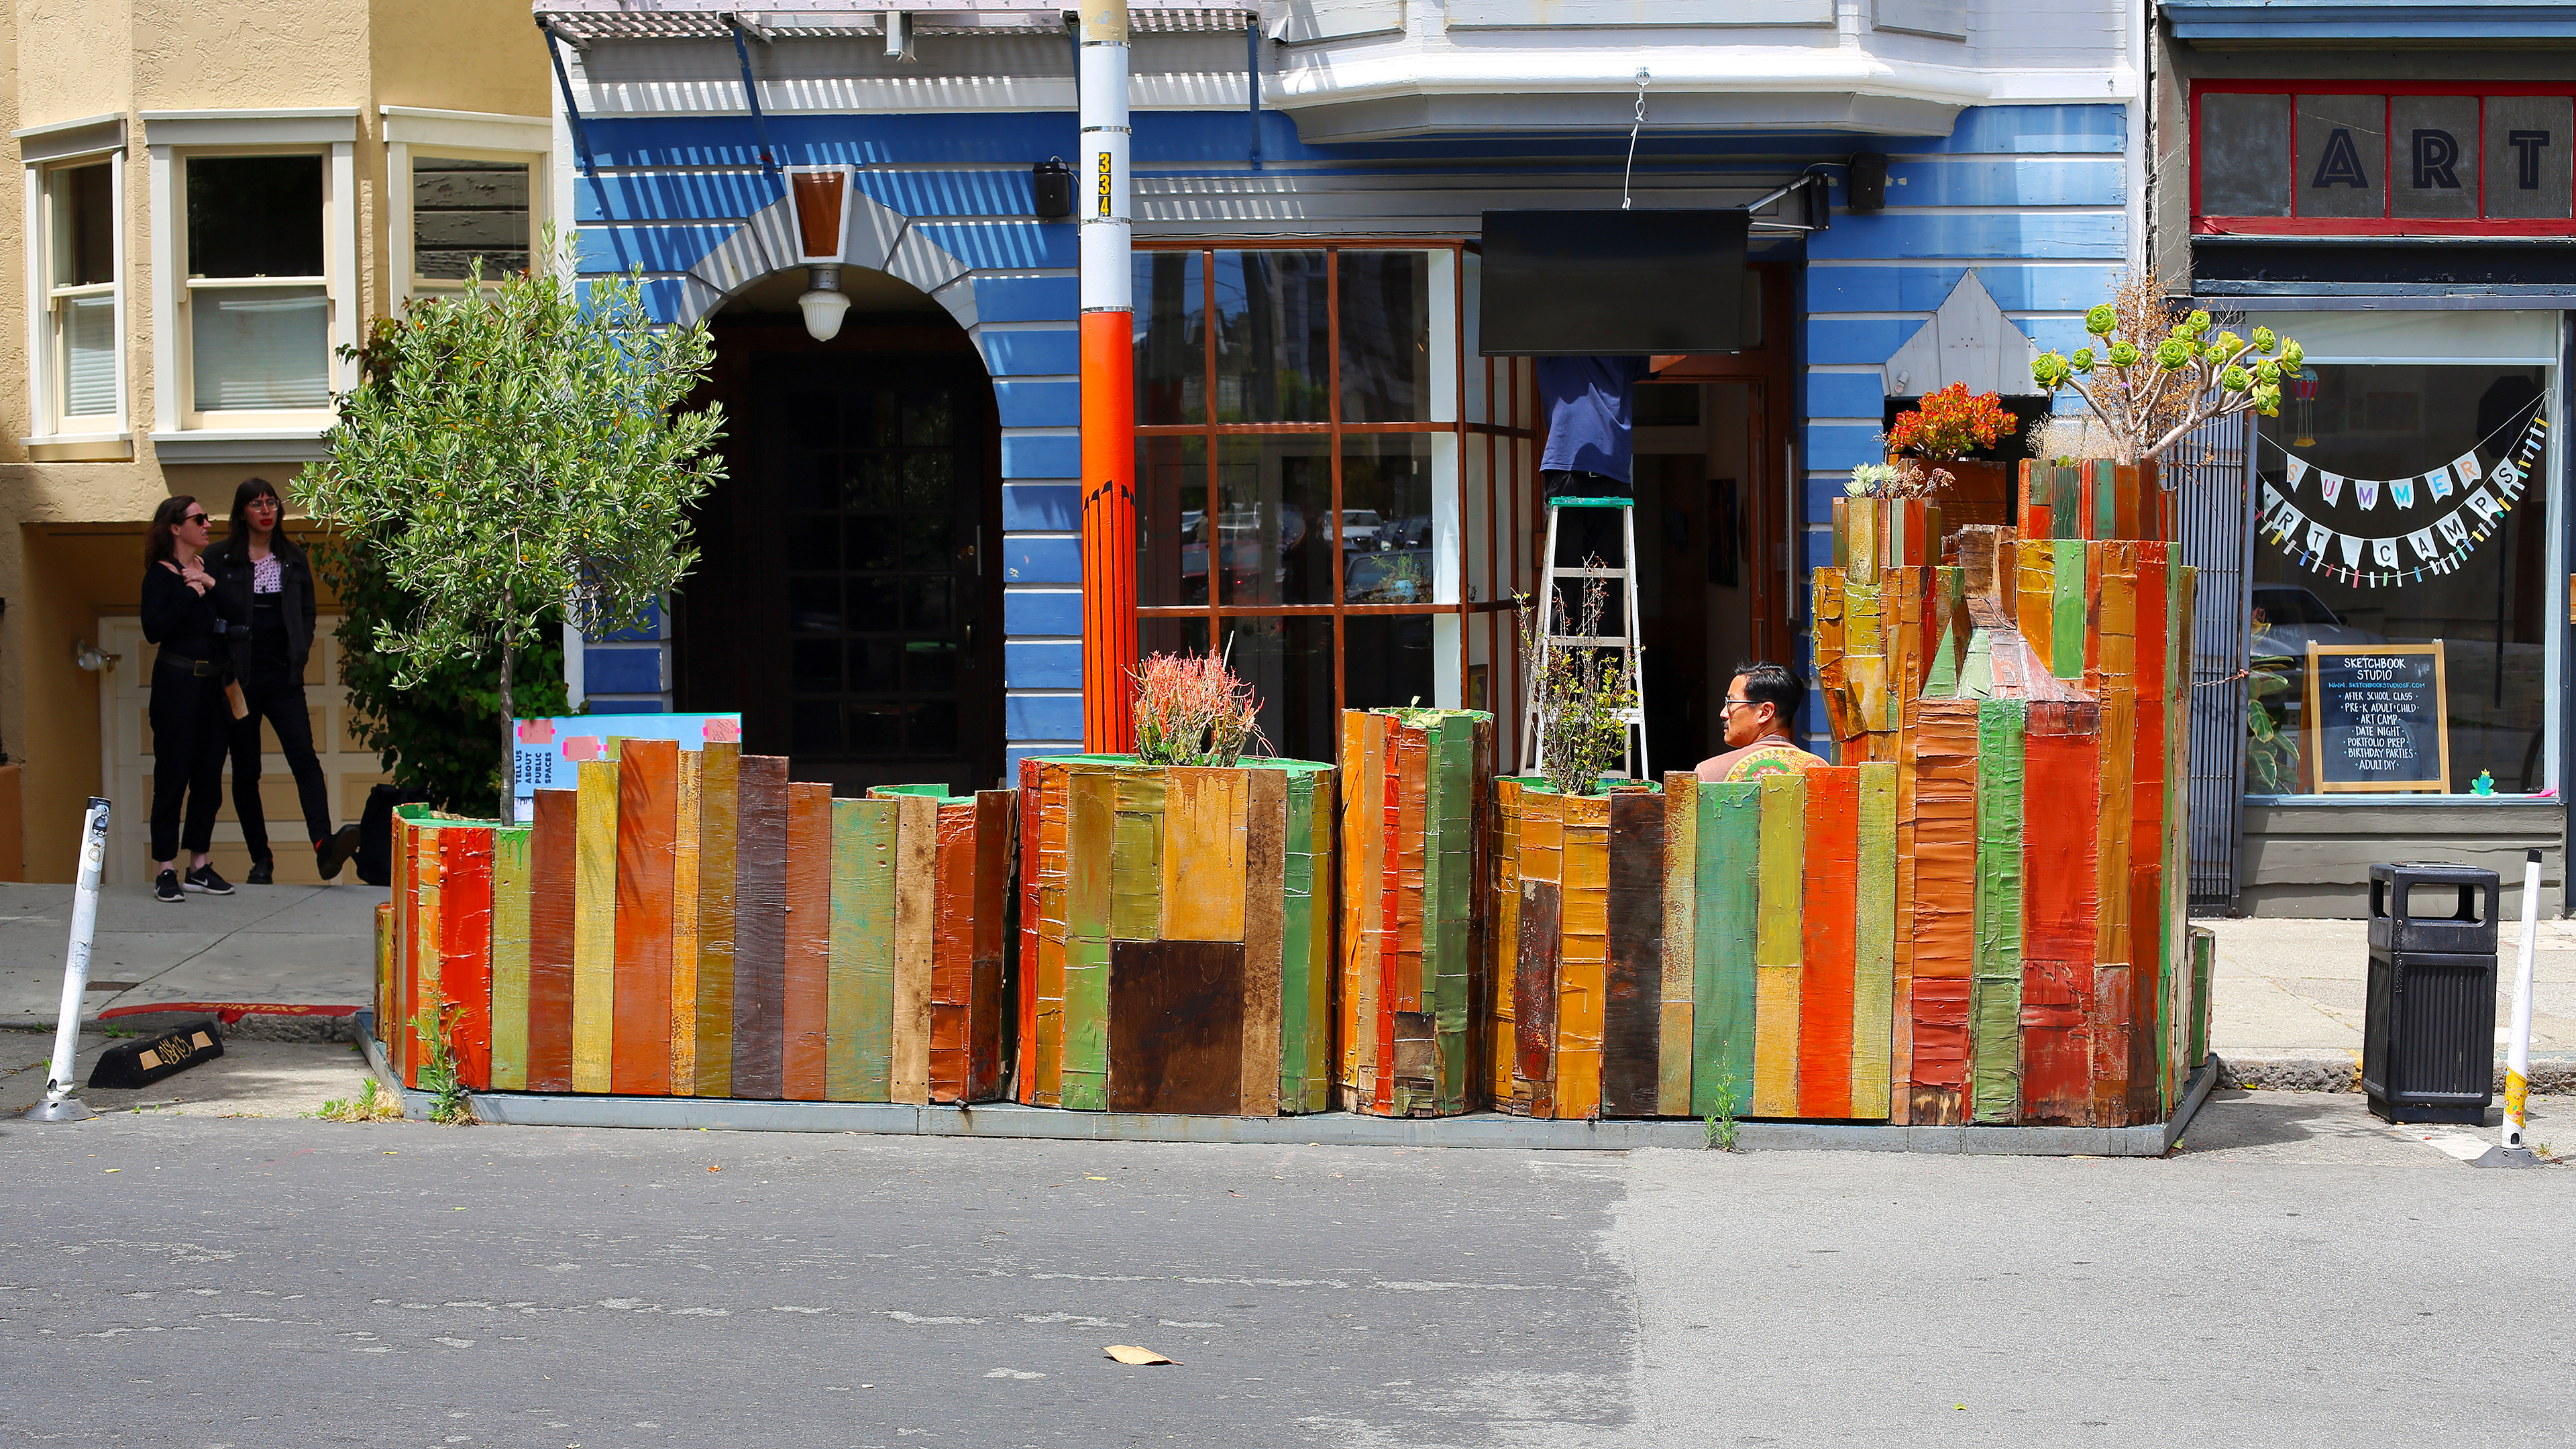
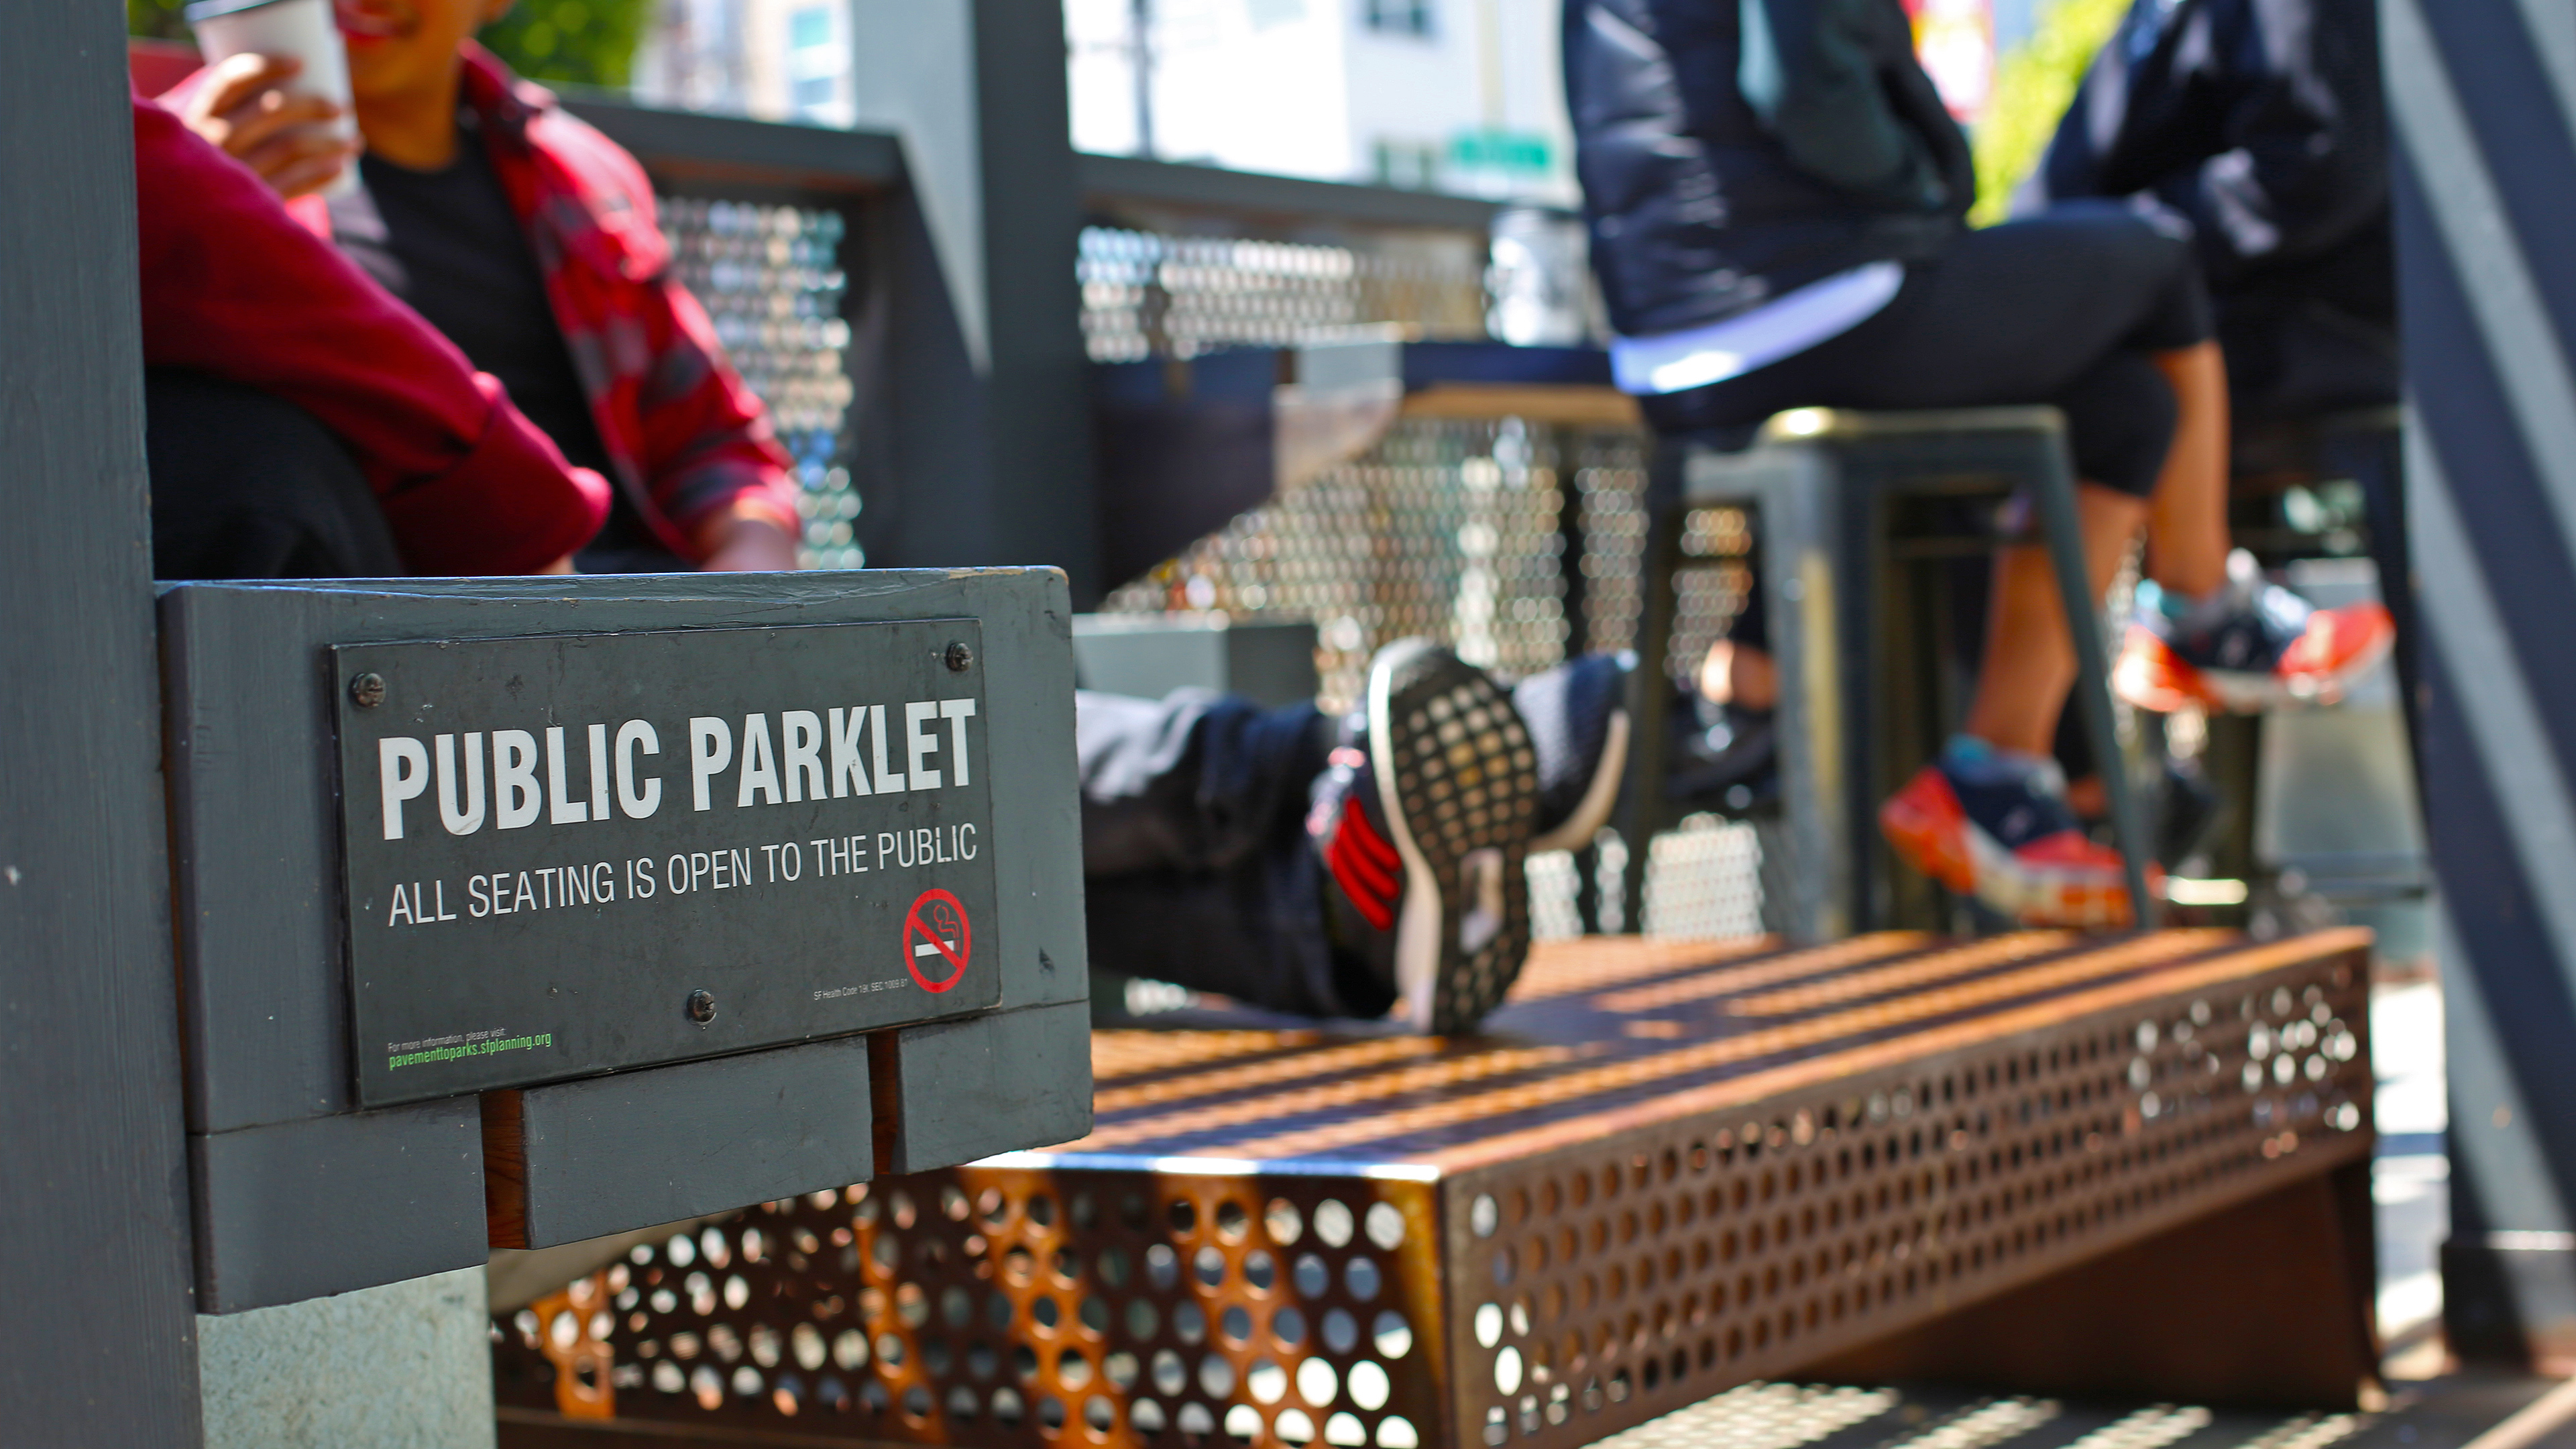
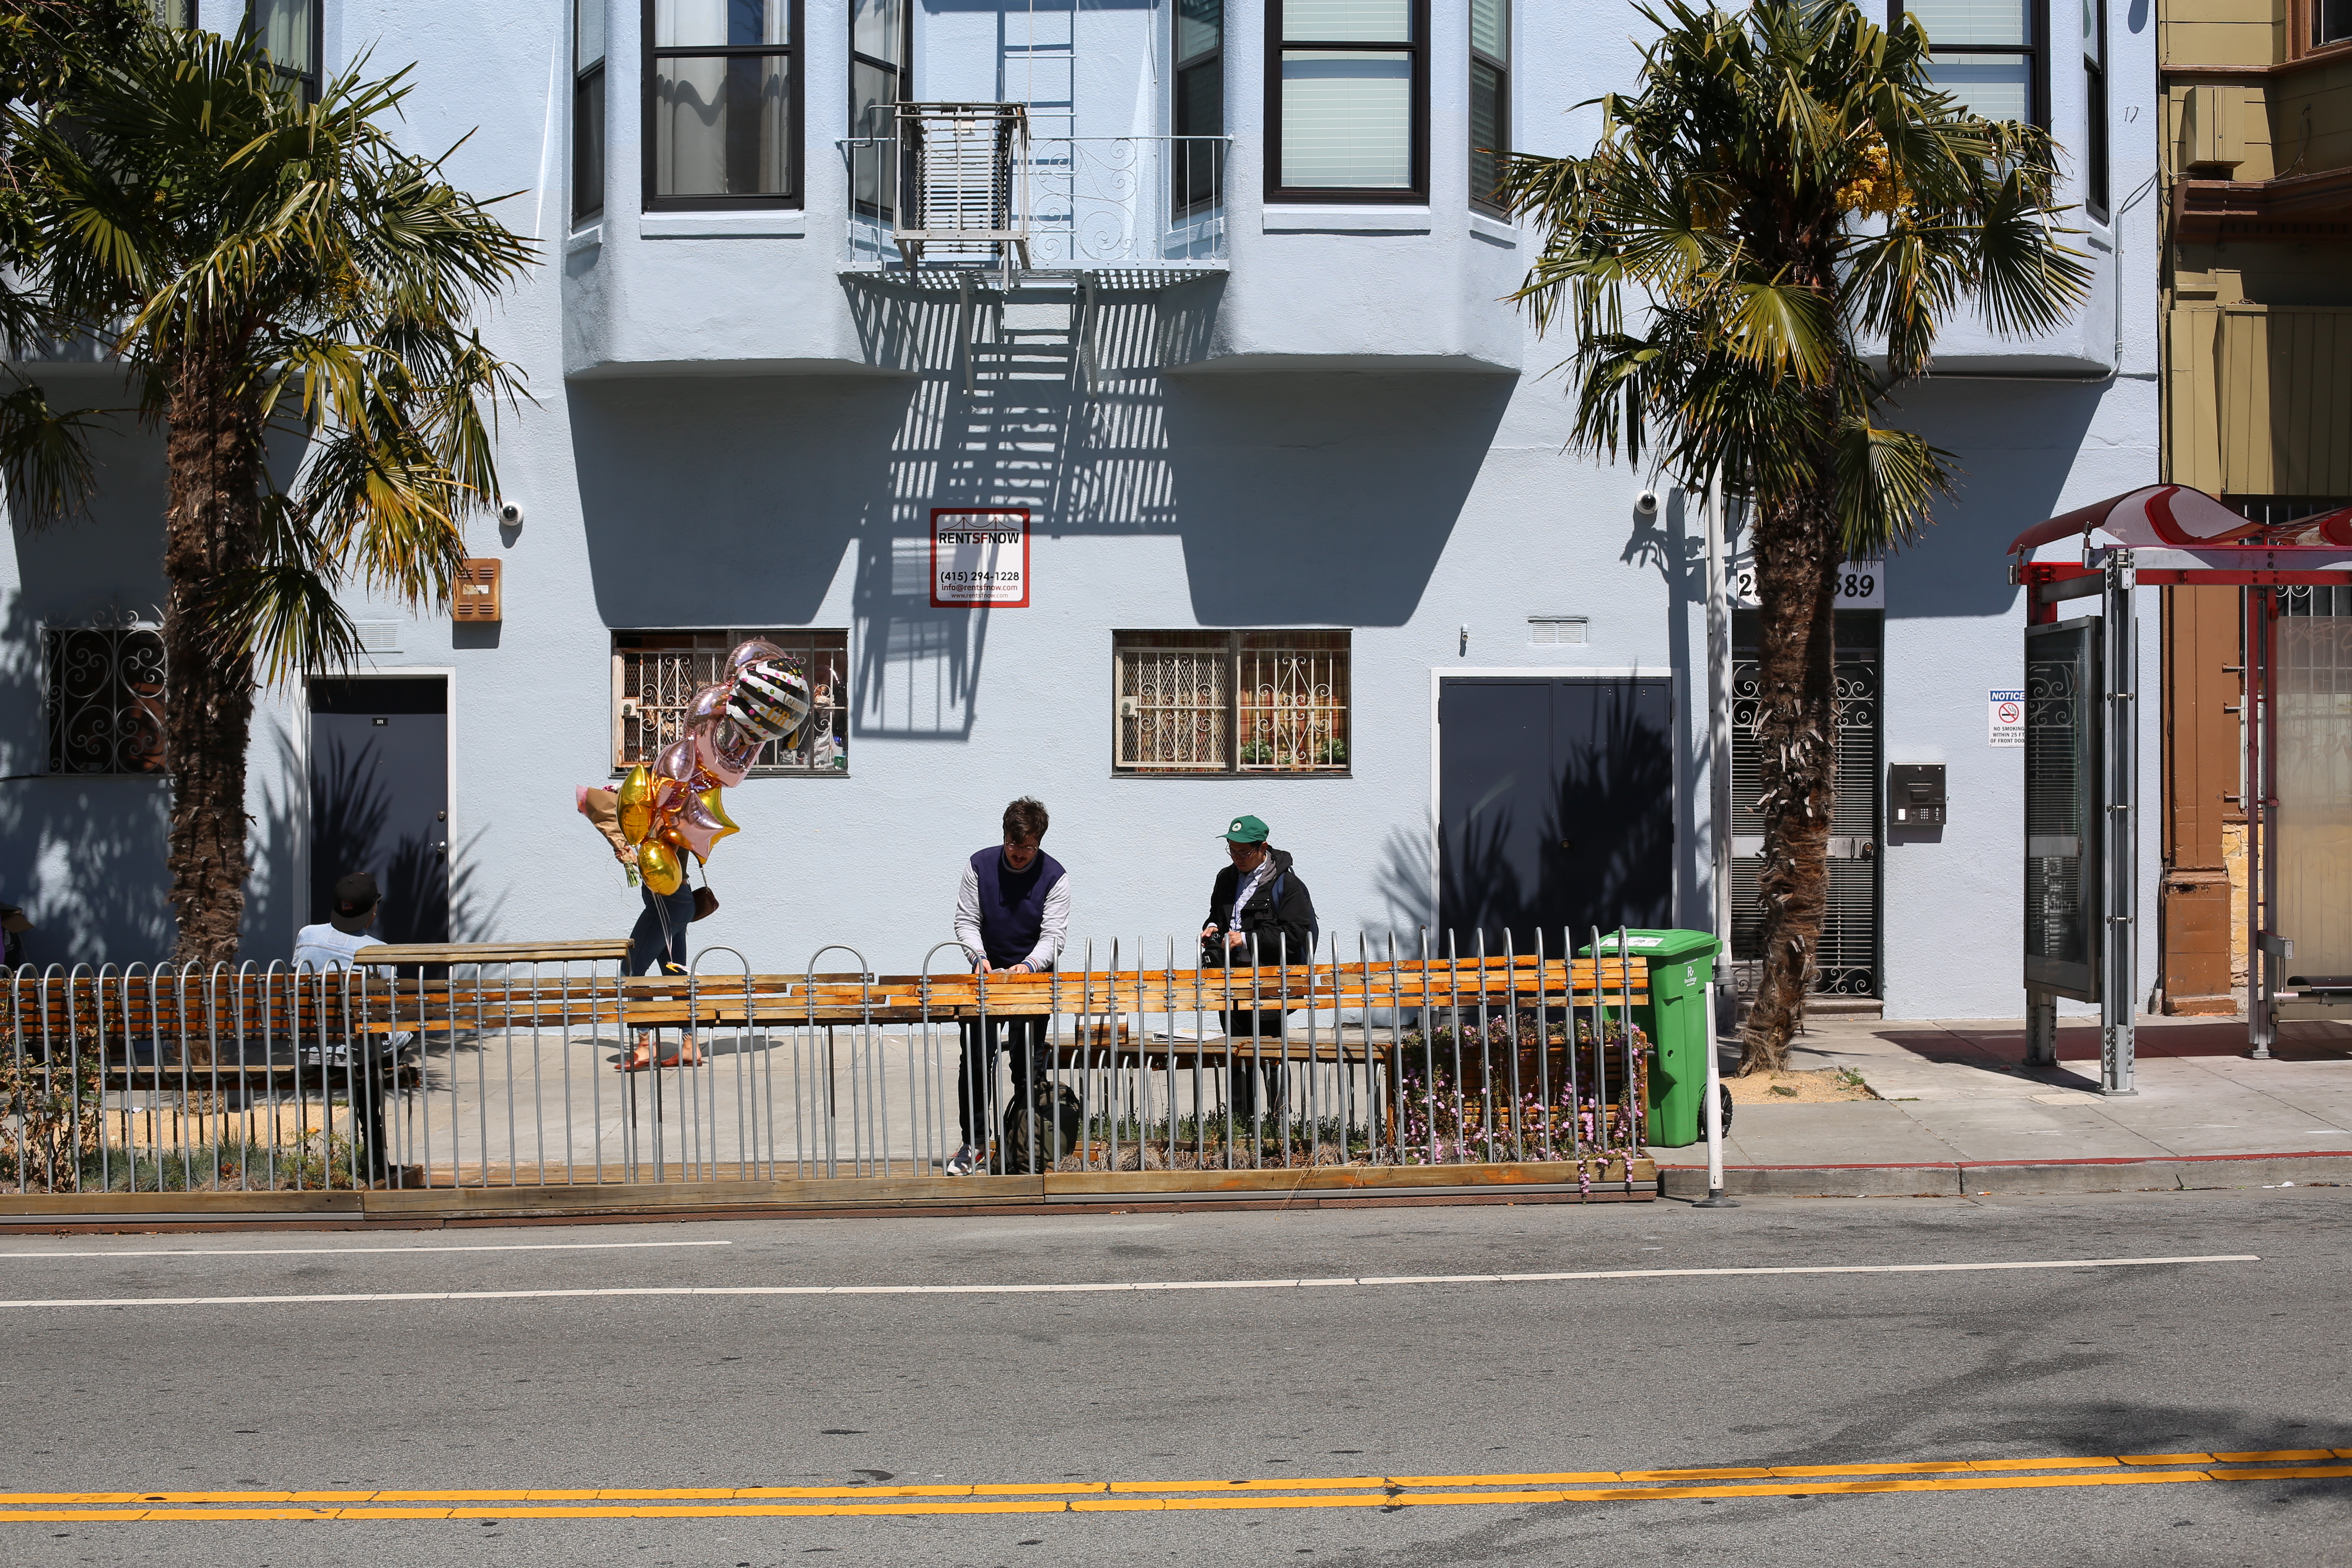
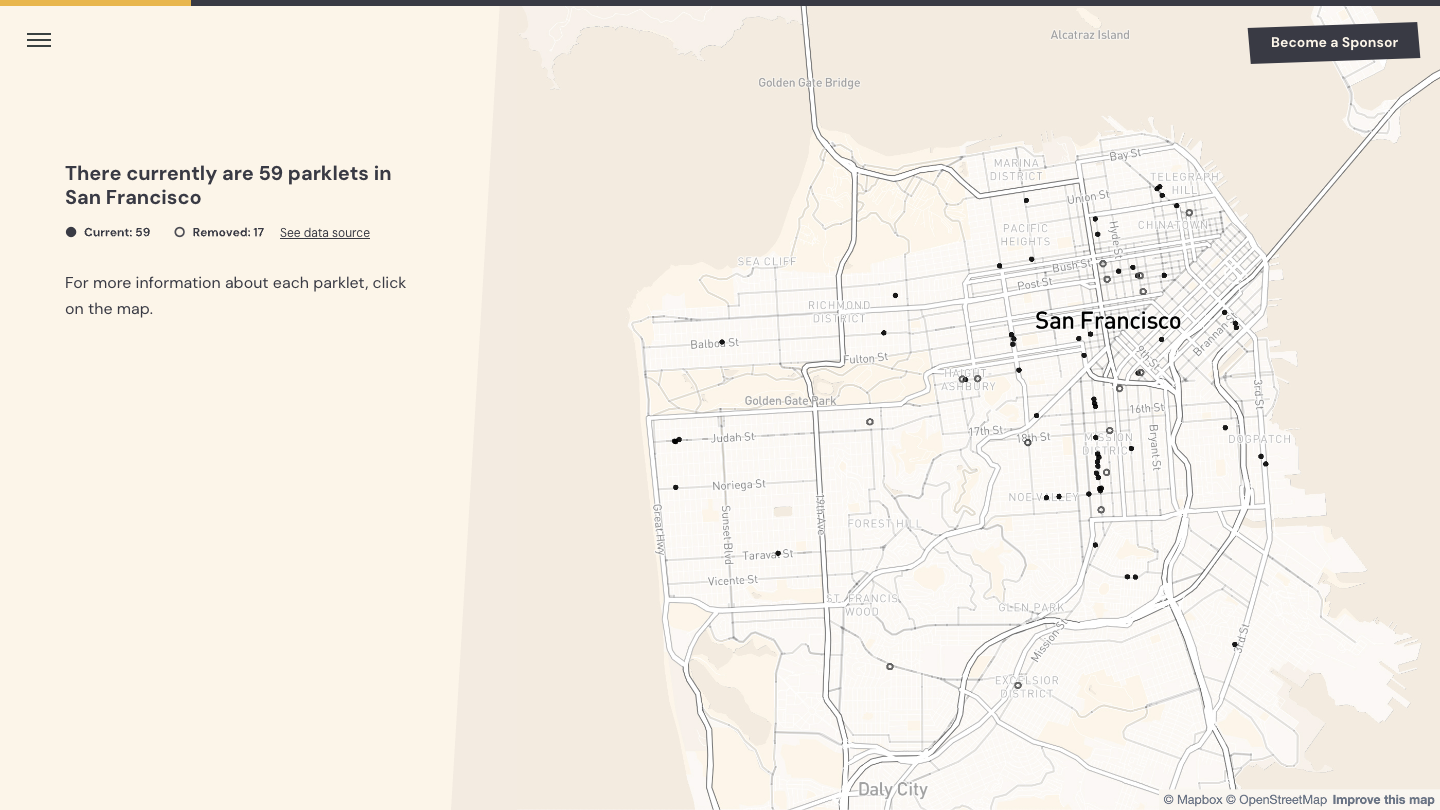
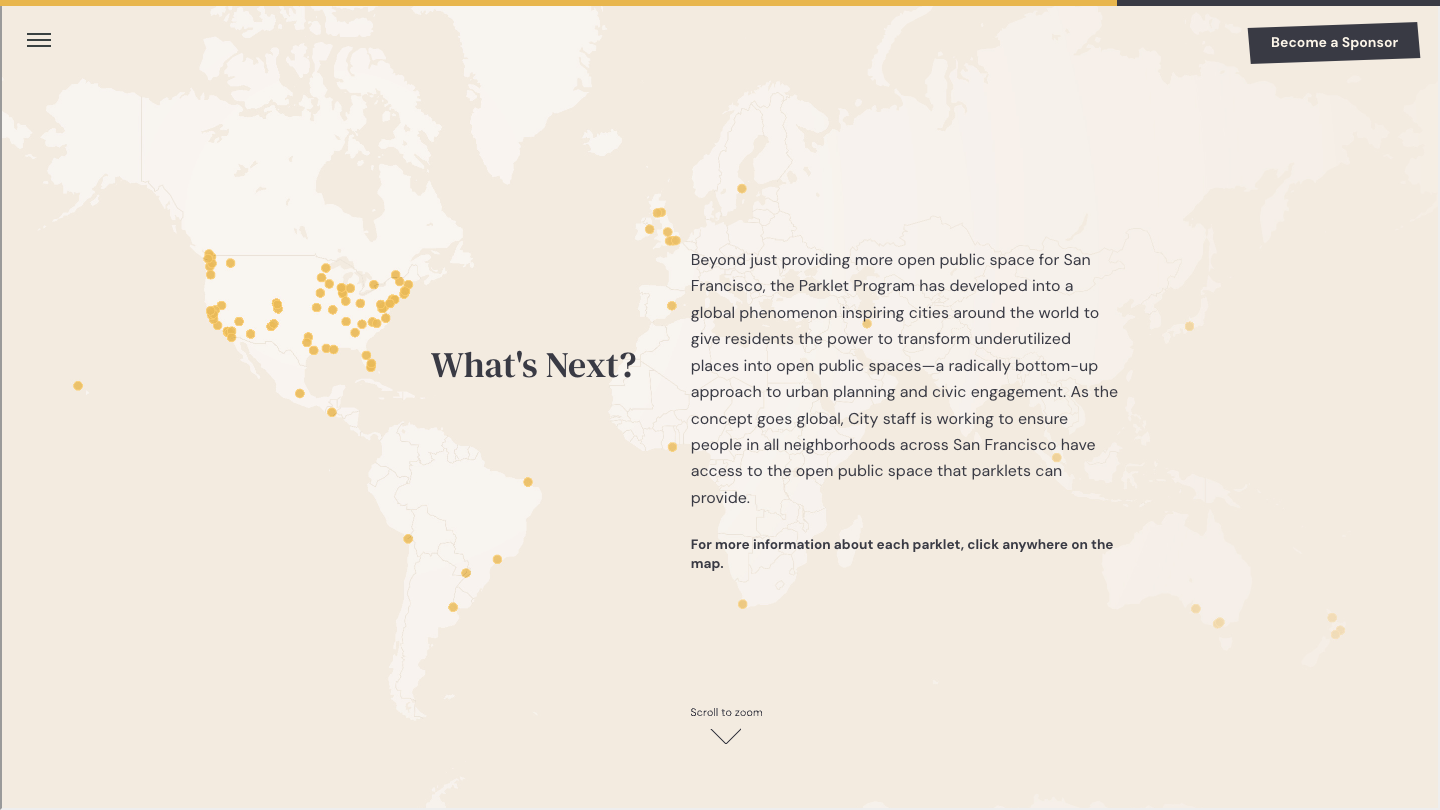
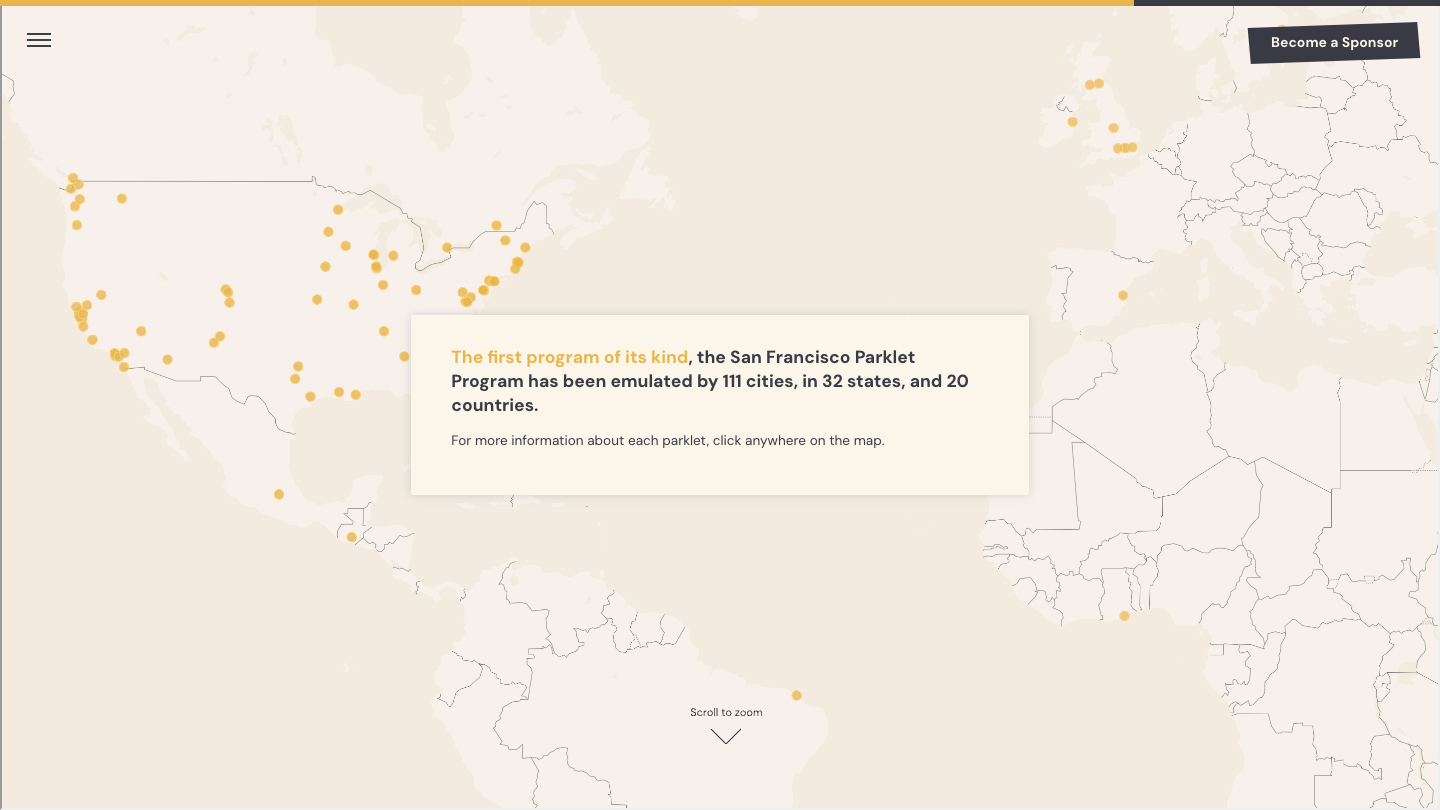
What is a parklet?
“Parklets are curbside parking spaces transformed into public amenities like pedestrian seating, bicycle parking, greenery, and art—each sponsored by a member of the public who funds, designs, builds, and maintains it.”
Parklets in San Francisco


Collaboration
Description
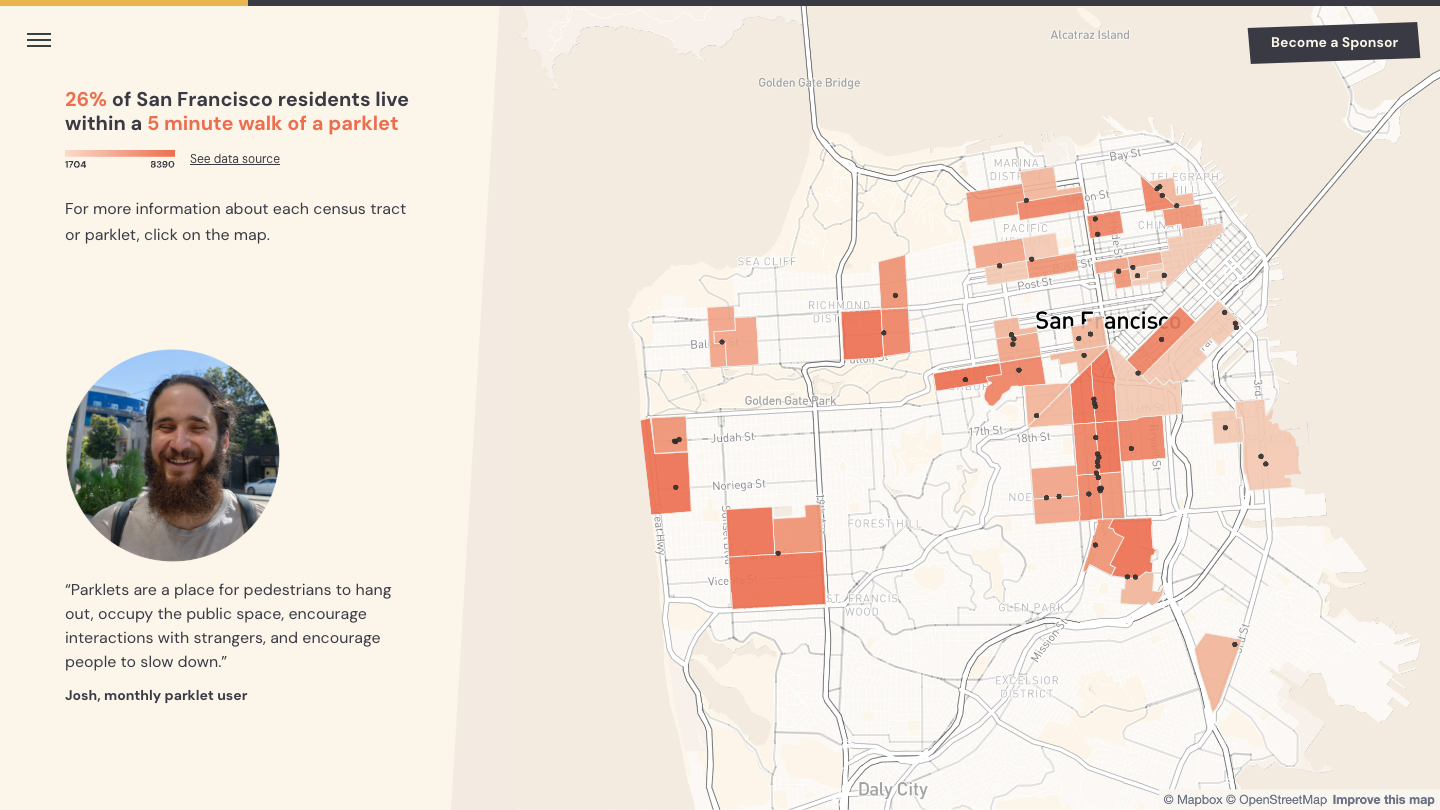
San Francisco has been a national leader in open data, and SF Planning has been an early adopter of data-driven planning, which includes the collection of Public Life Data, through Public Life Studies.
To transform this data into an accessible, public good, SF Planning partnered with Stae, a civic data platform that integrates a city’s various data sources and makes this data easy to visualize, analyze, and share.
After transforming the City’s public life data into a digital format ready for analysis, Stae worked with the human-centered design research firm, Openbox, to build interactive “data stories” that use both quantitative and qualitative insights.
Partners
Data 🤝 Design
“City governments collect a lot of data, but we don’t always have effective tools for sharing human impact stories with our data. We could analyze data and create policy, but only those with a technical background could understand what this data is and what it means. Now, SF Planning has a great way of visualizing the data stories about our public spaces with a broader audience.”
Qual 🤝 Quant


Research
Description
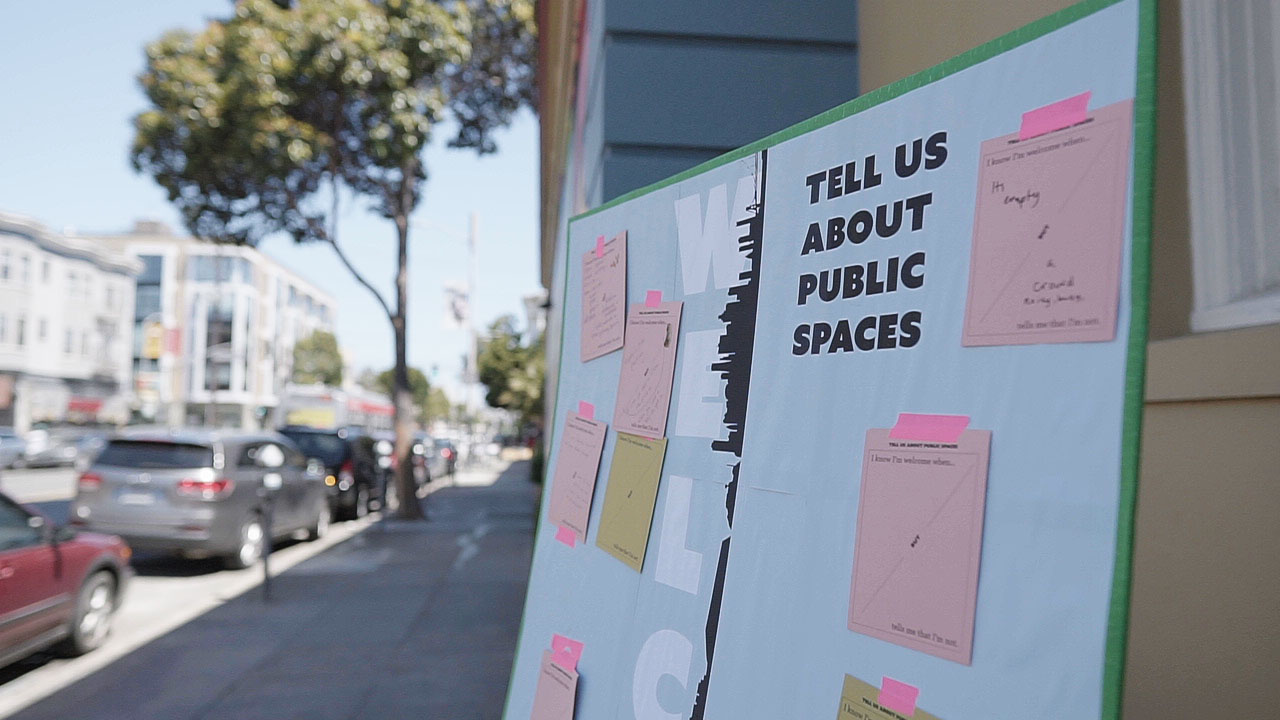
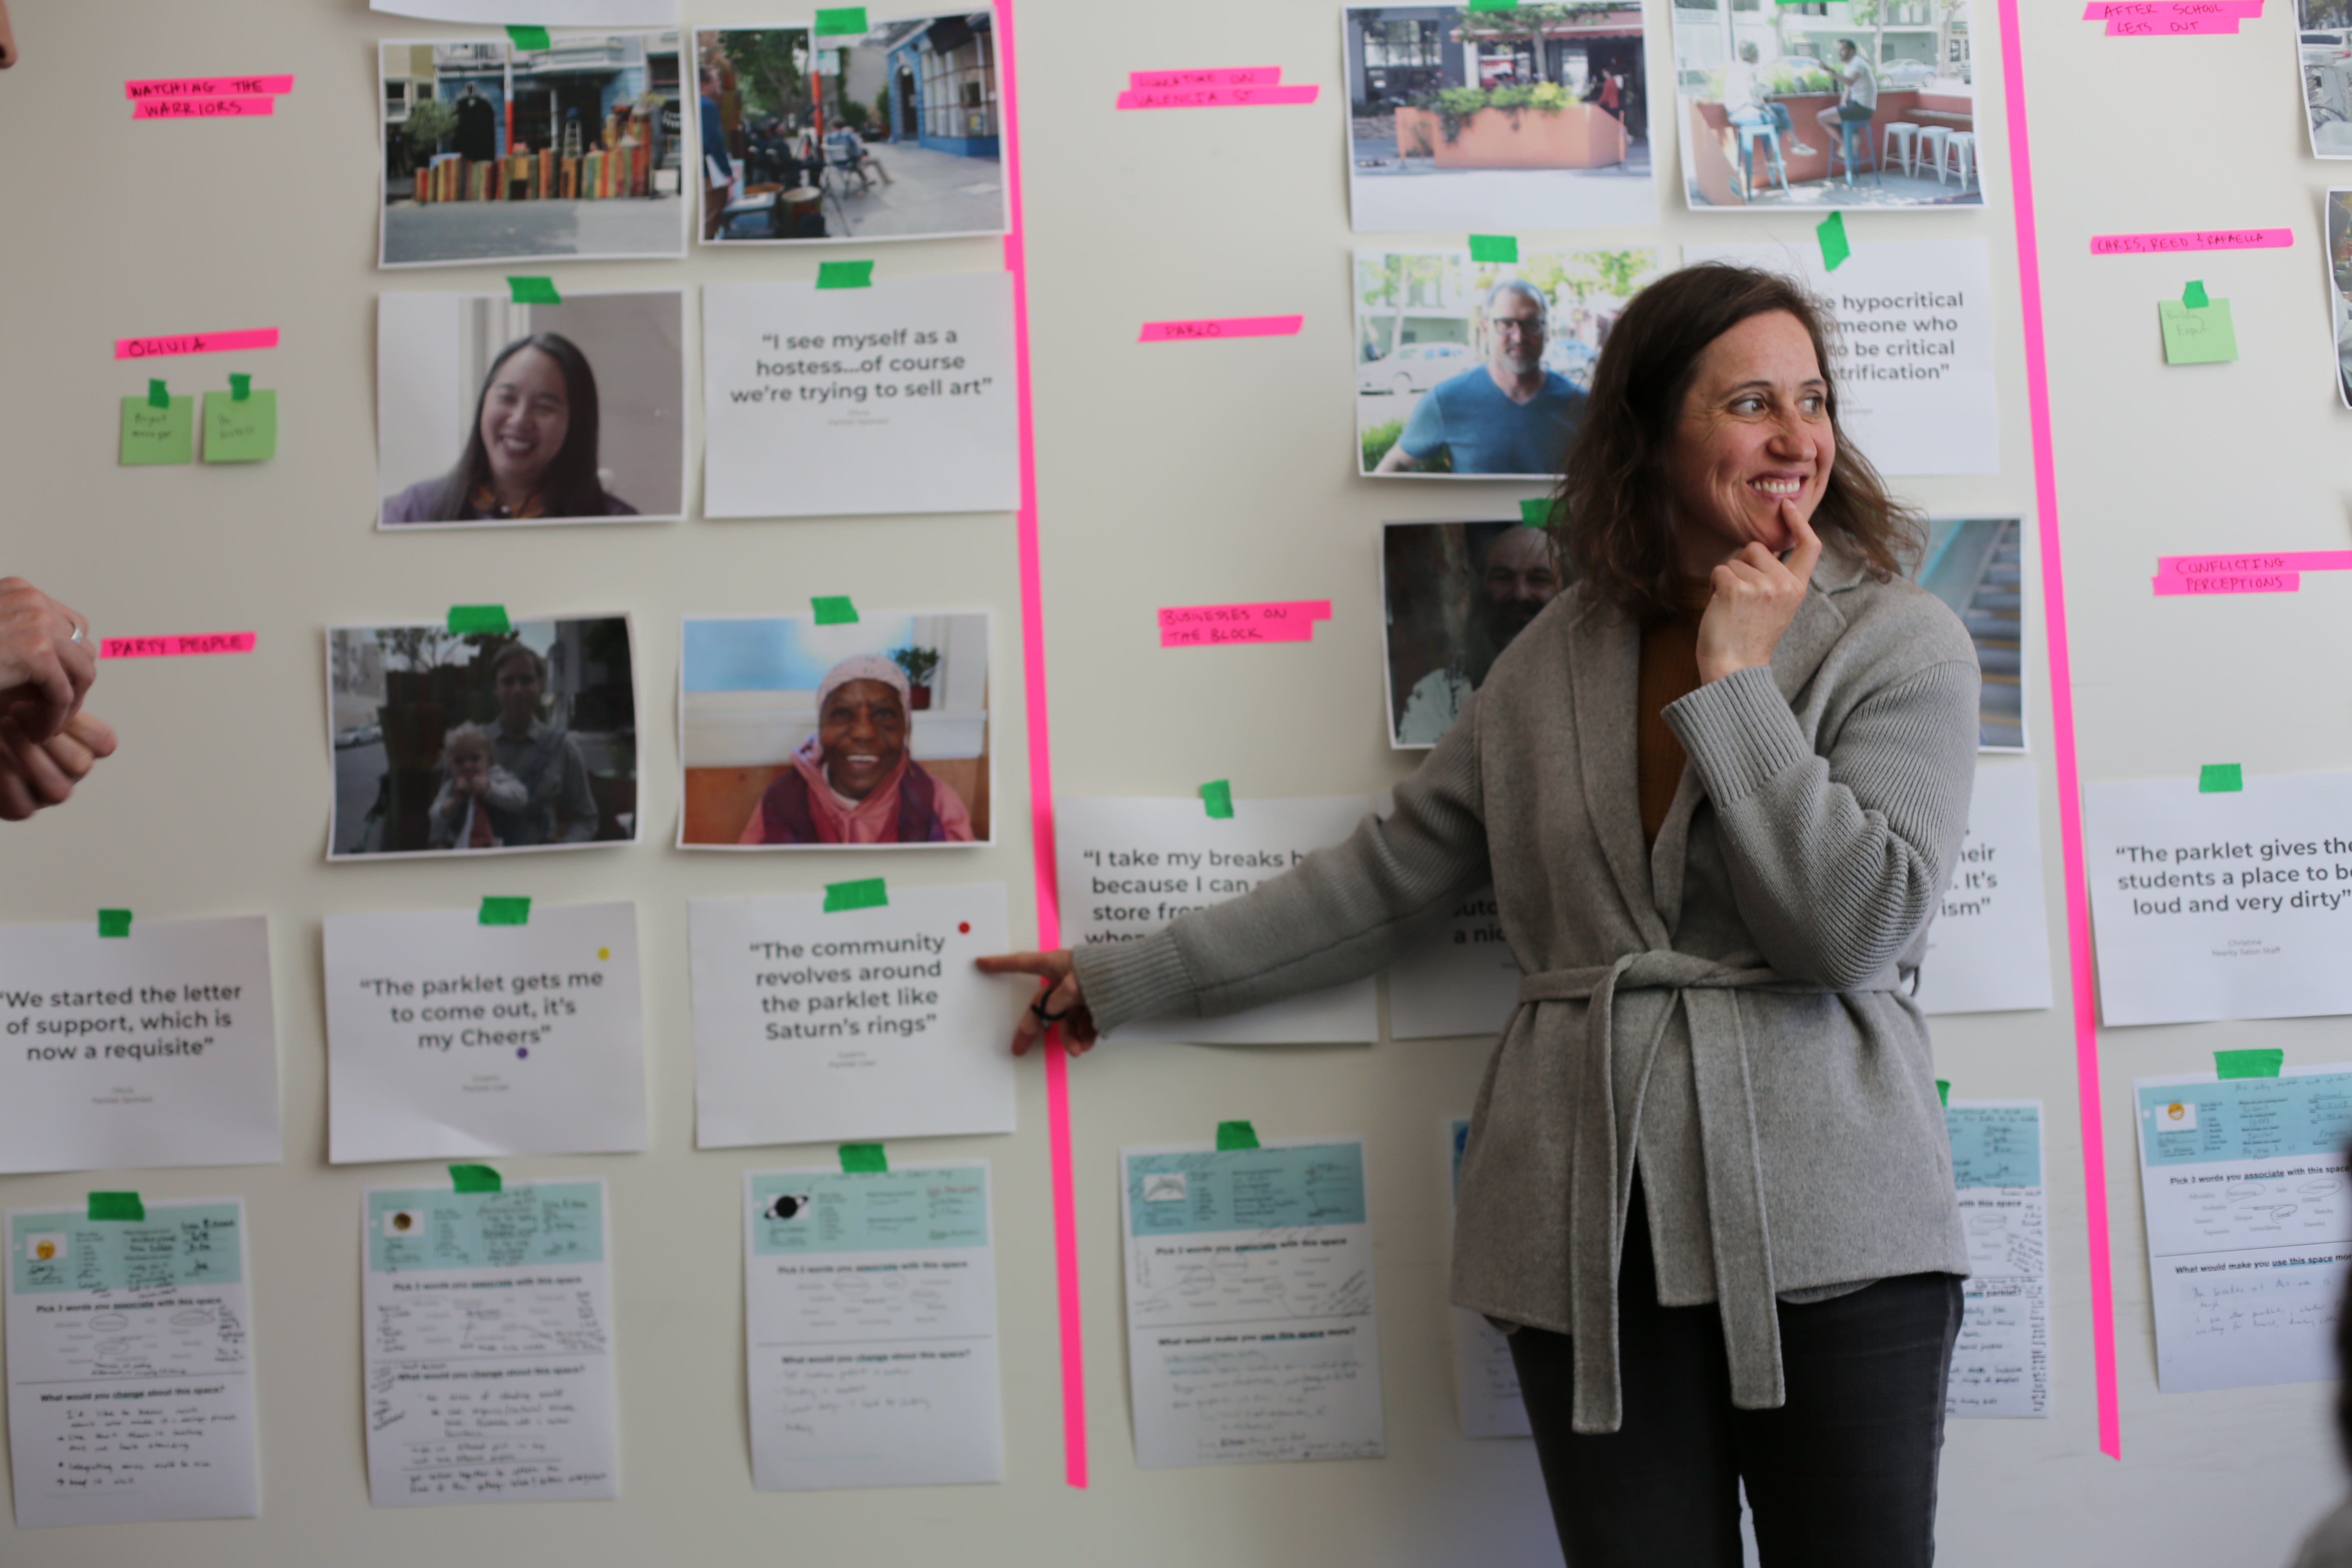
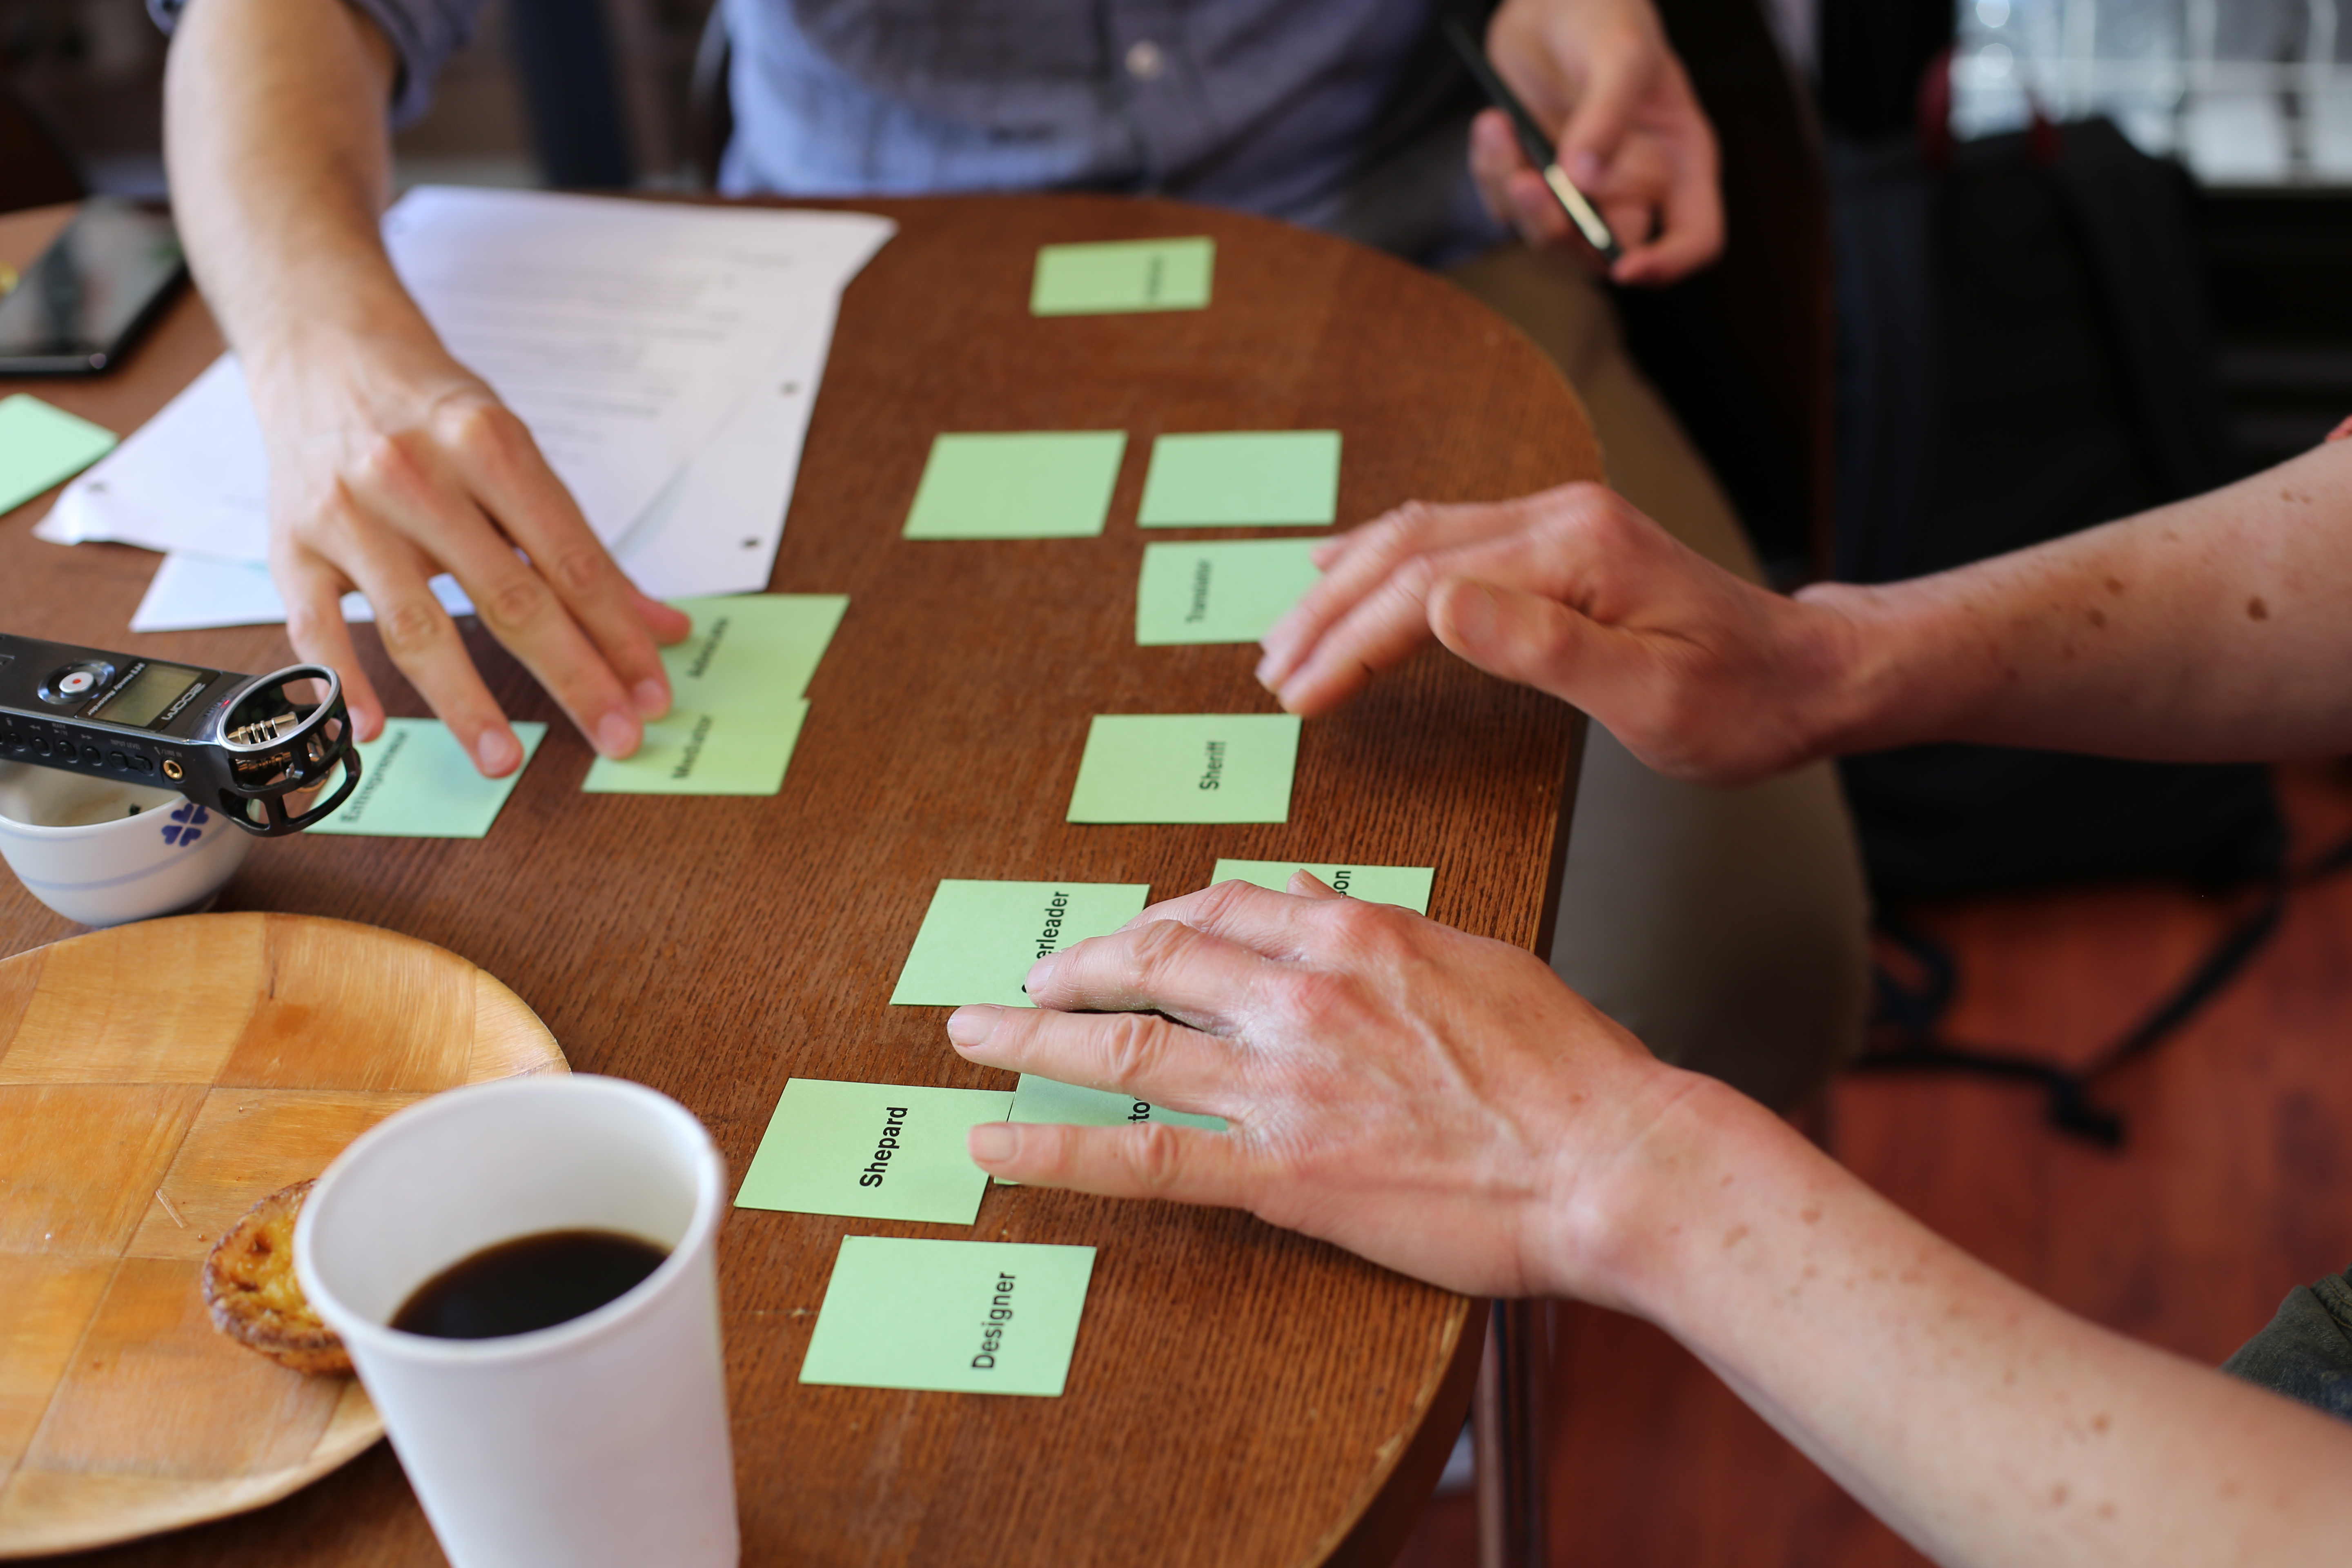
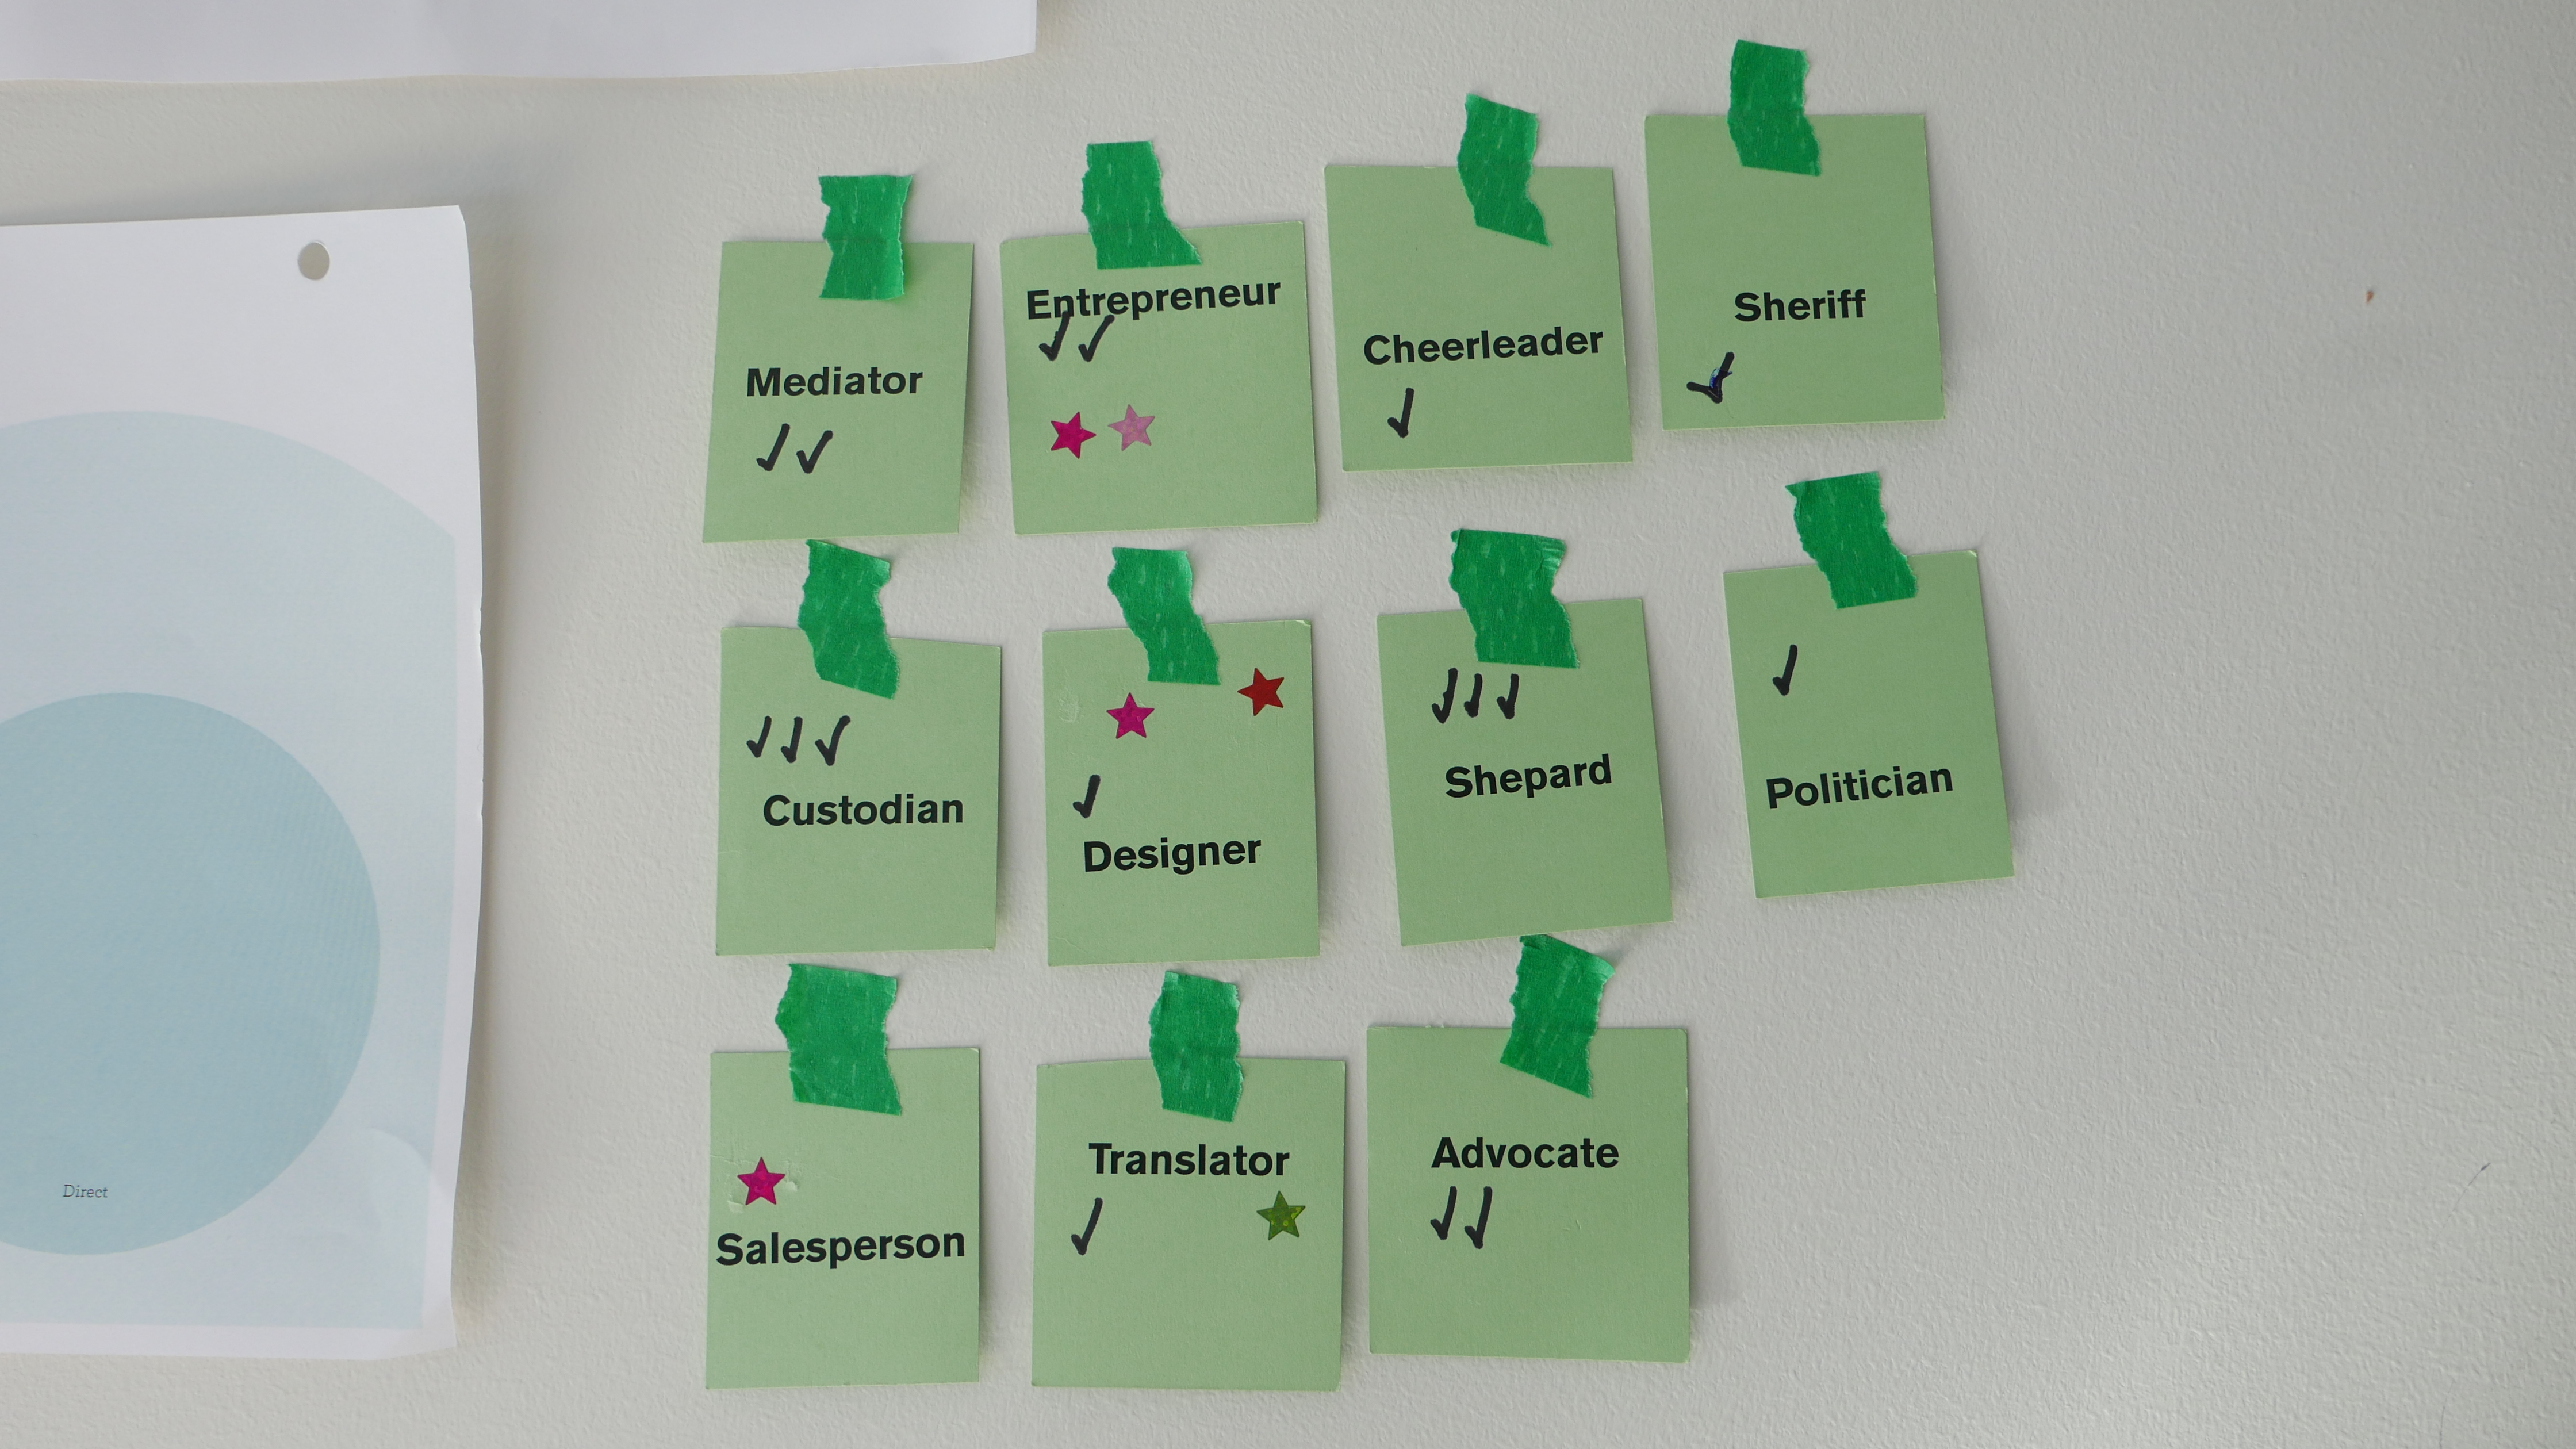
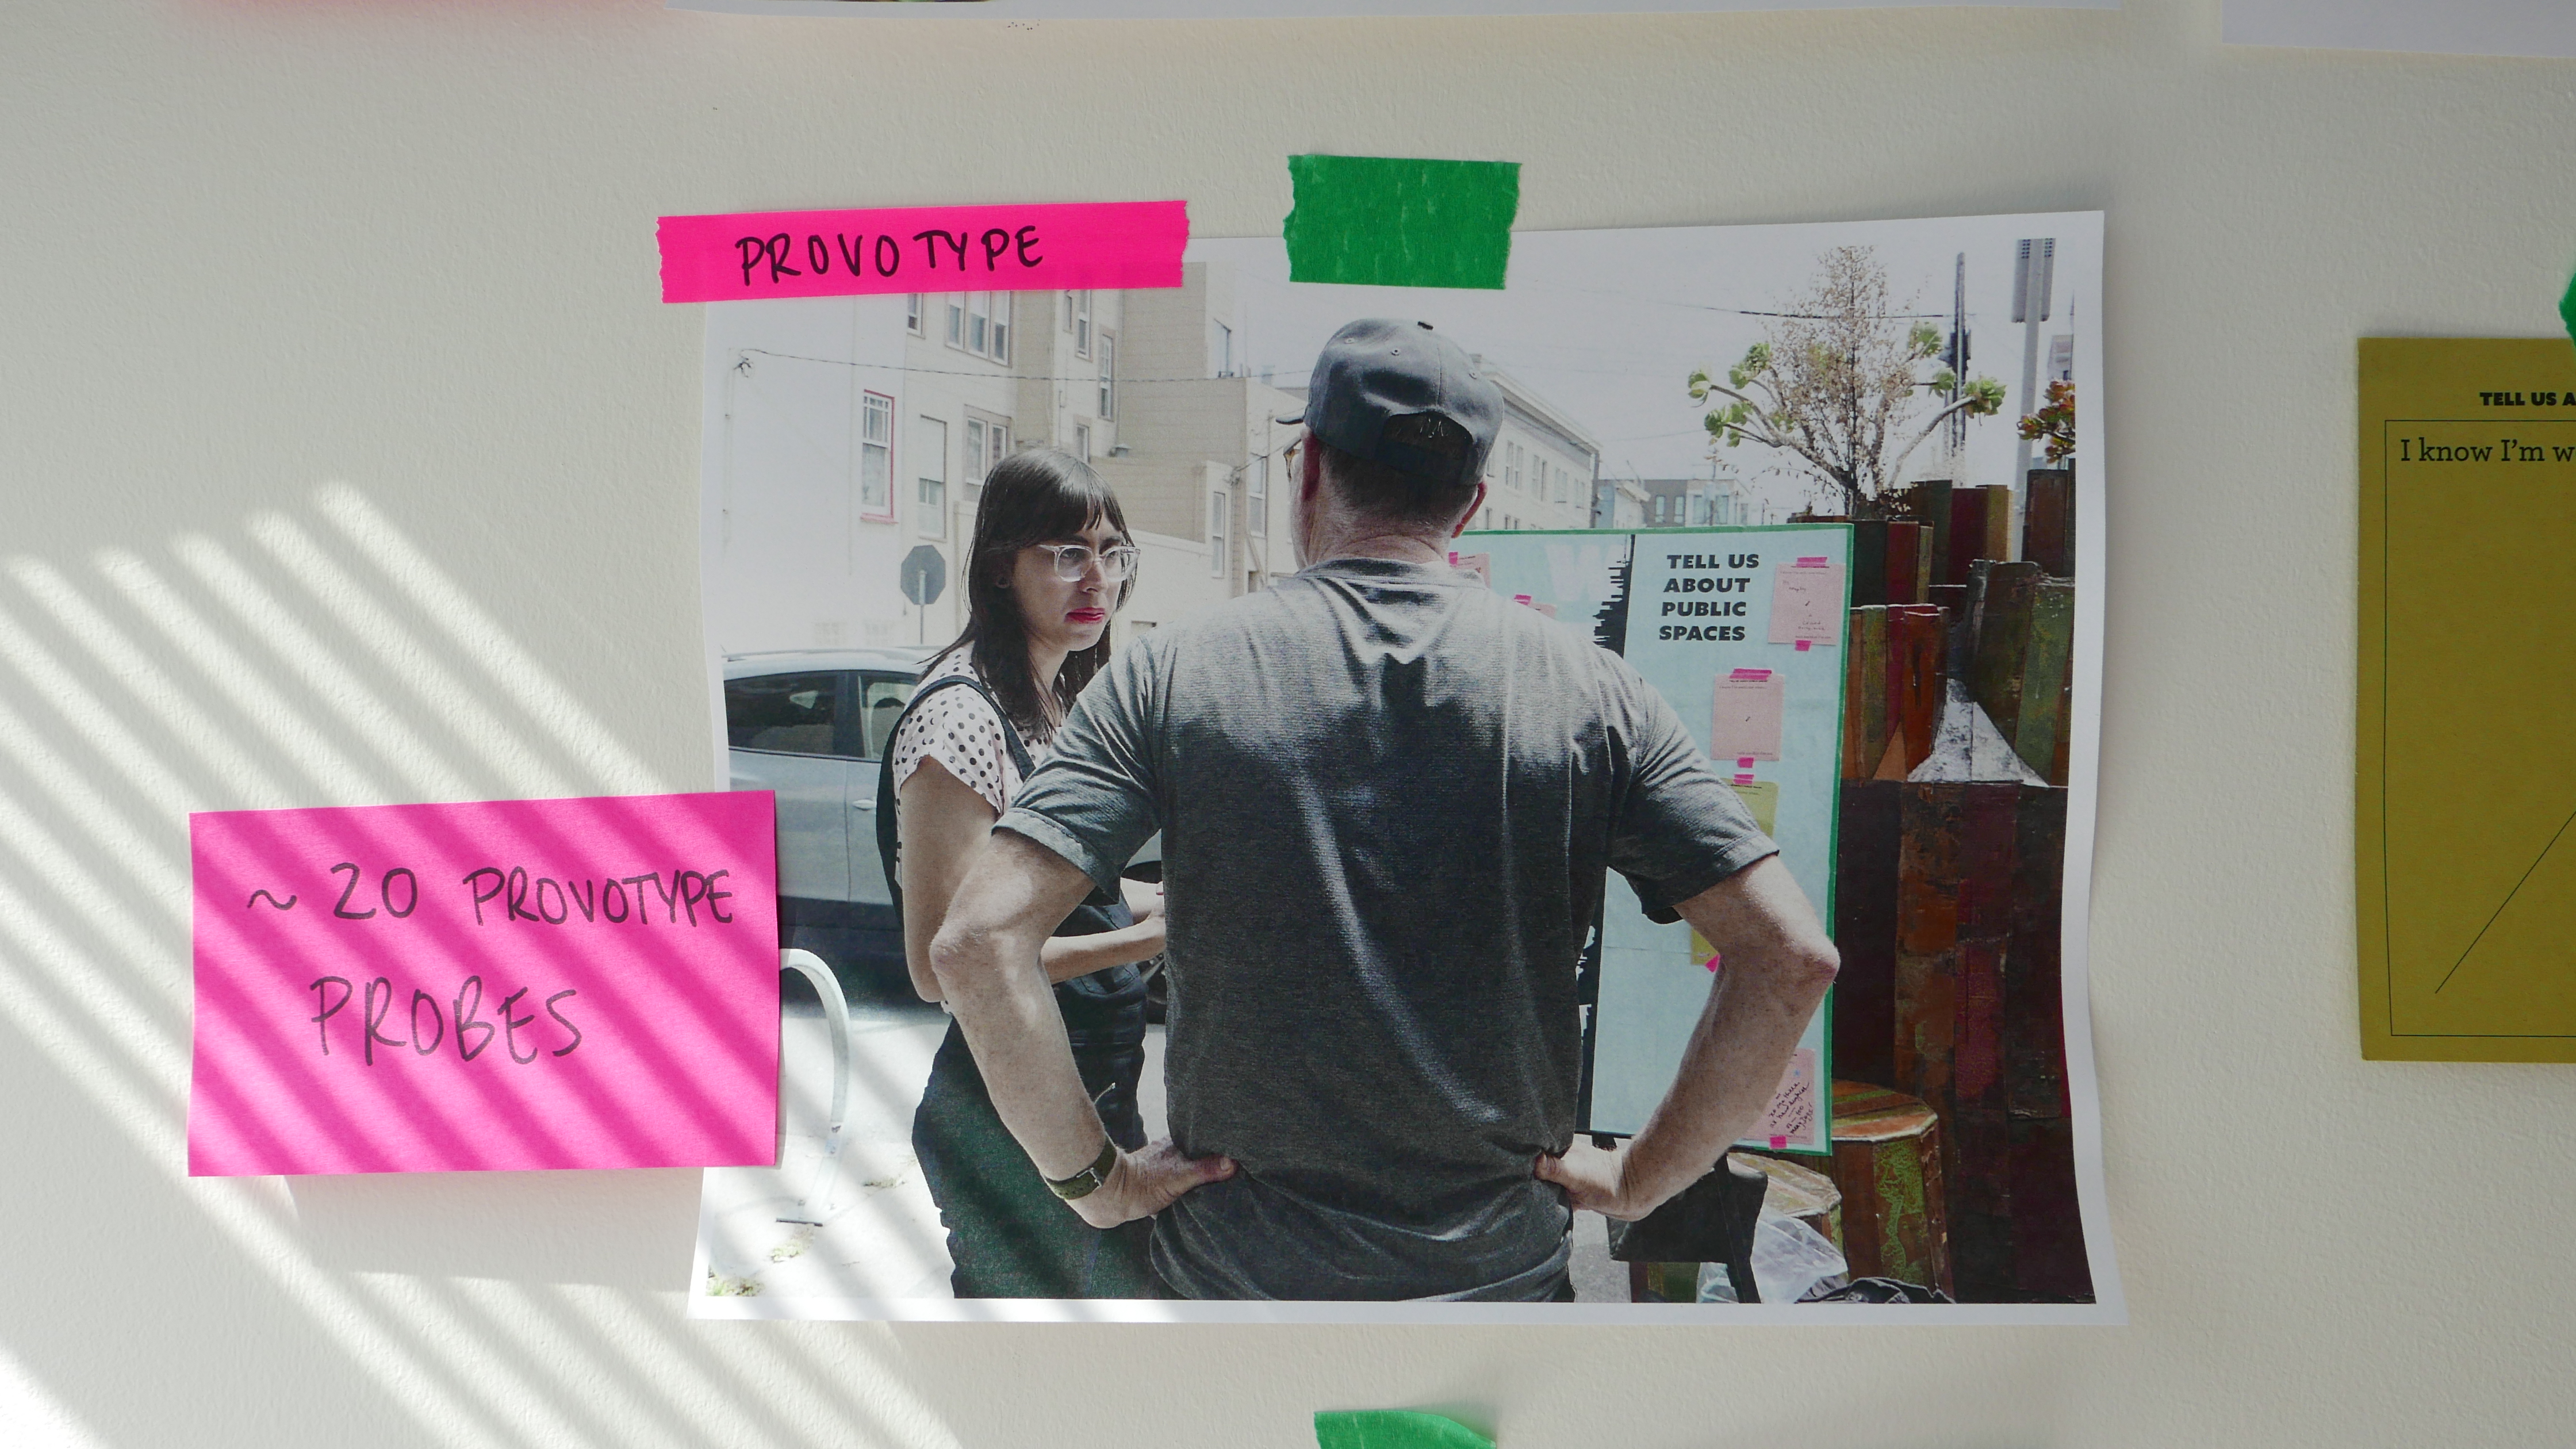
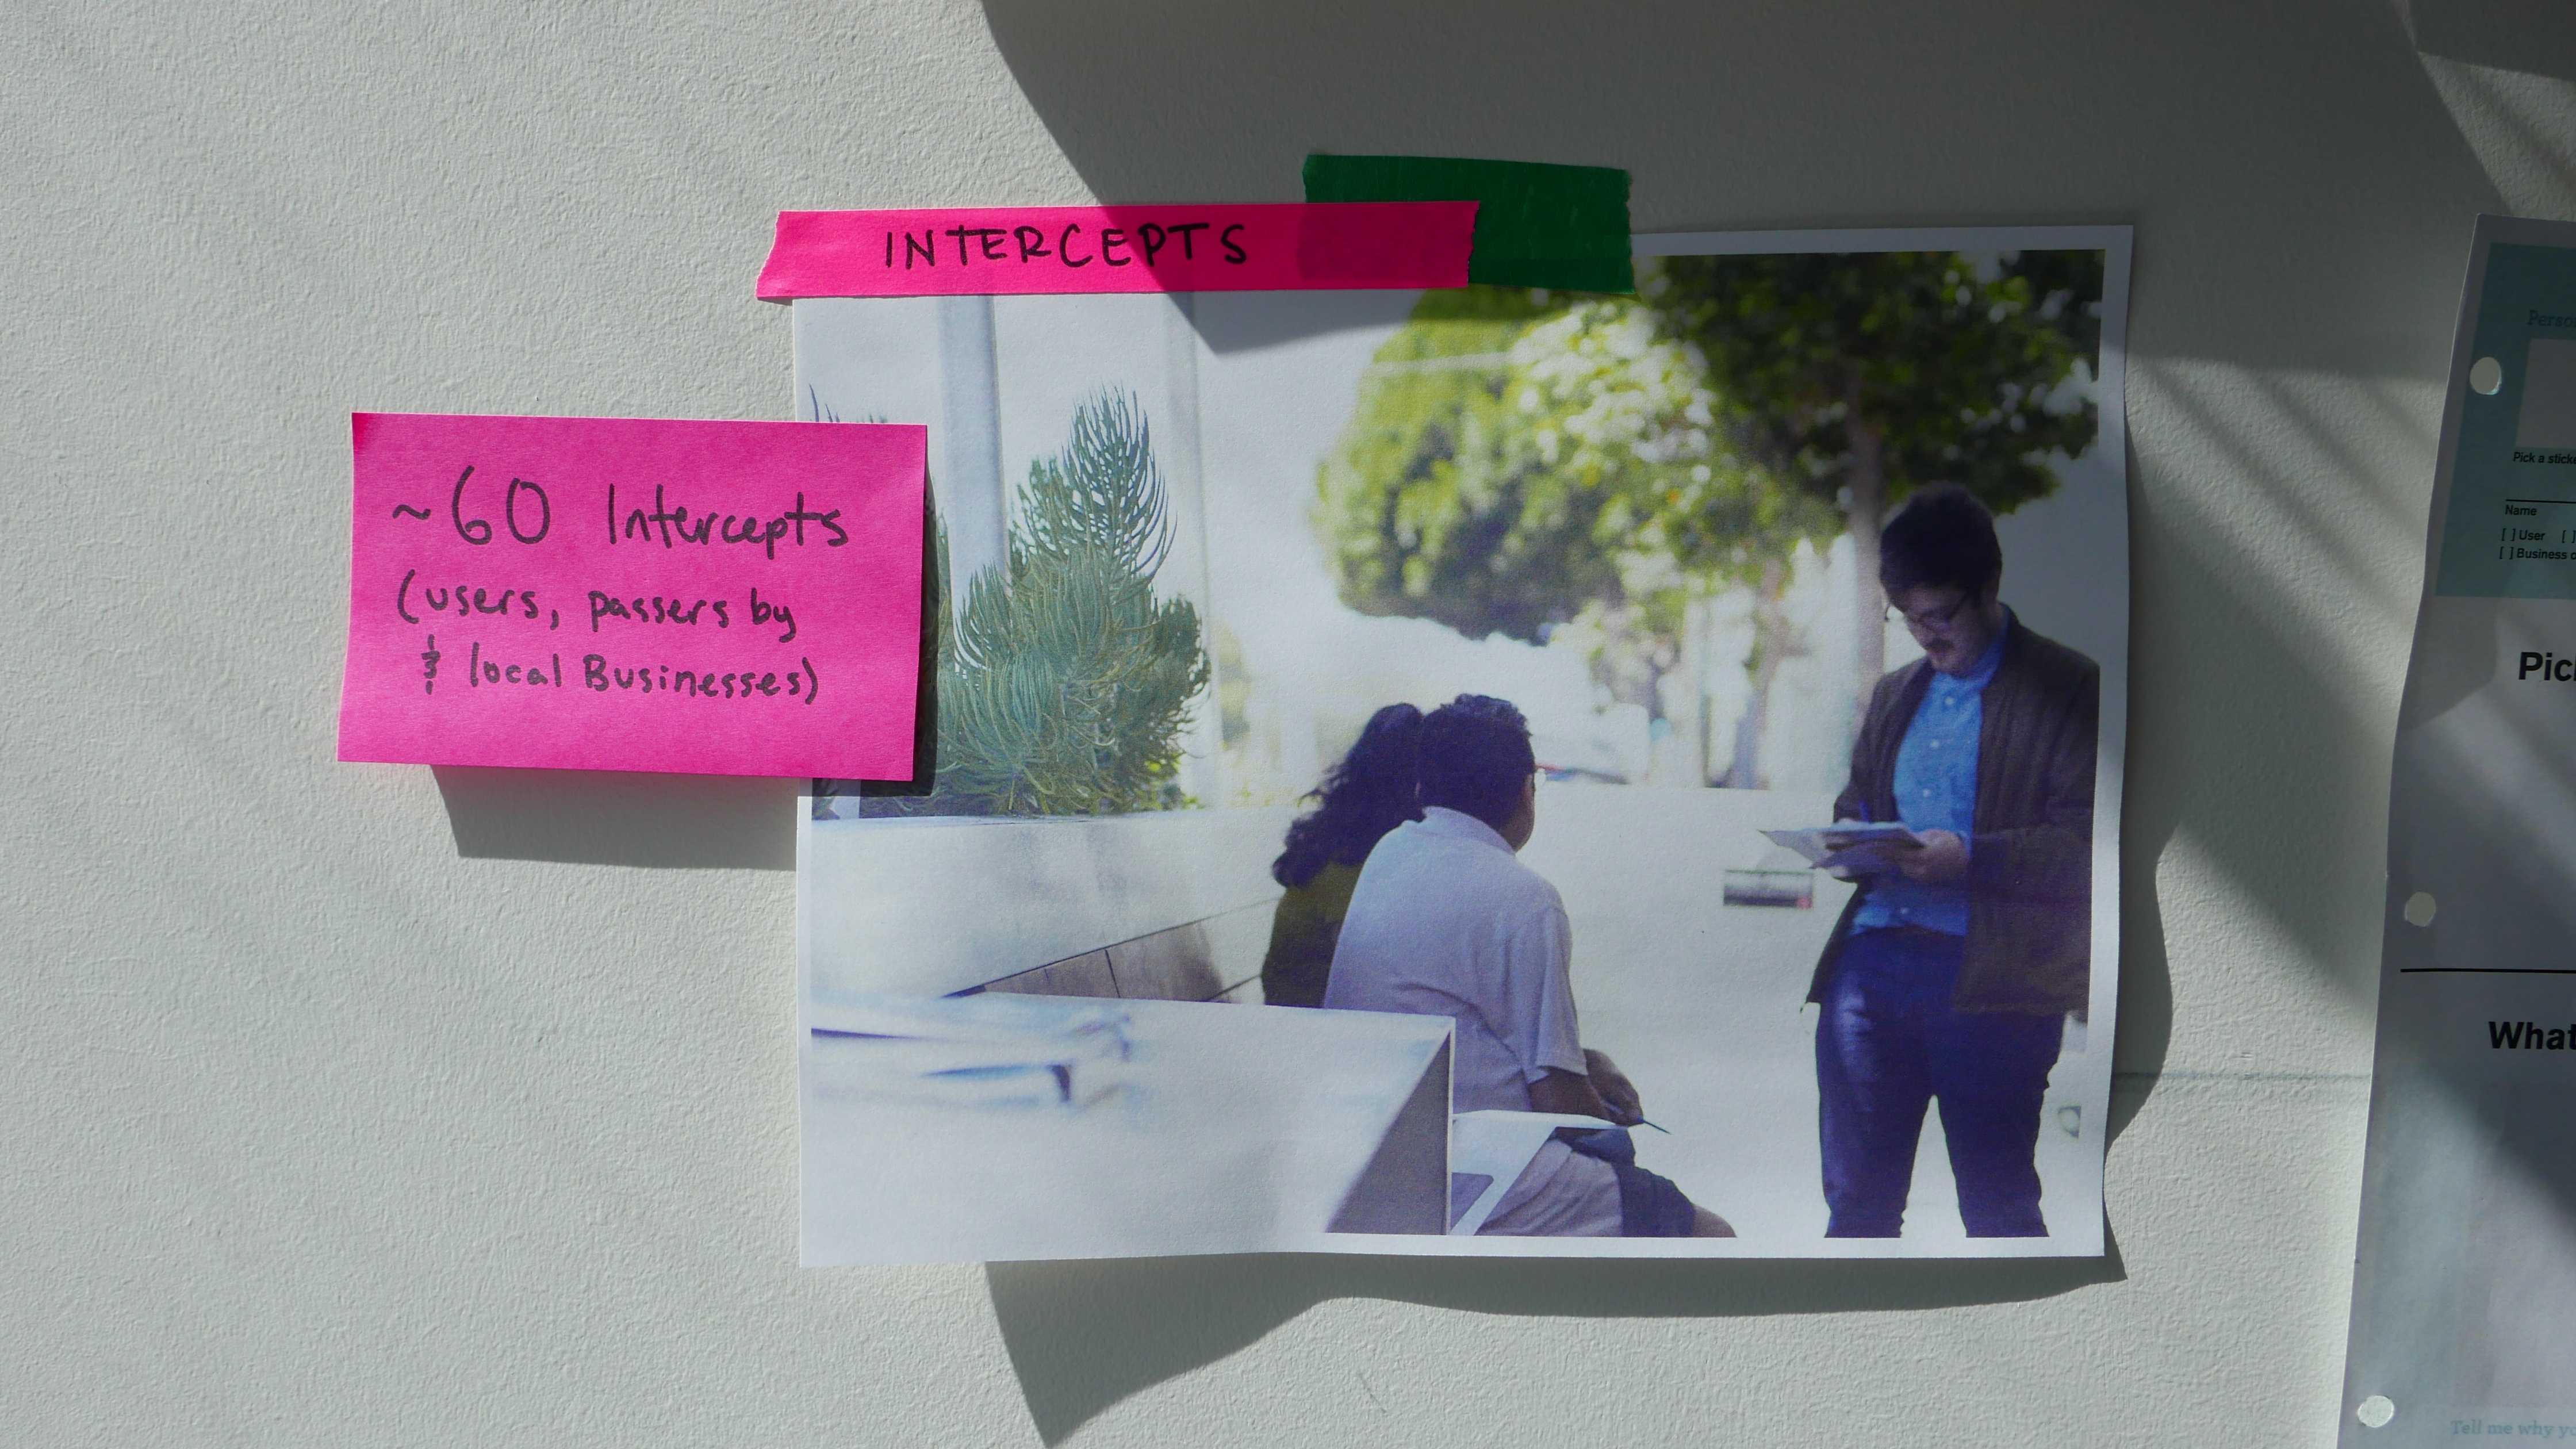
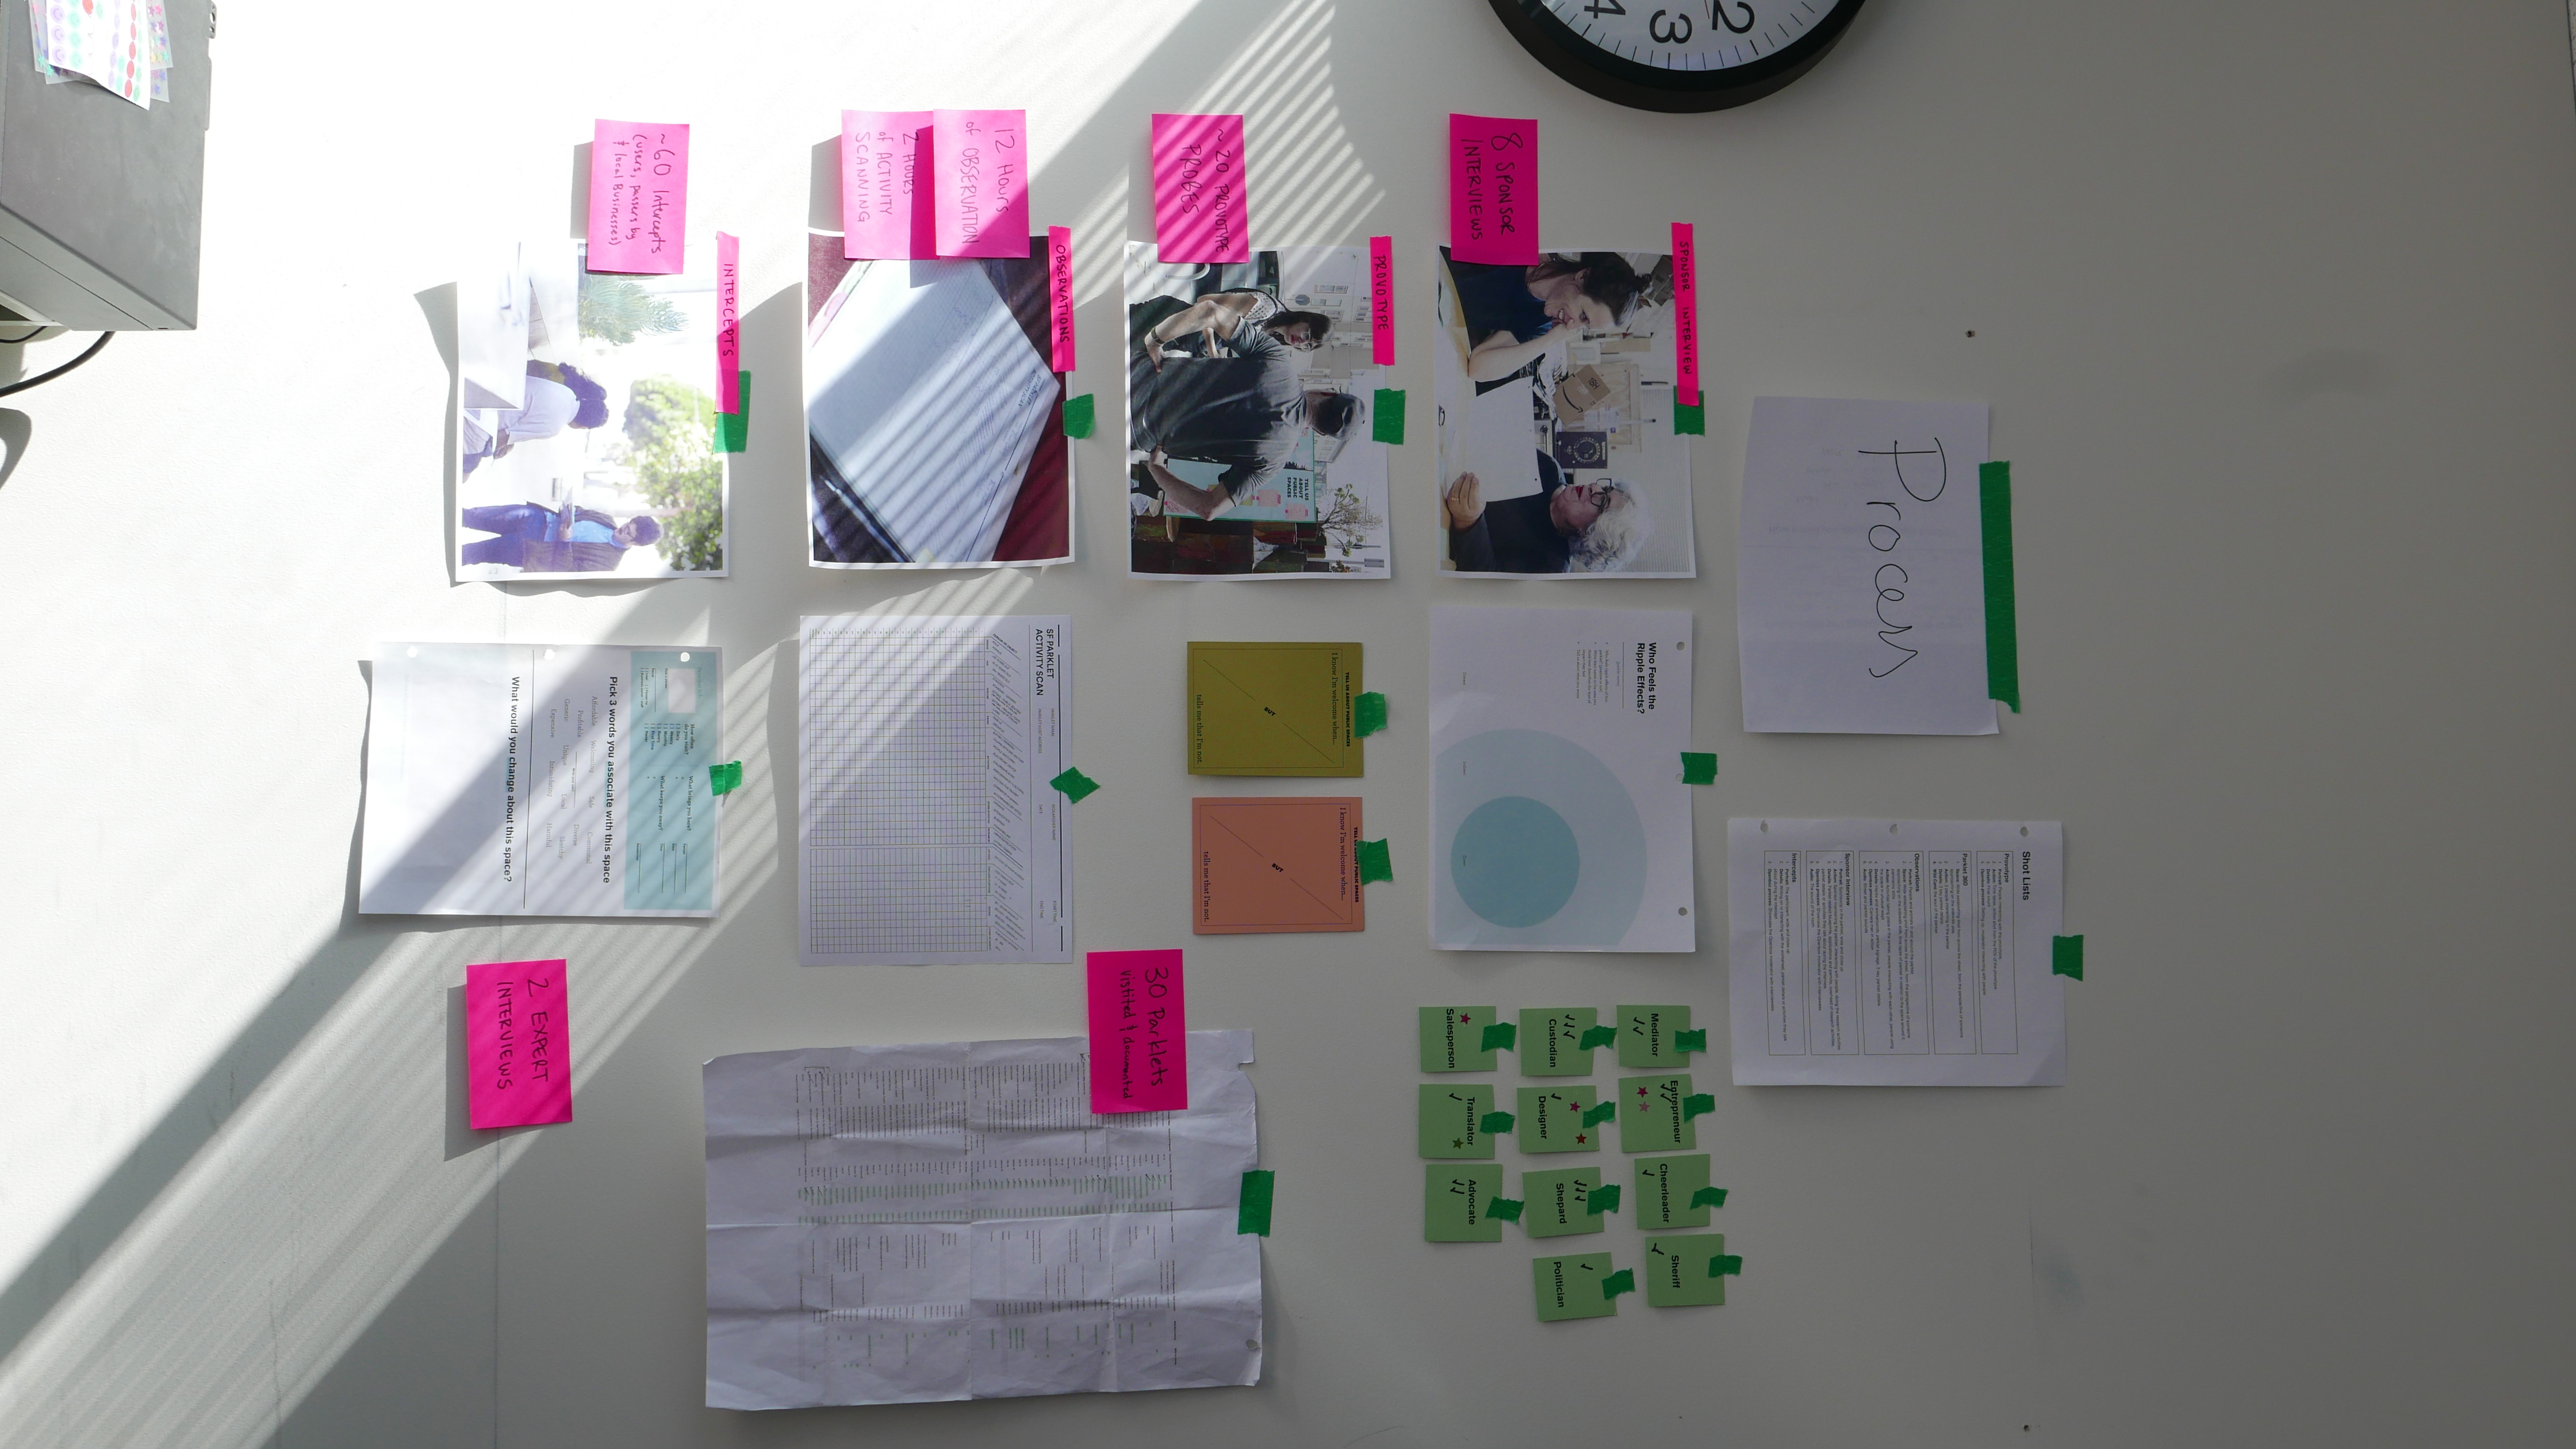
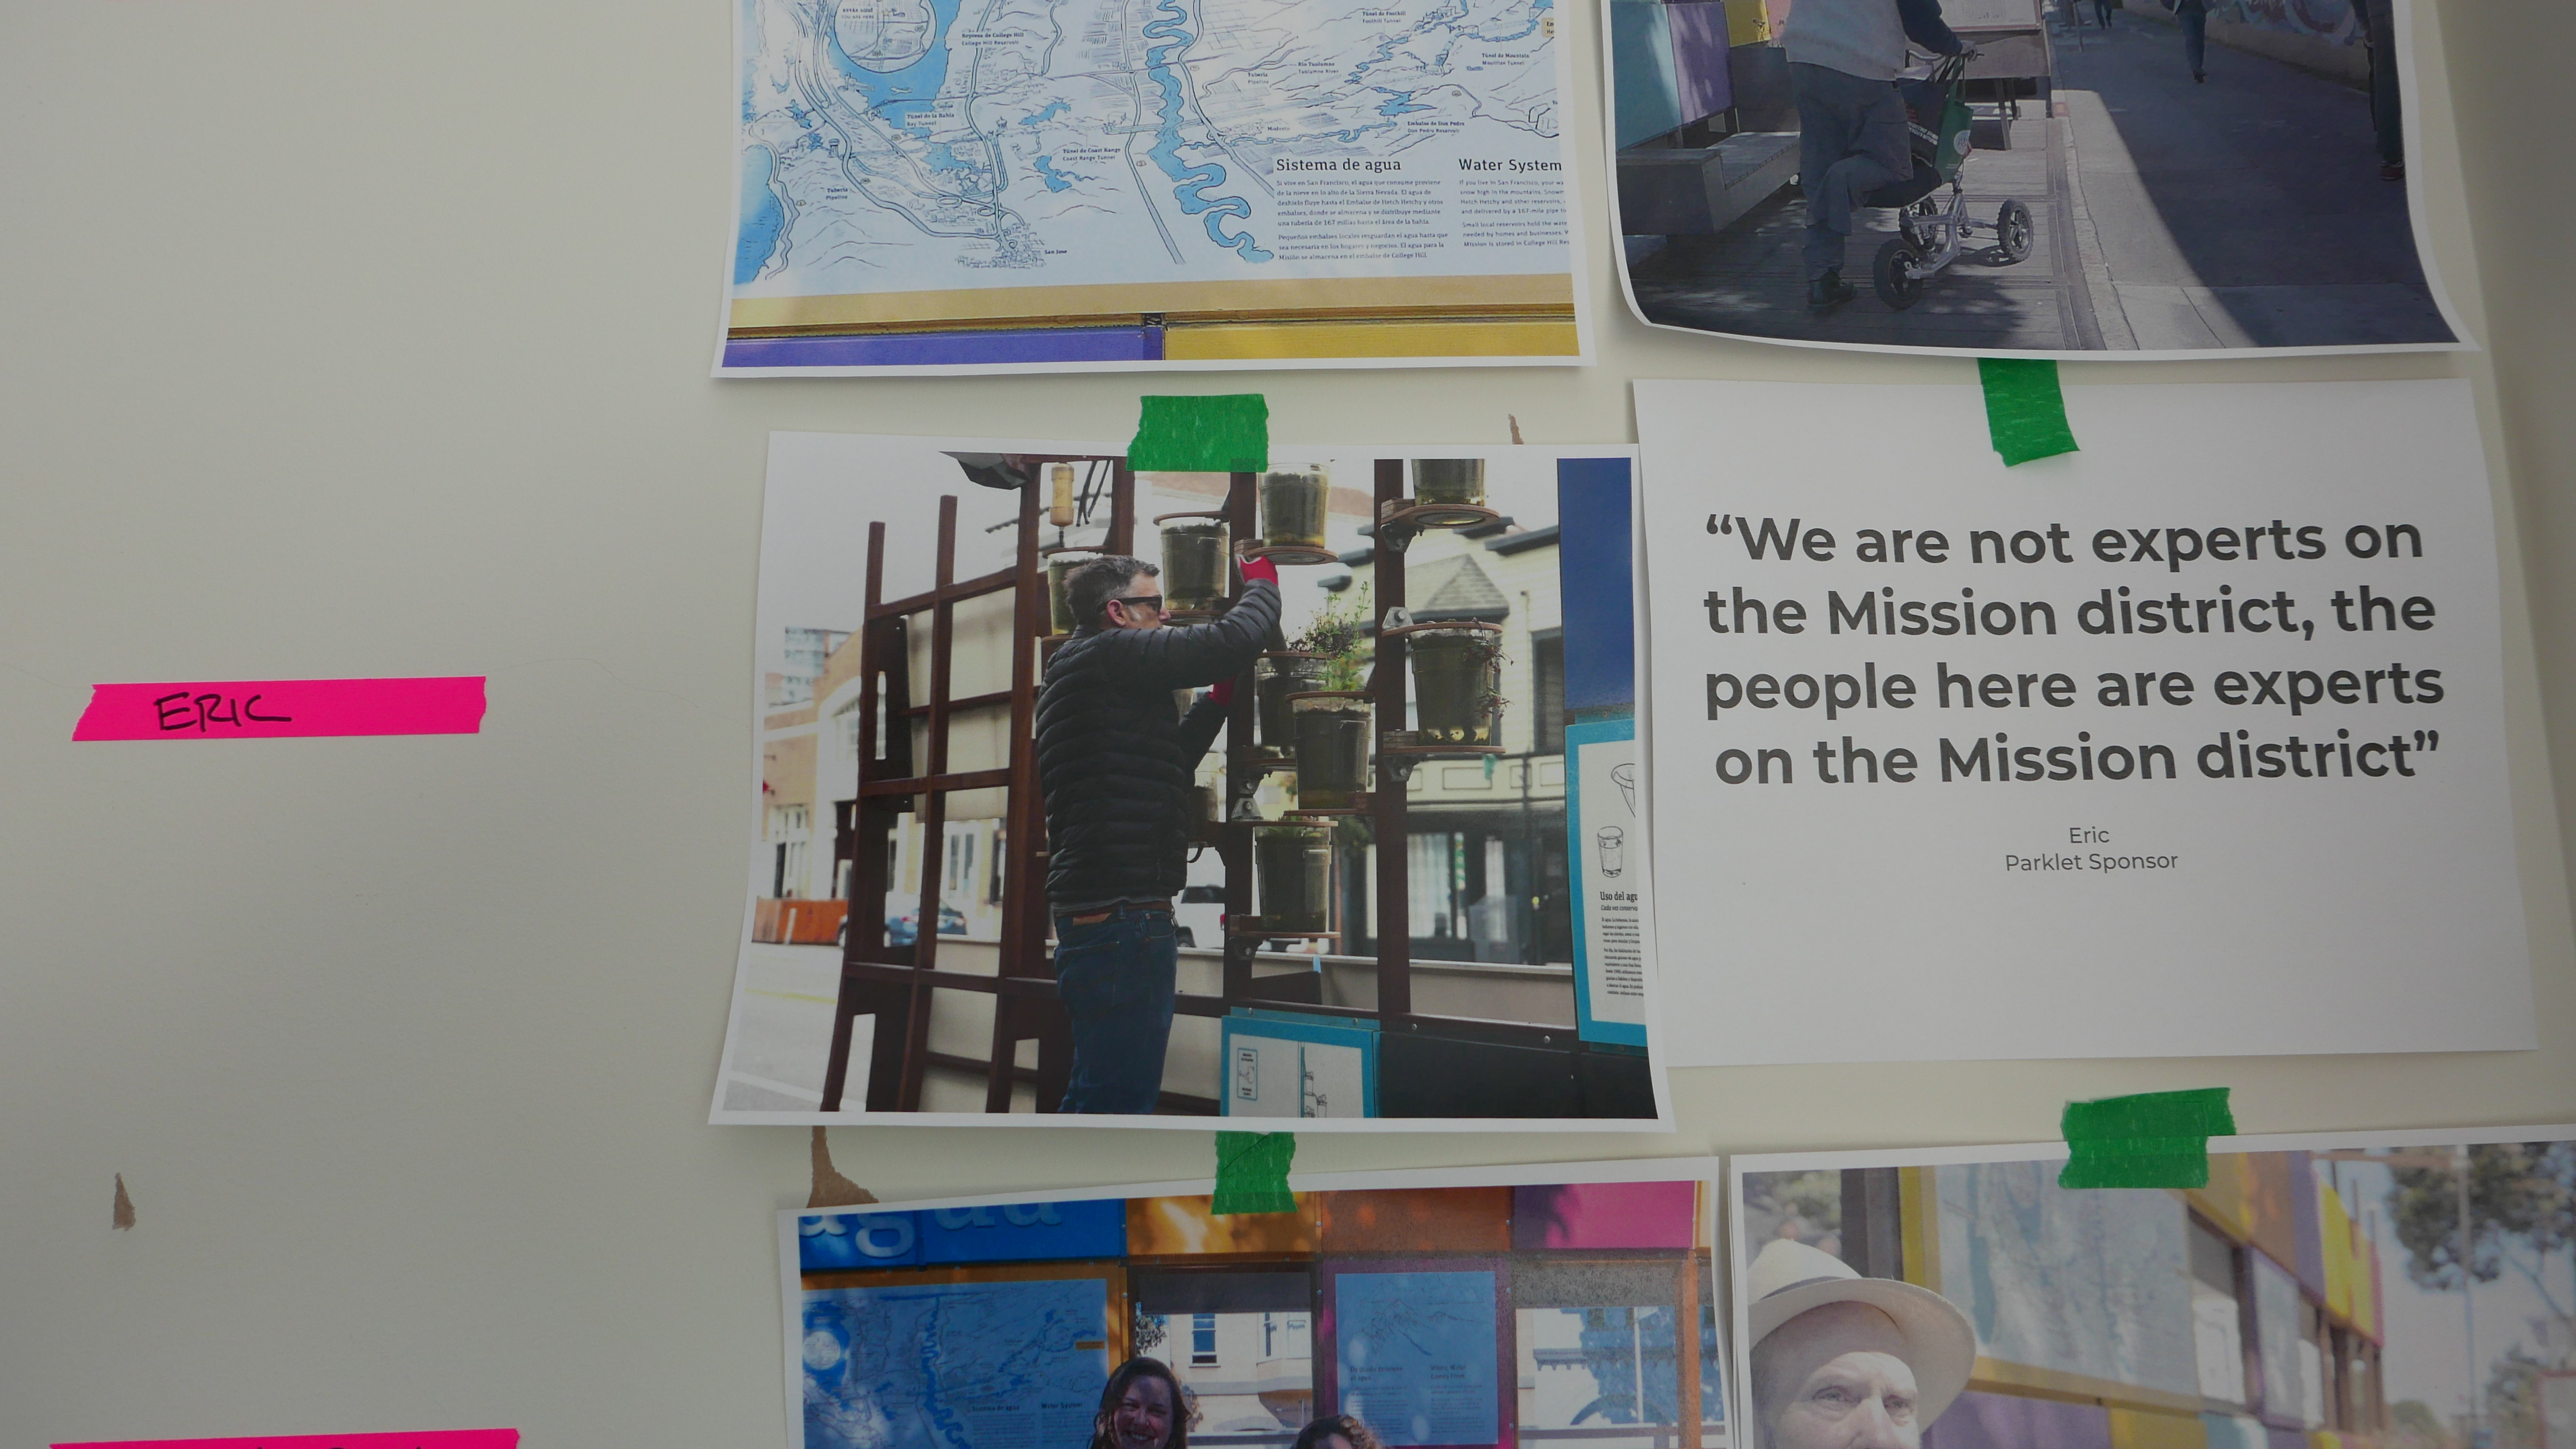
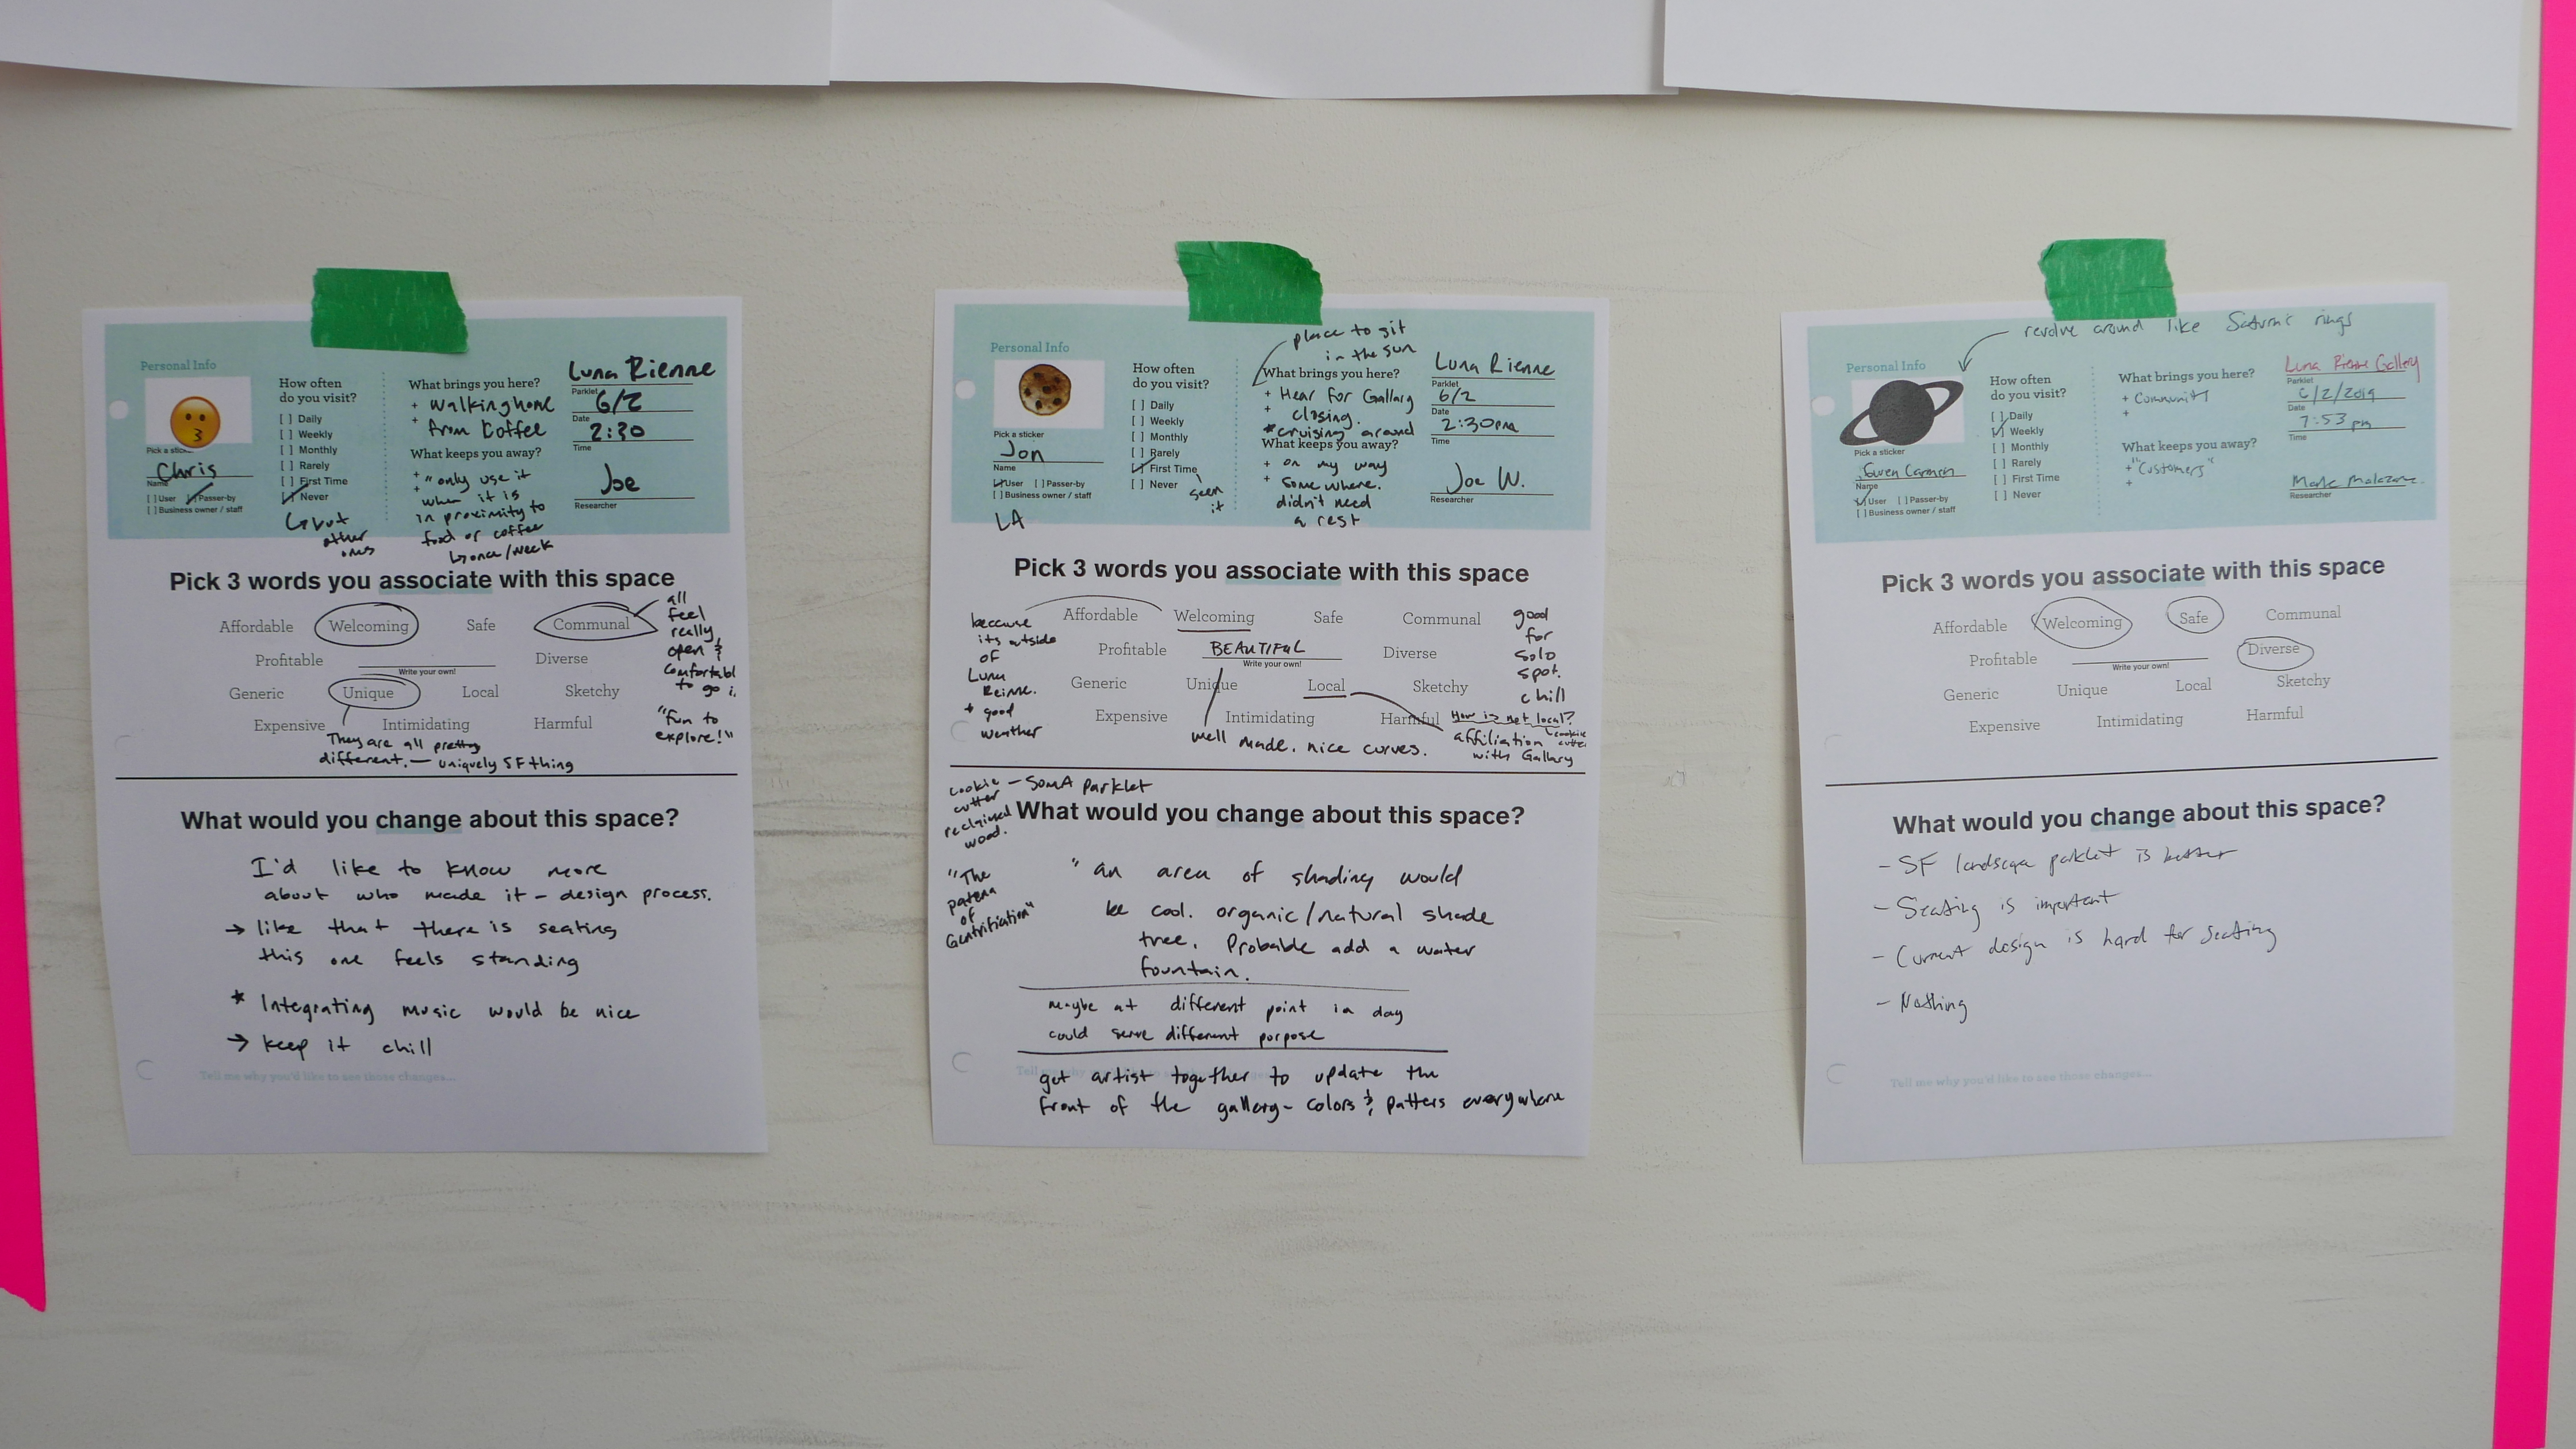
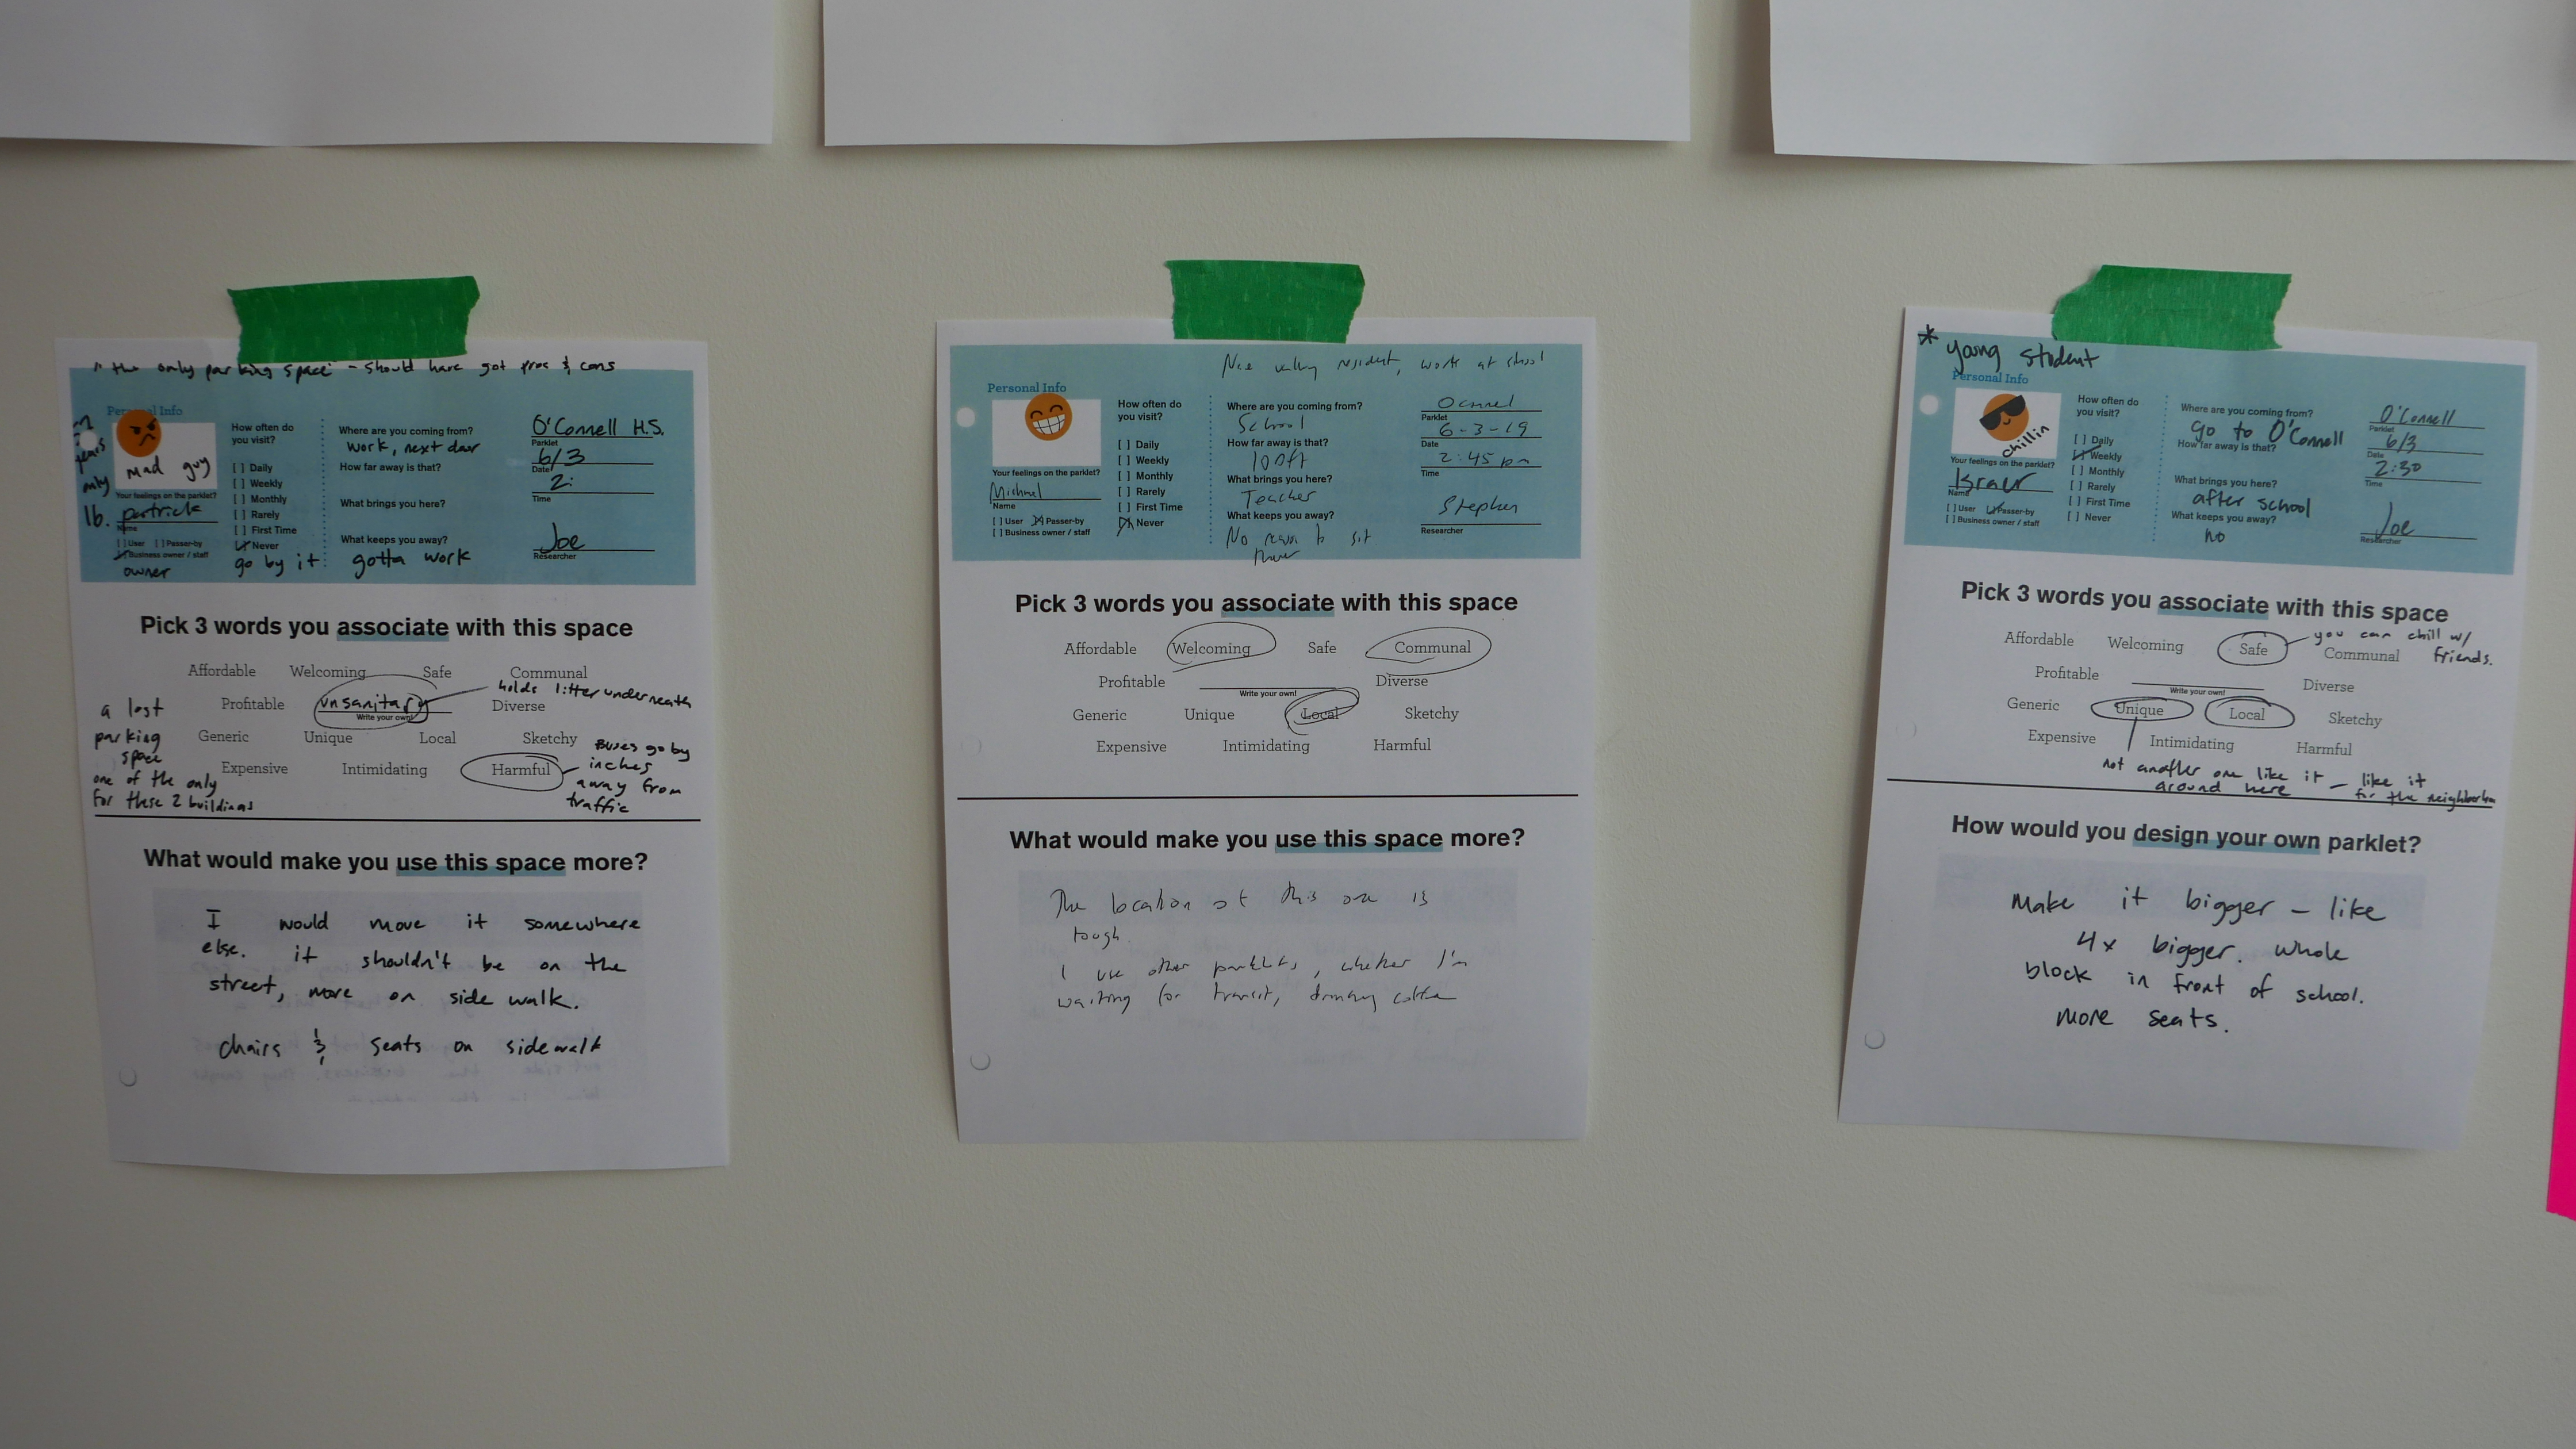
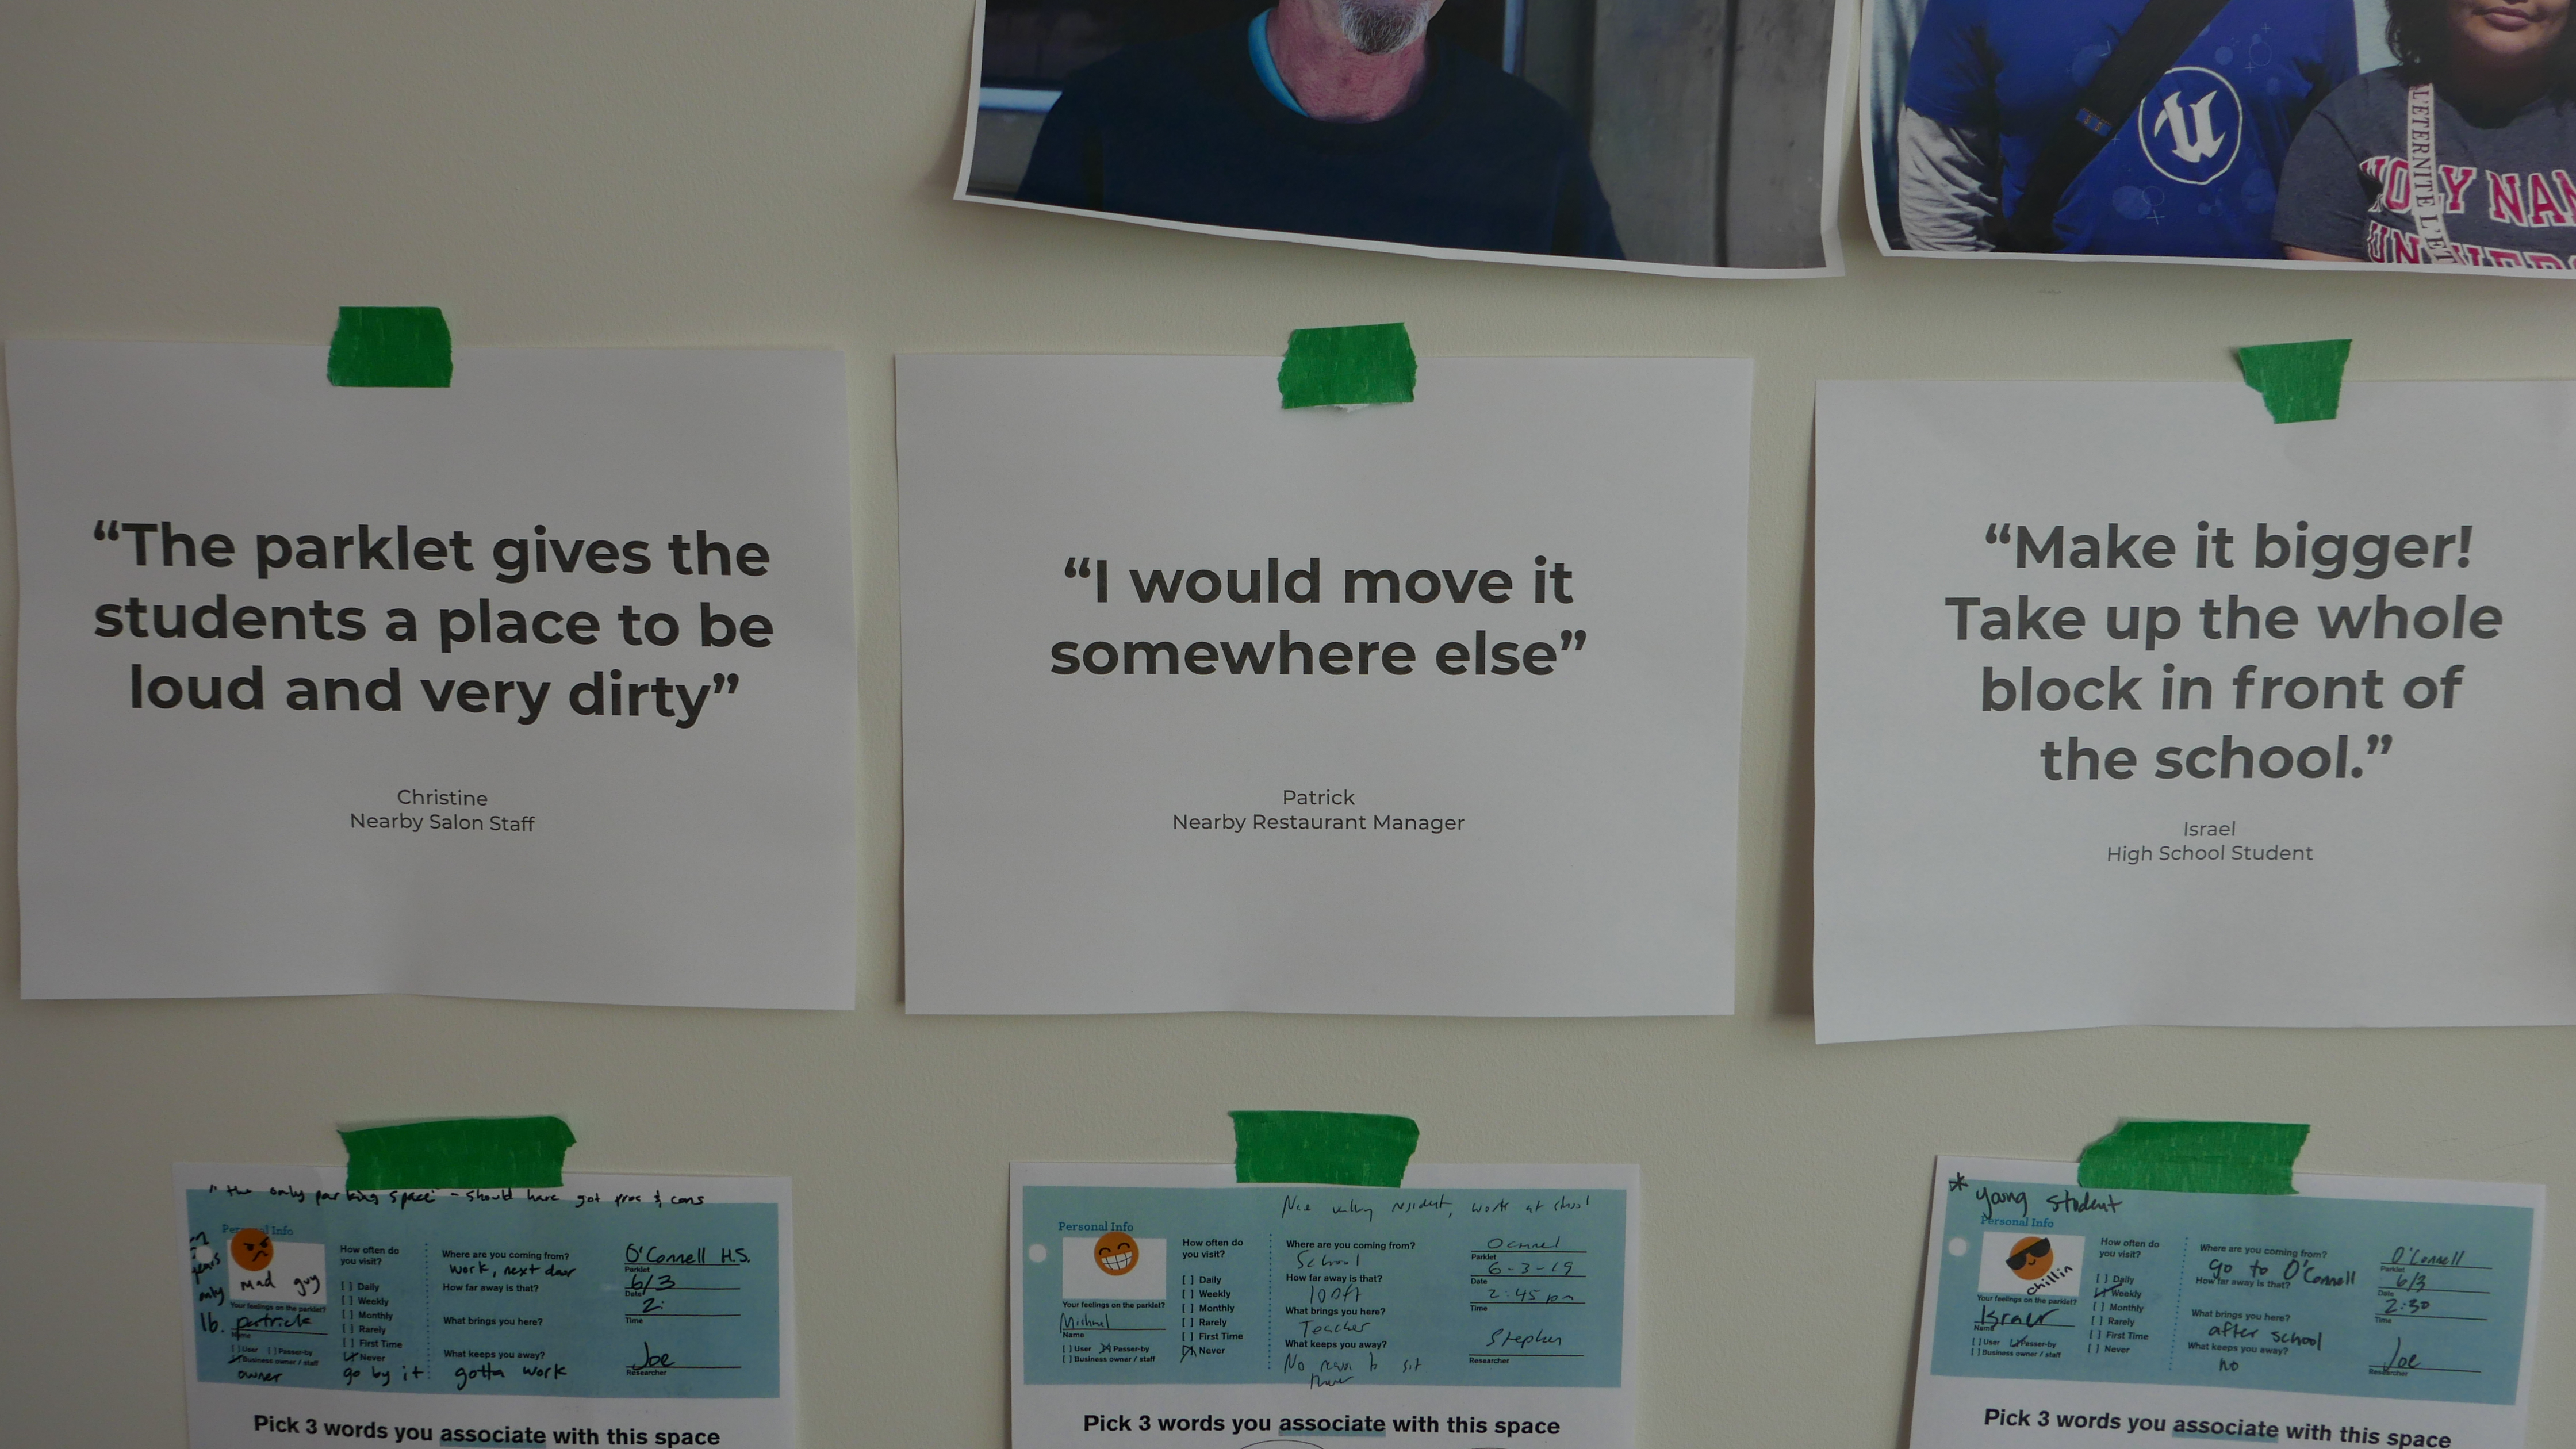
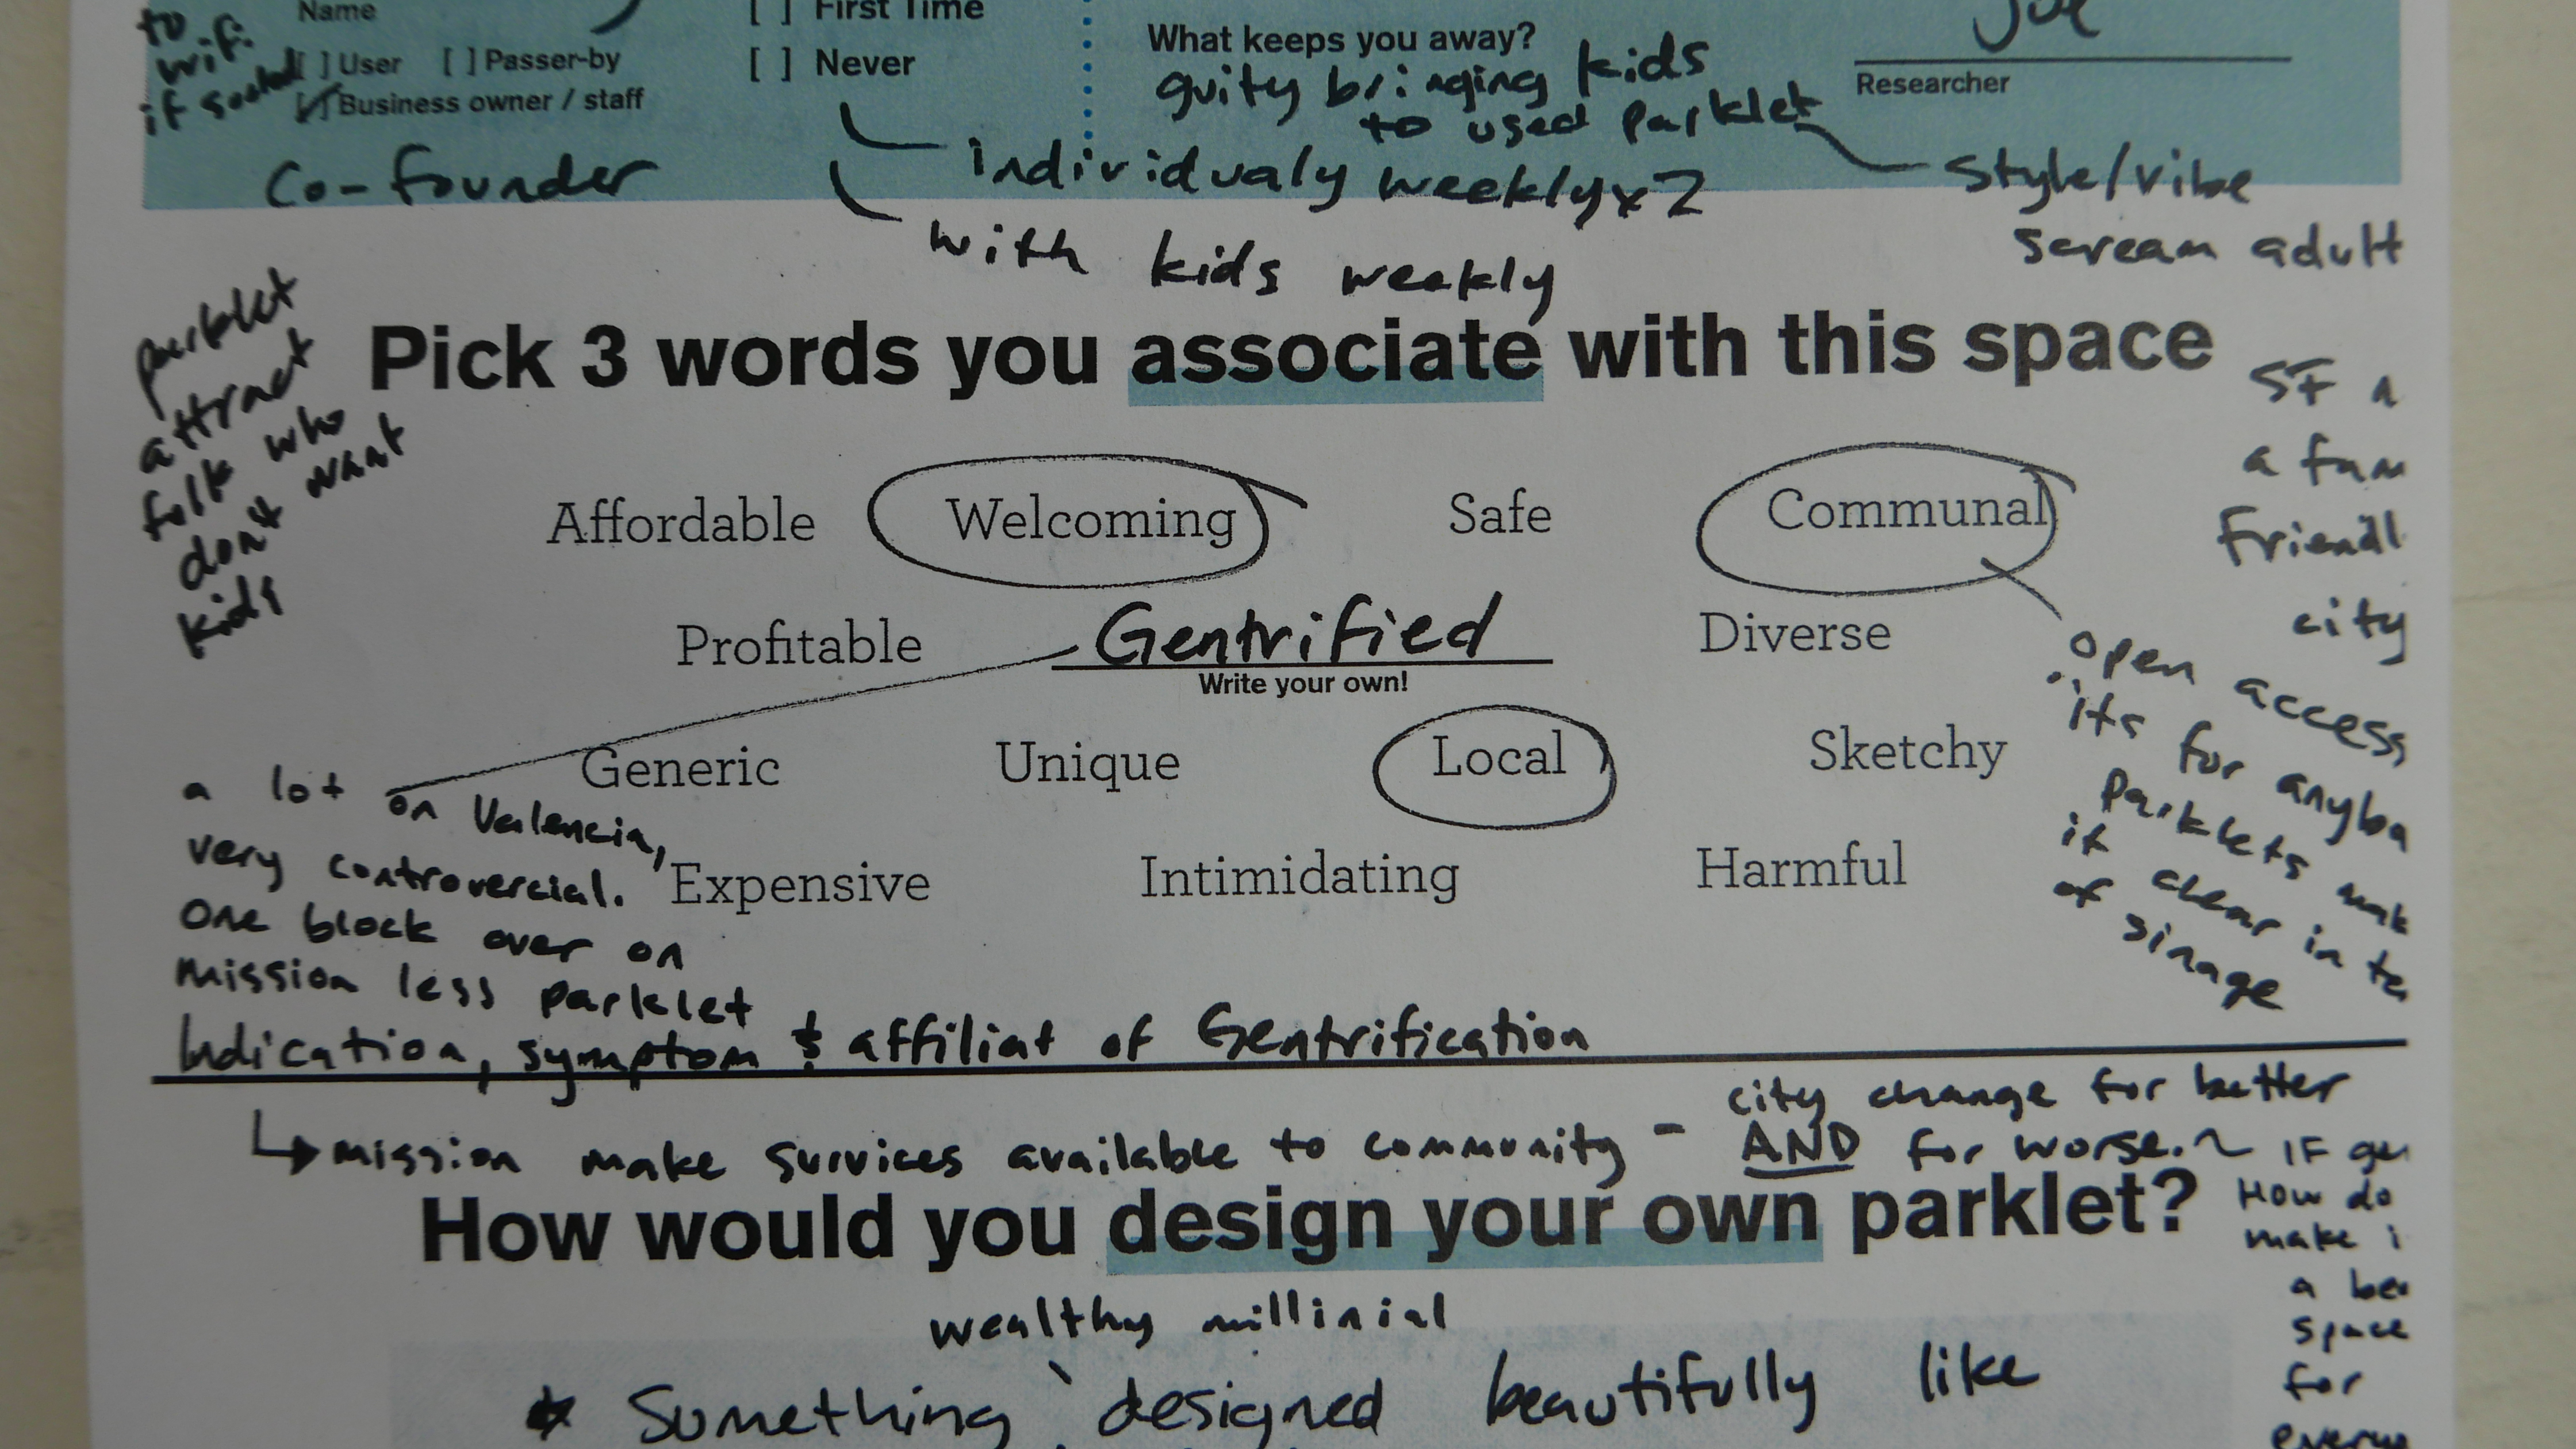
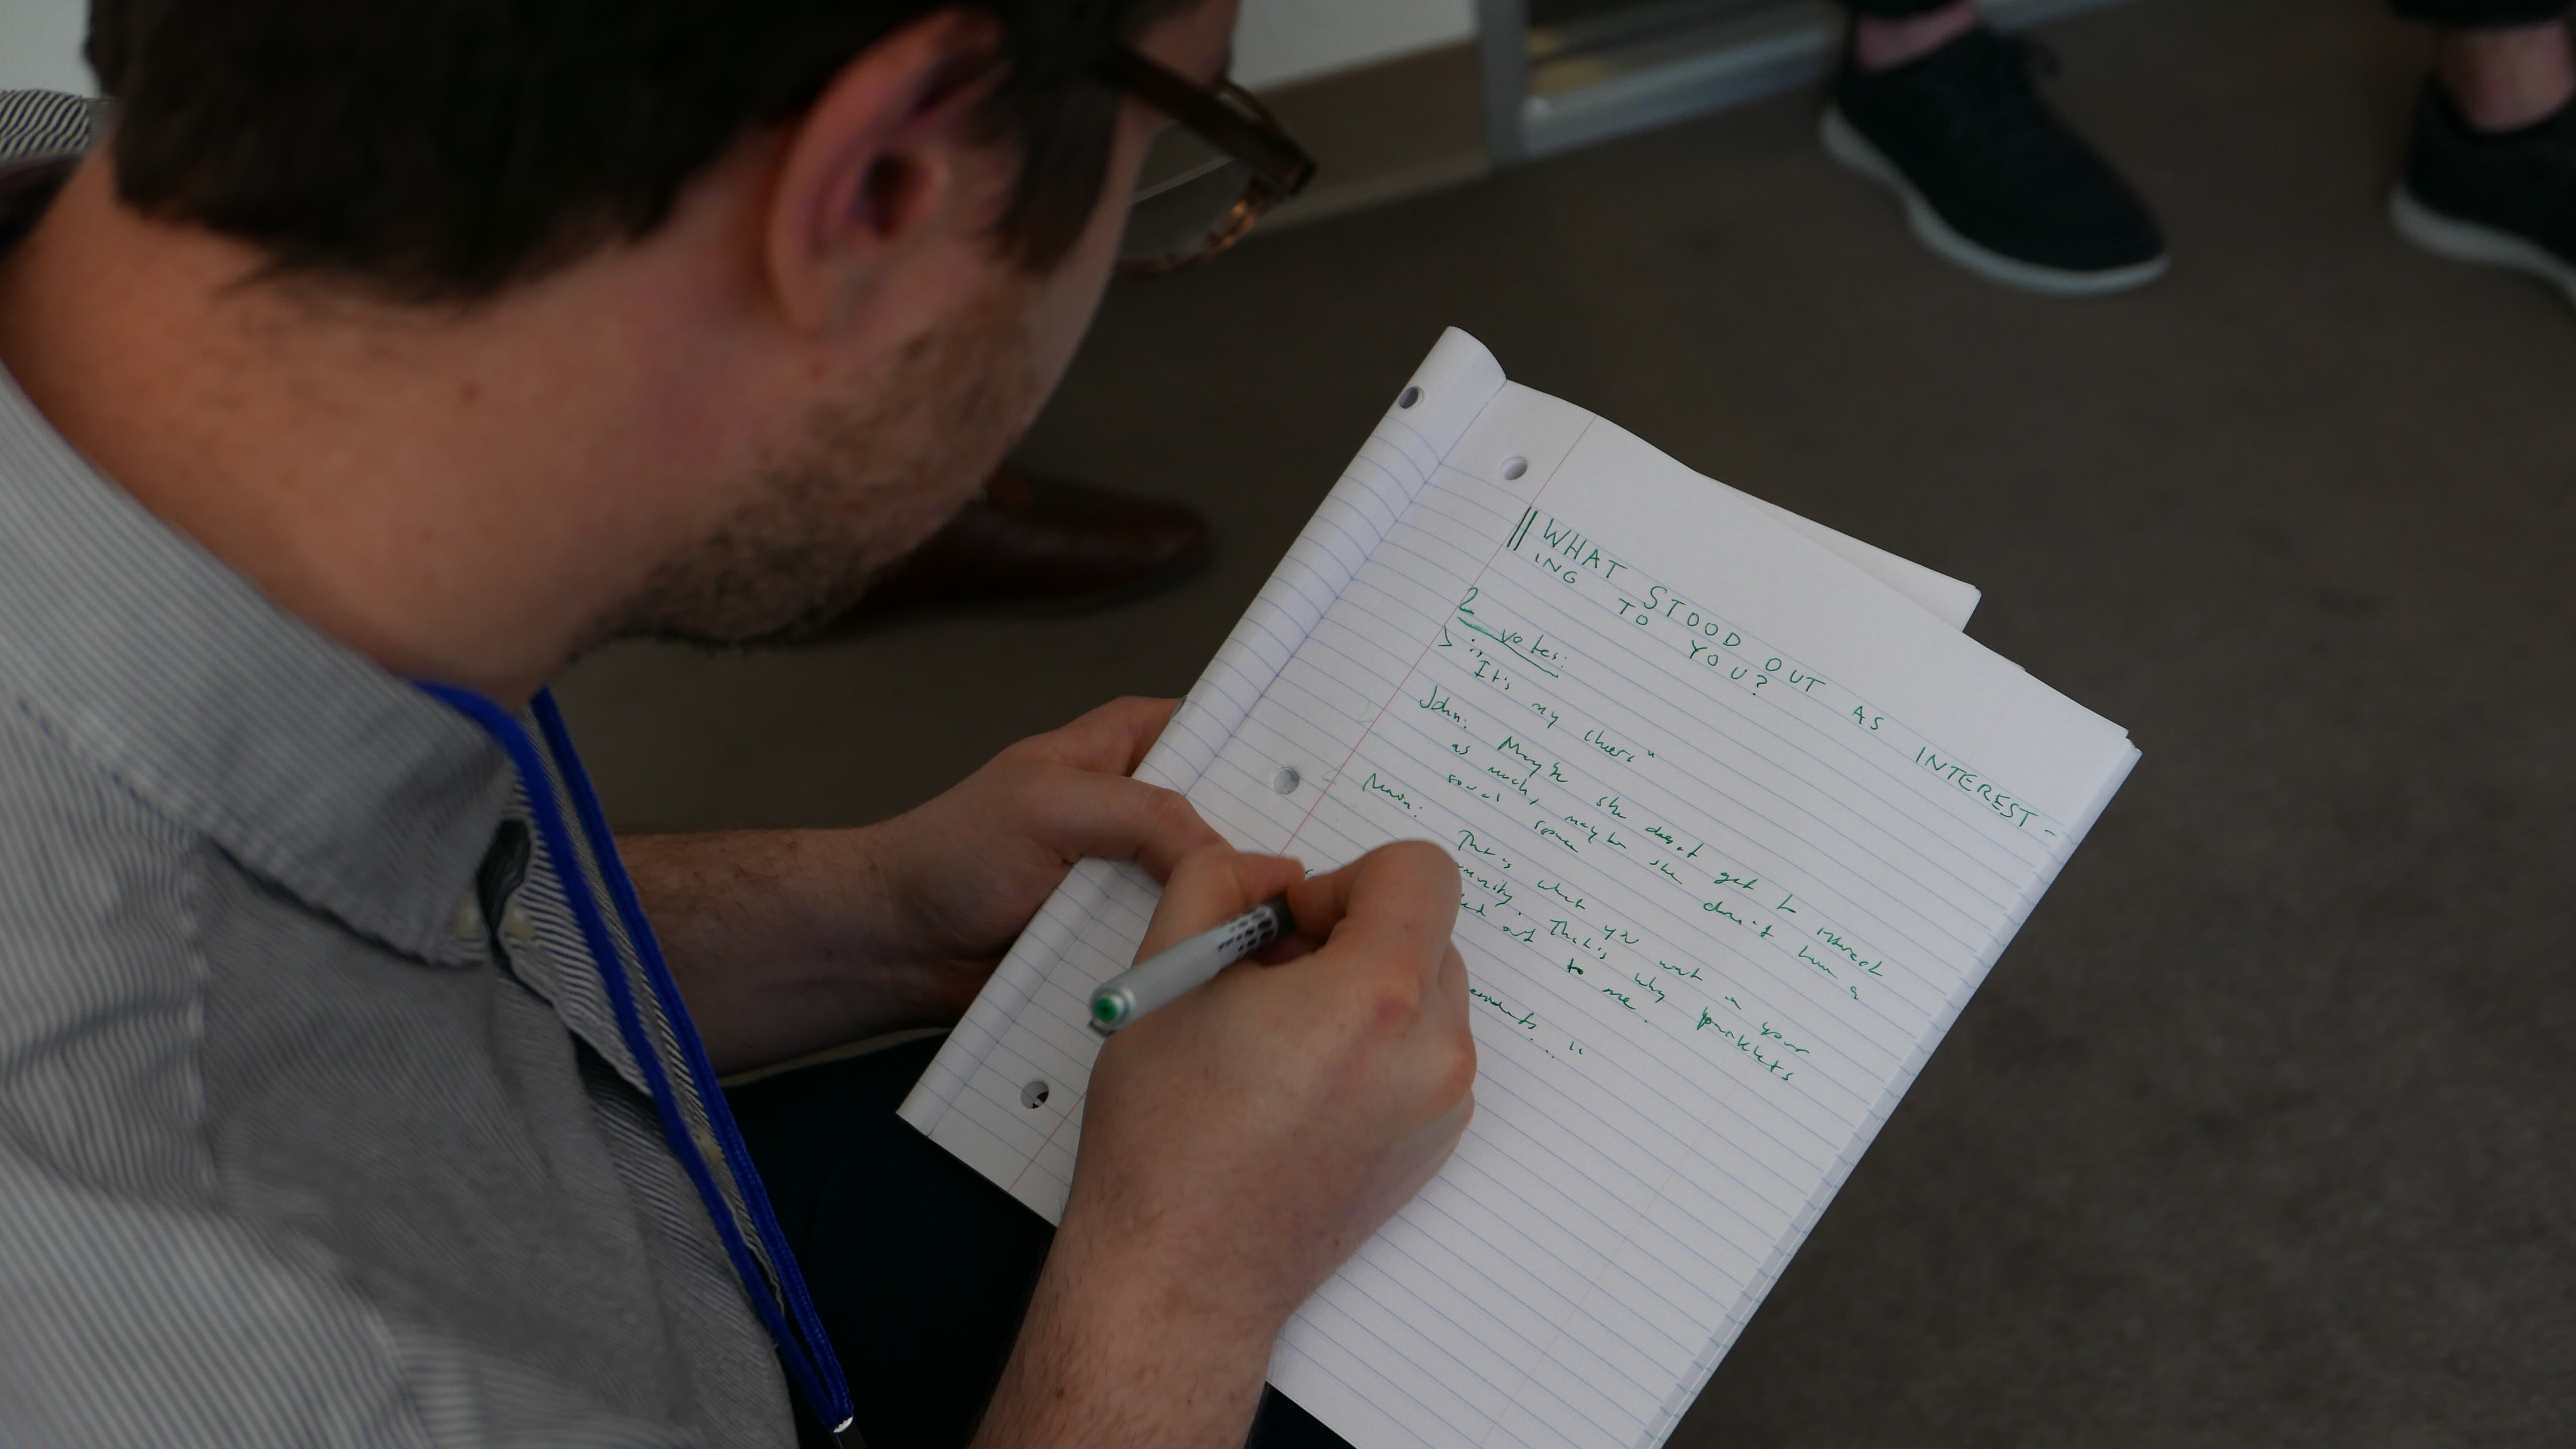
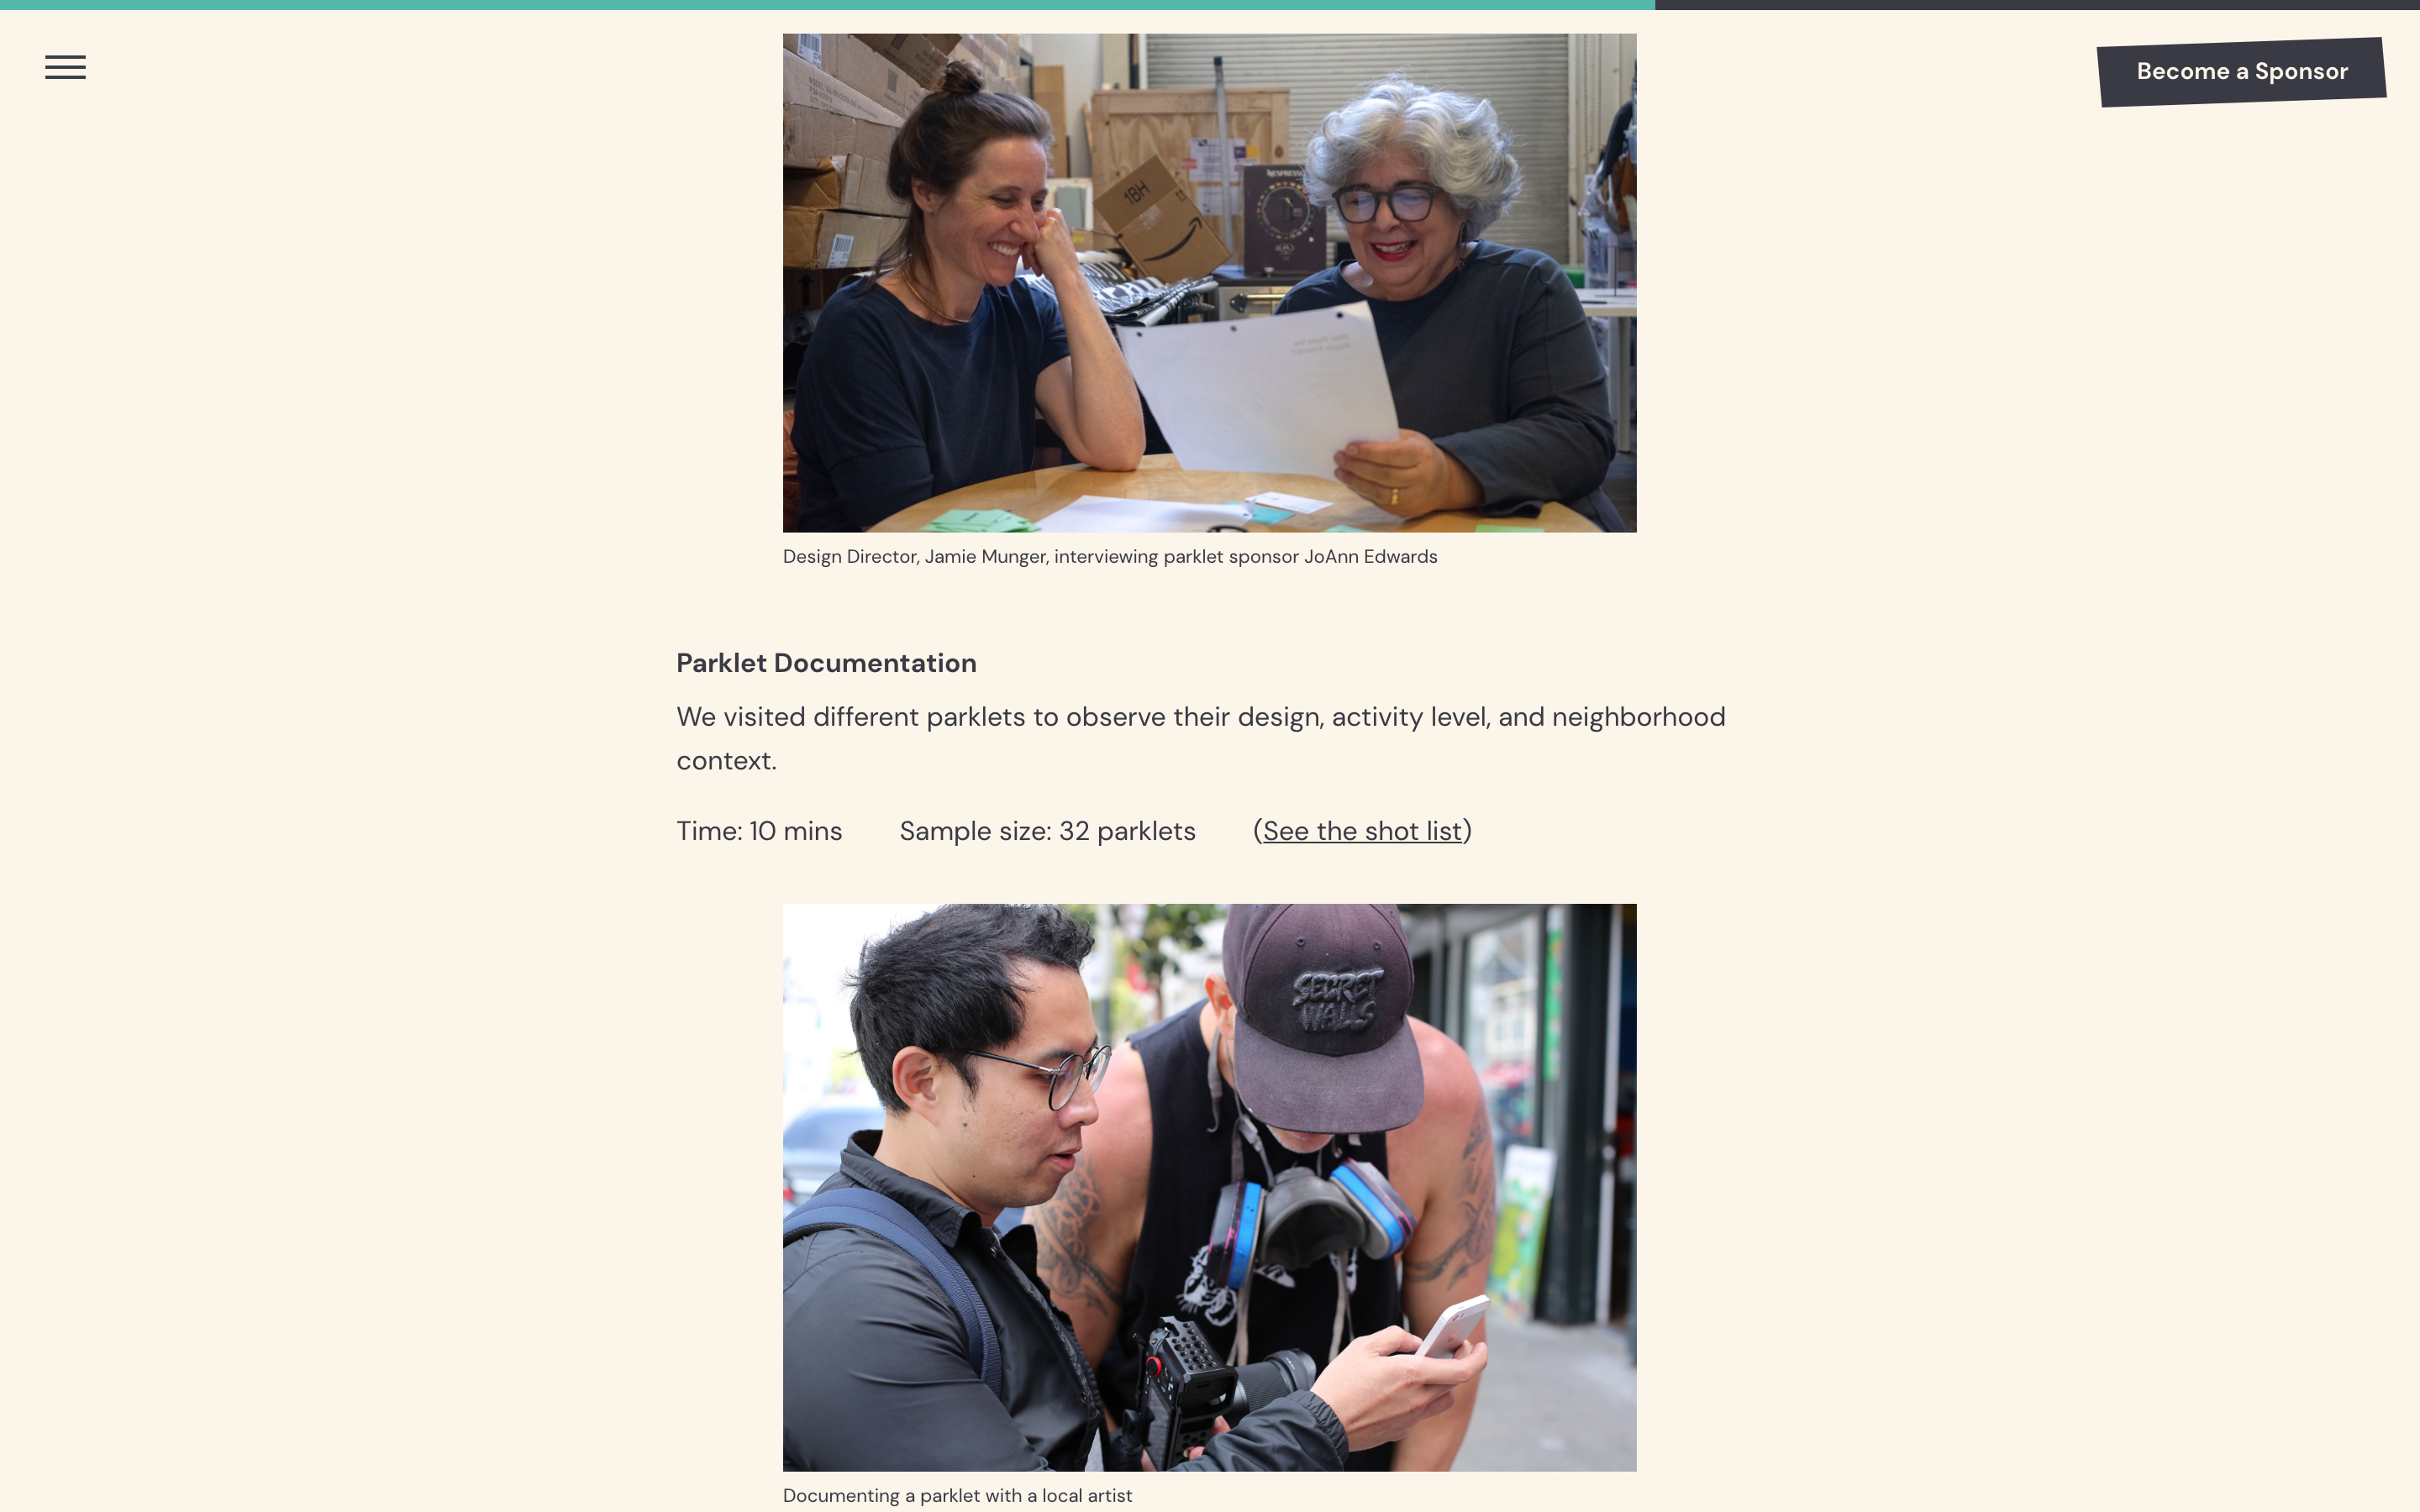
Openbox designed the field research materials and Stae helped in participating in their various ethnographic research methods.
Responsibilities
- Ethnographic Research
- Interviews
- Photography
- Video
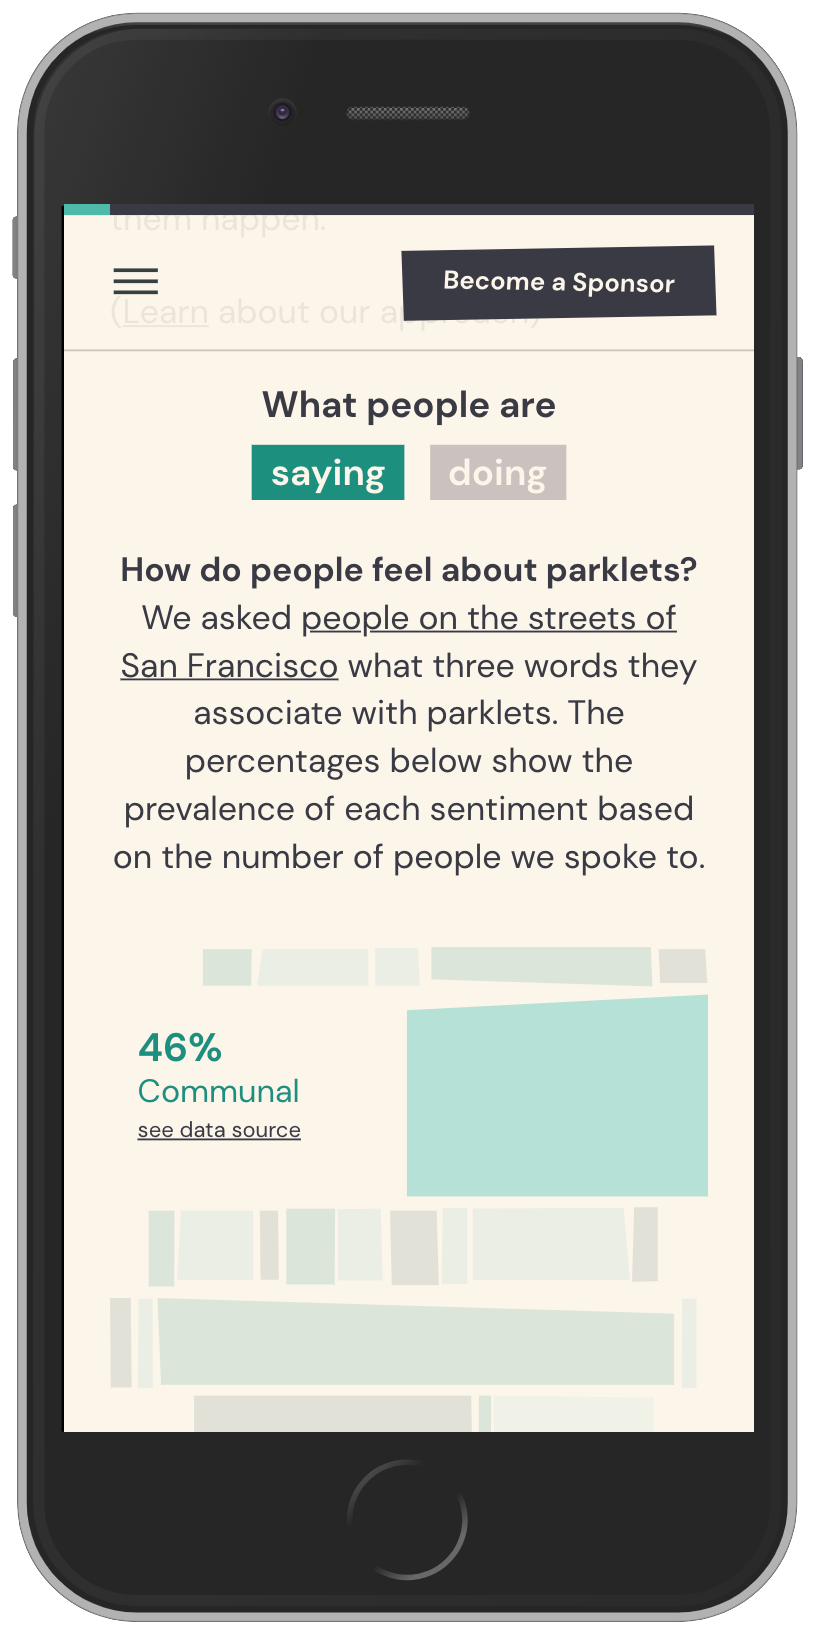
- Intercept Surveys
- Observation & Notes
Research Materials


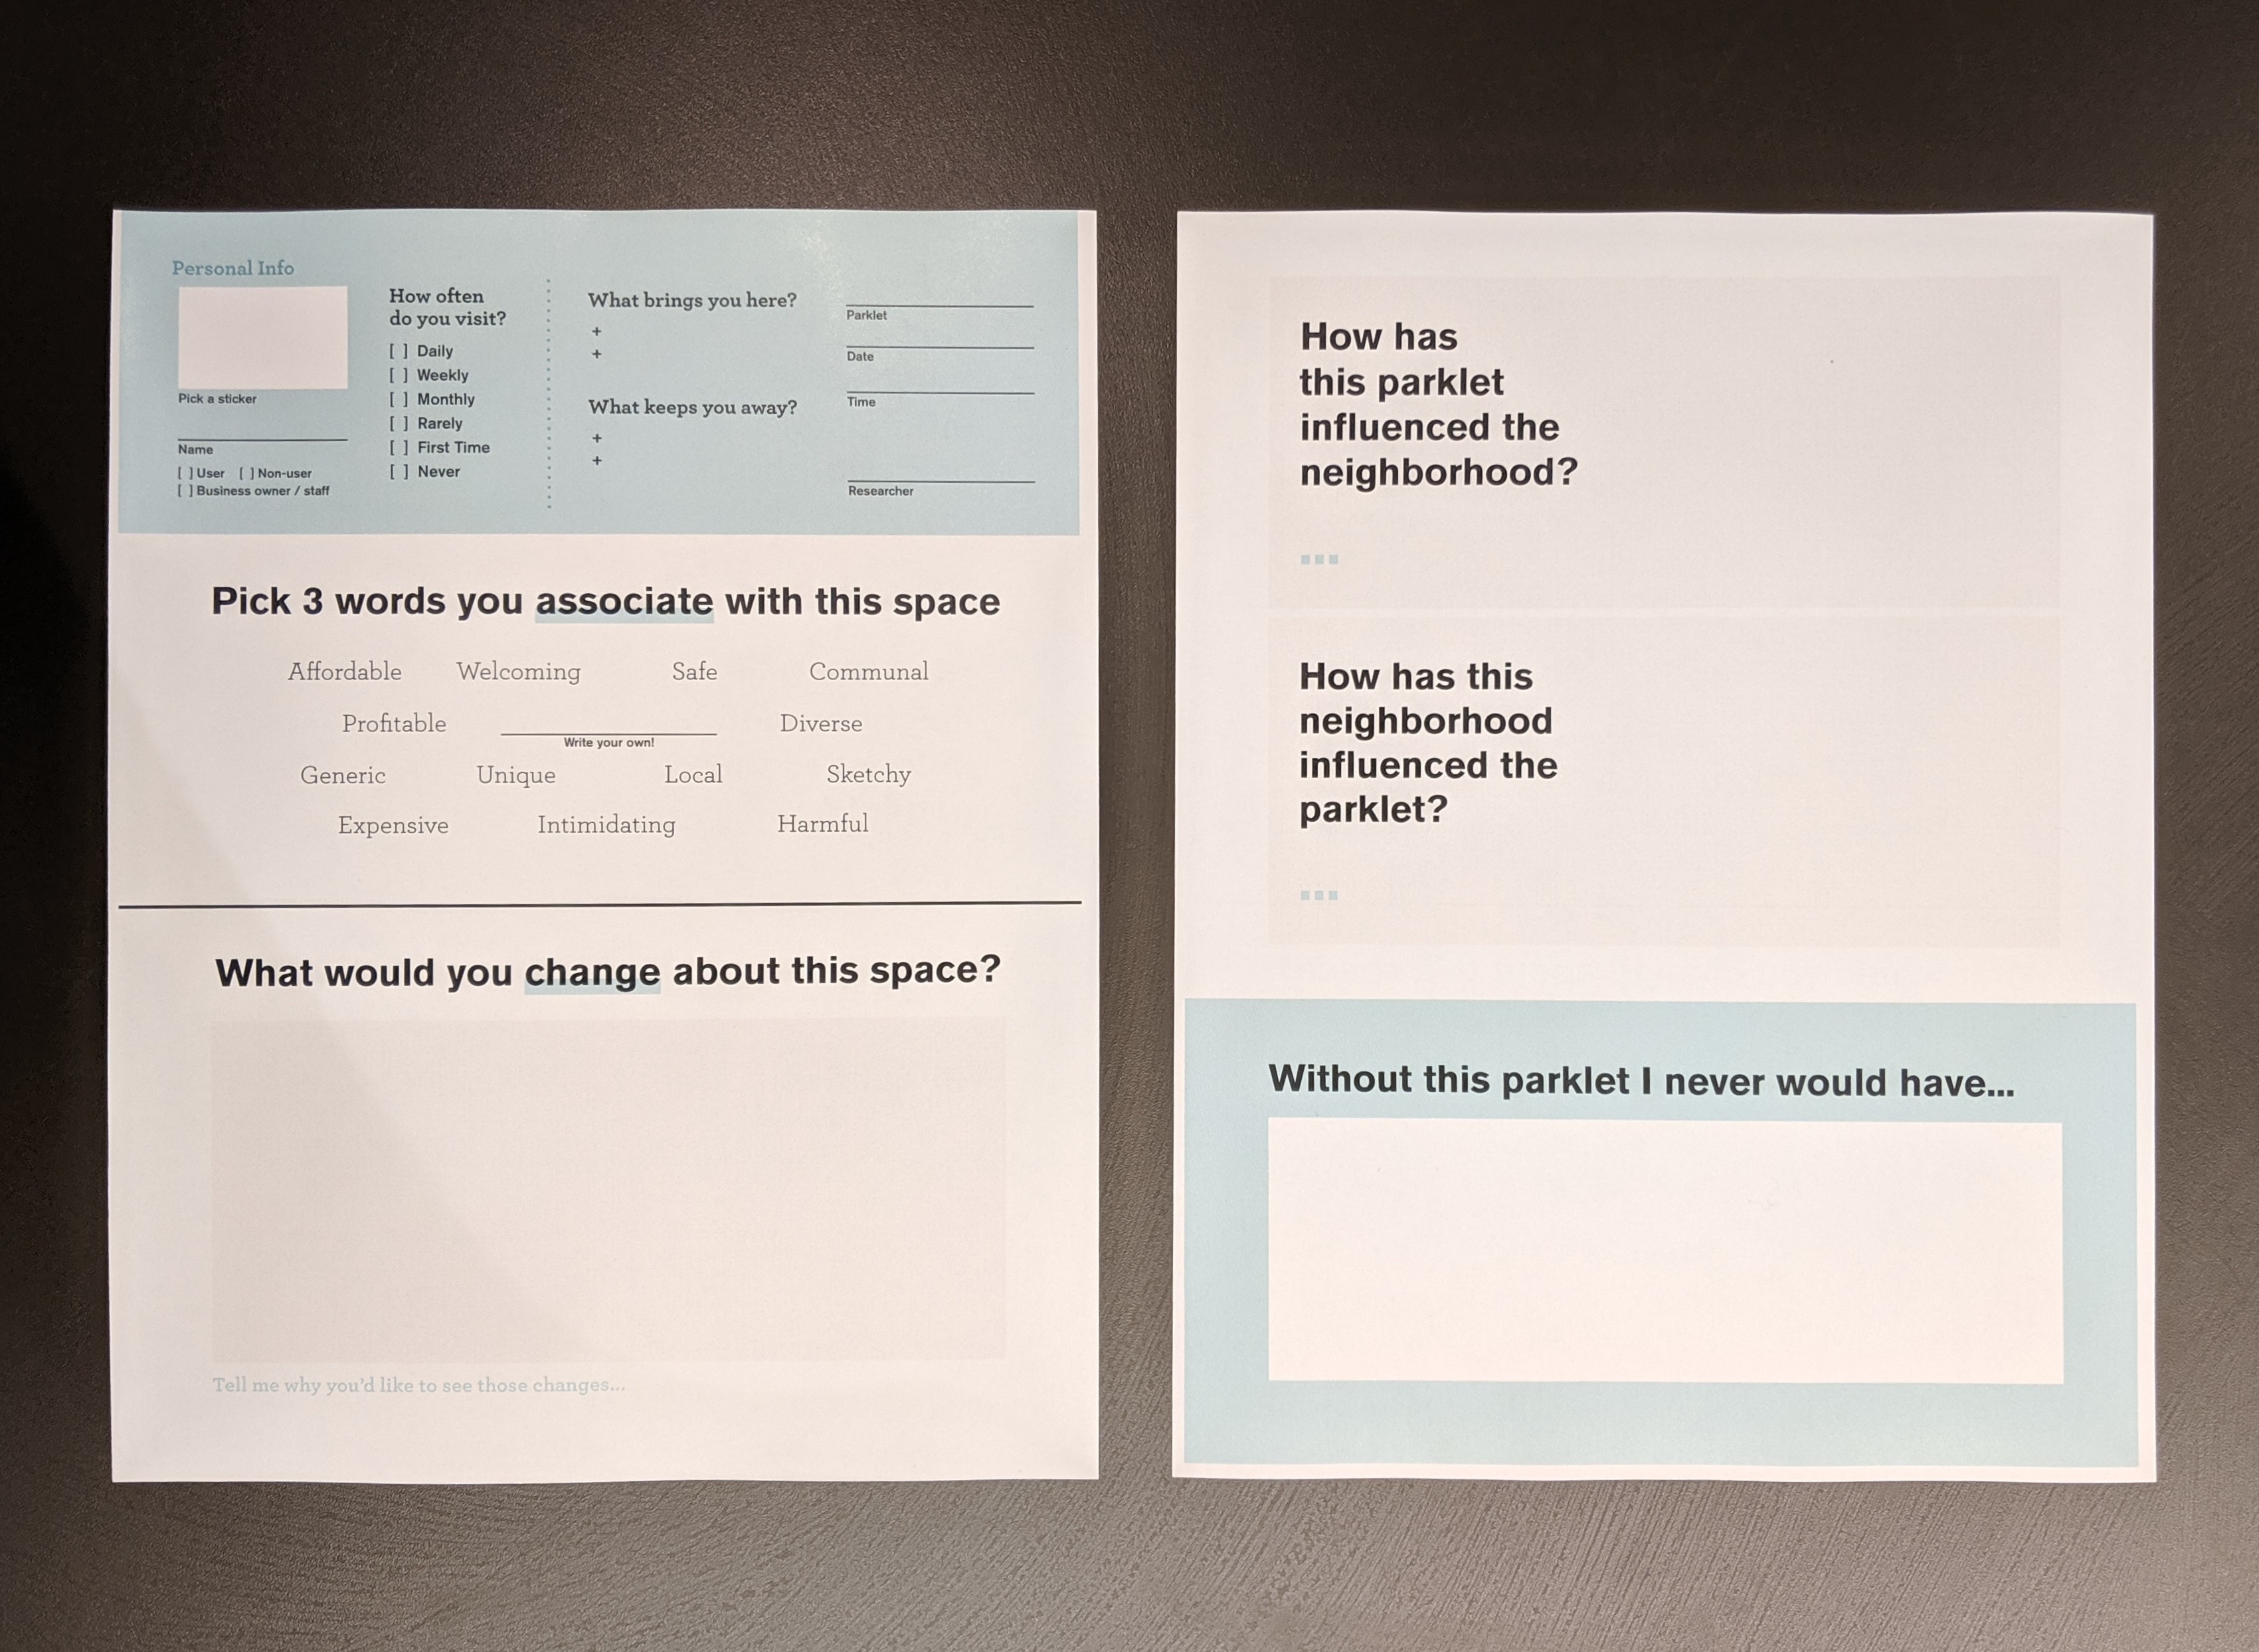

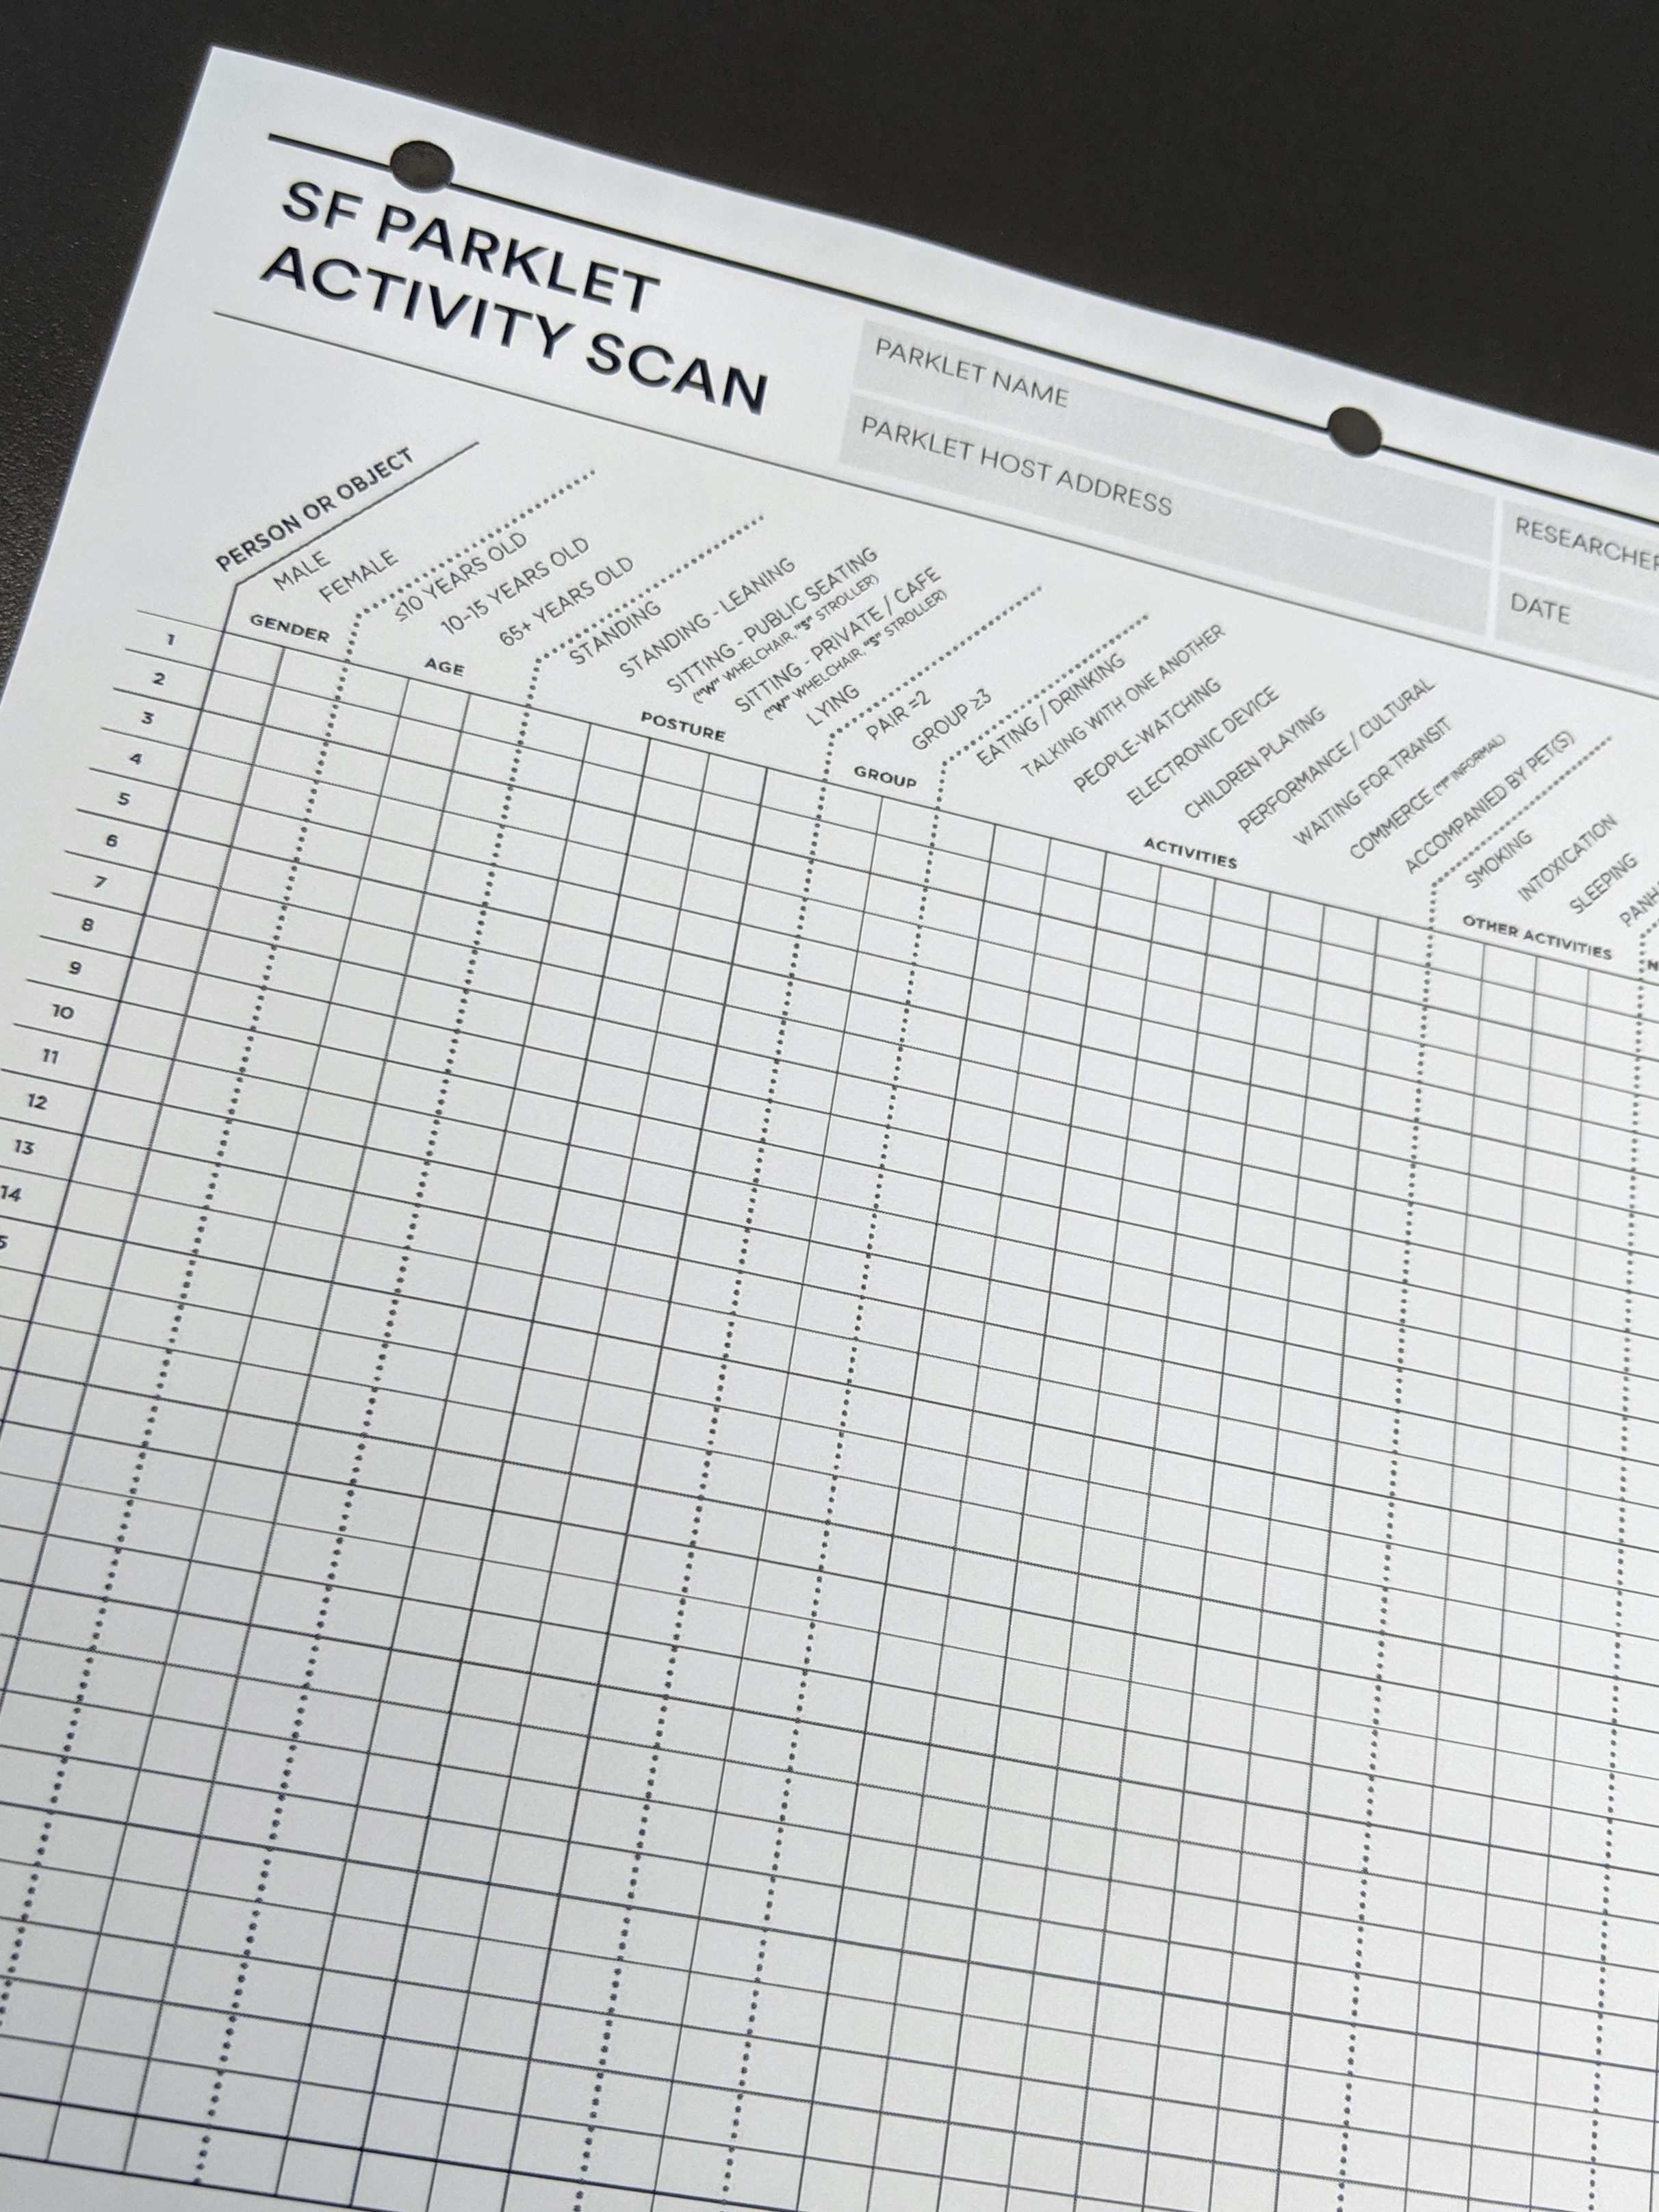
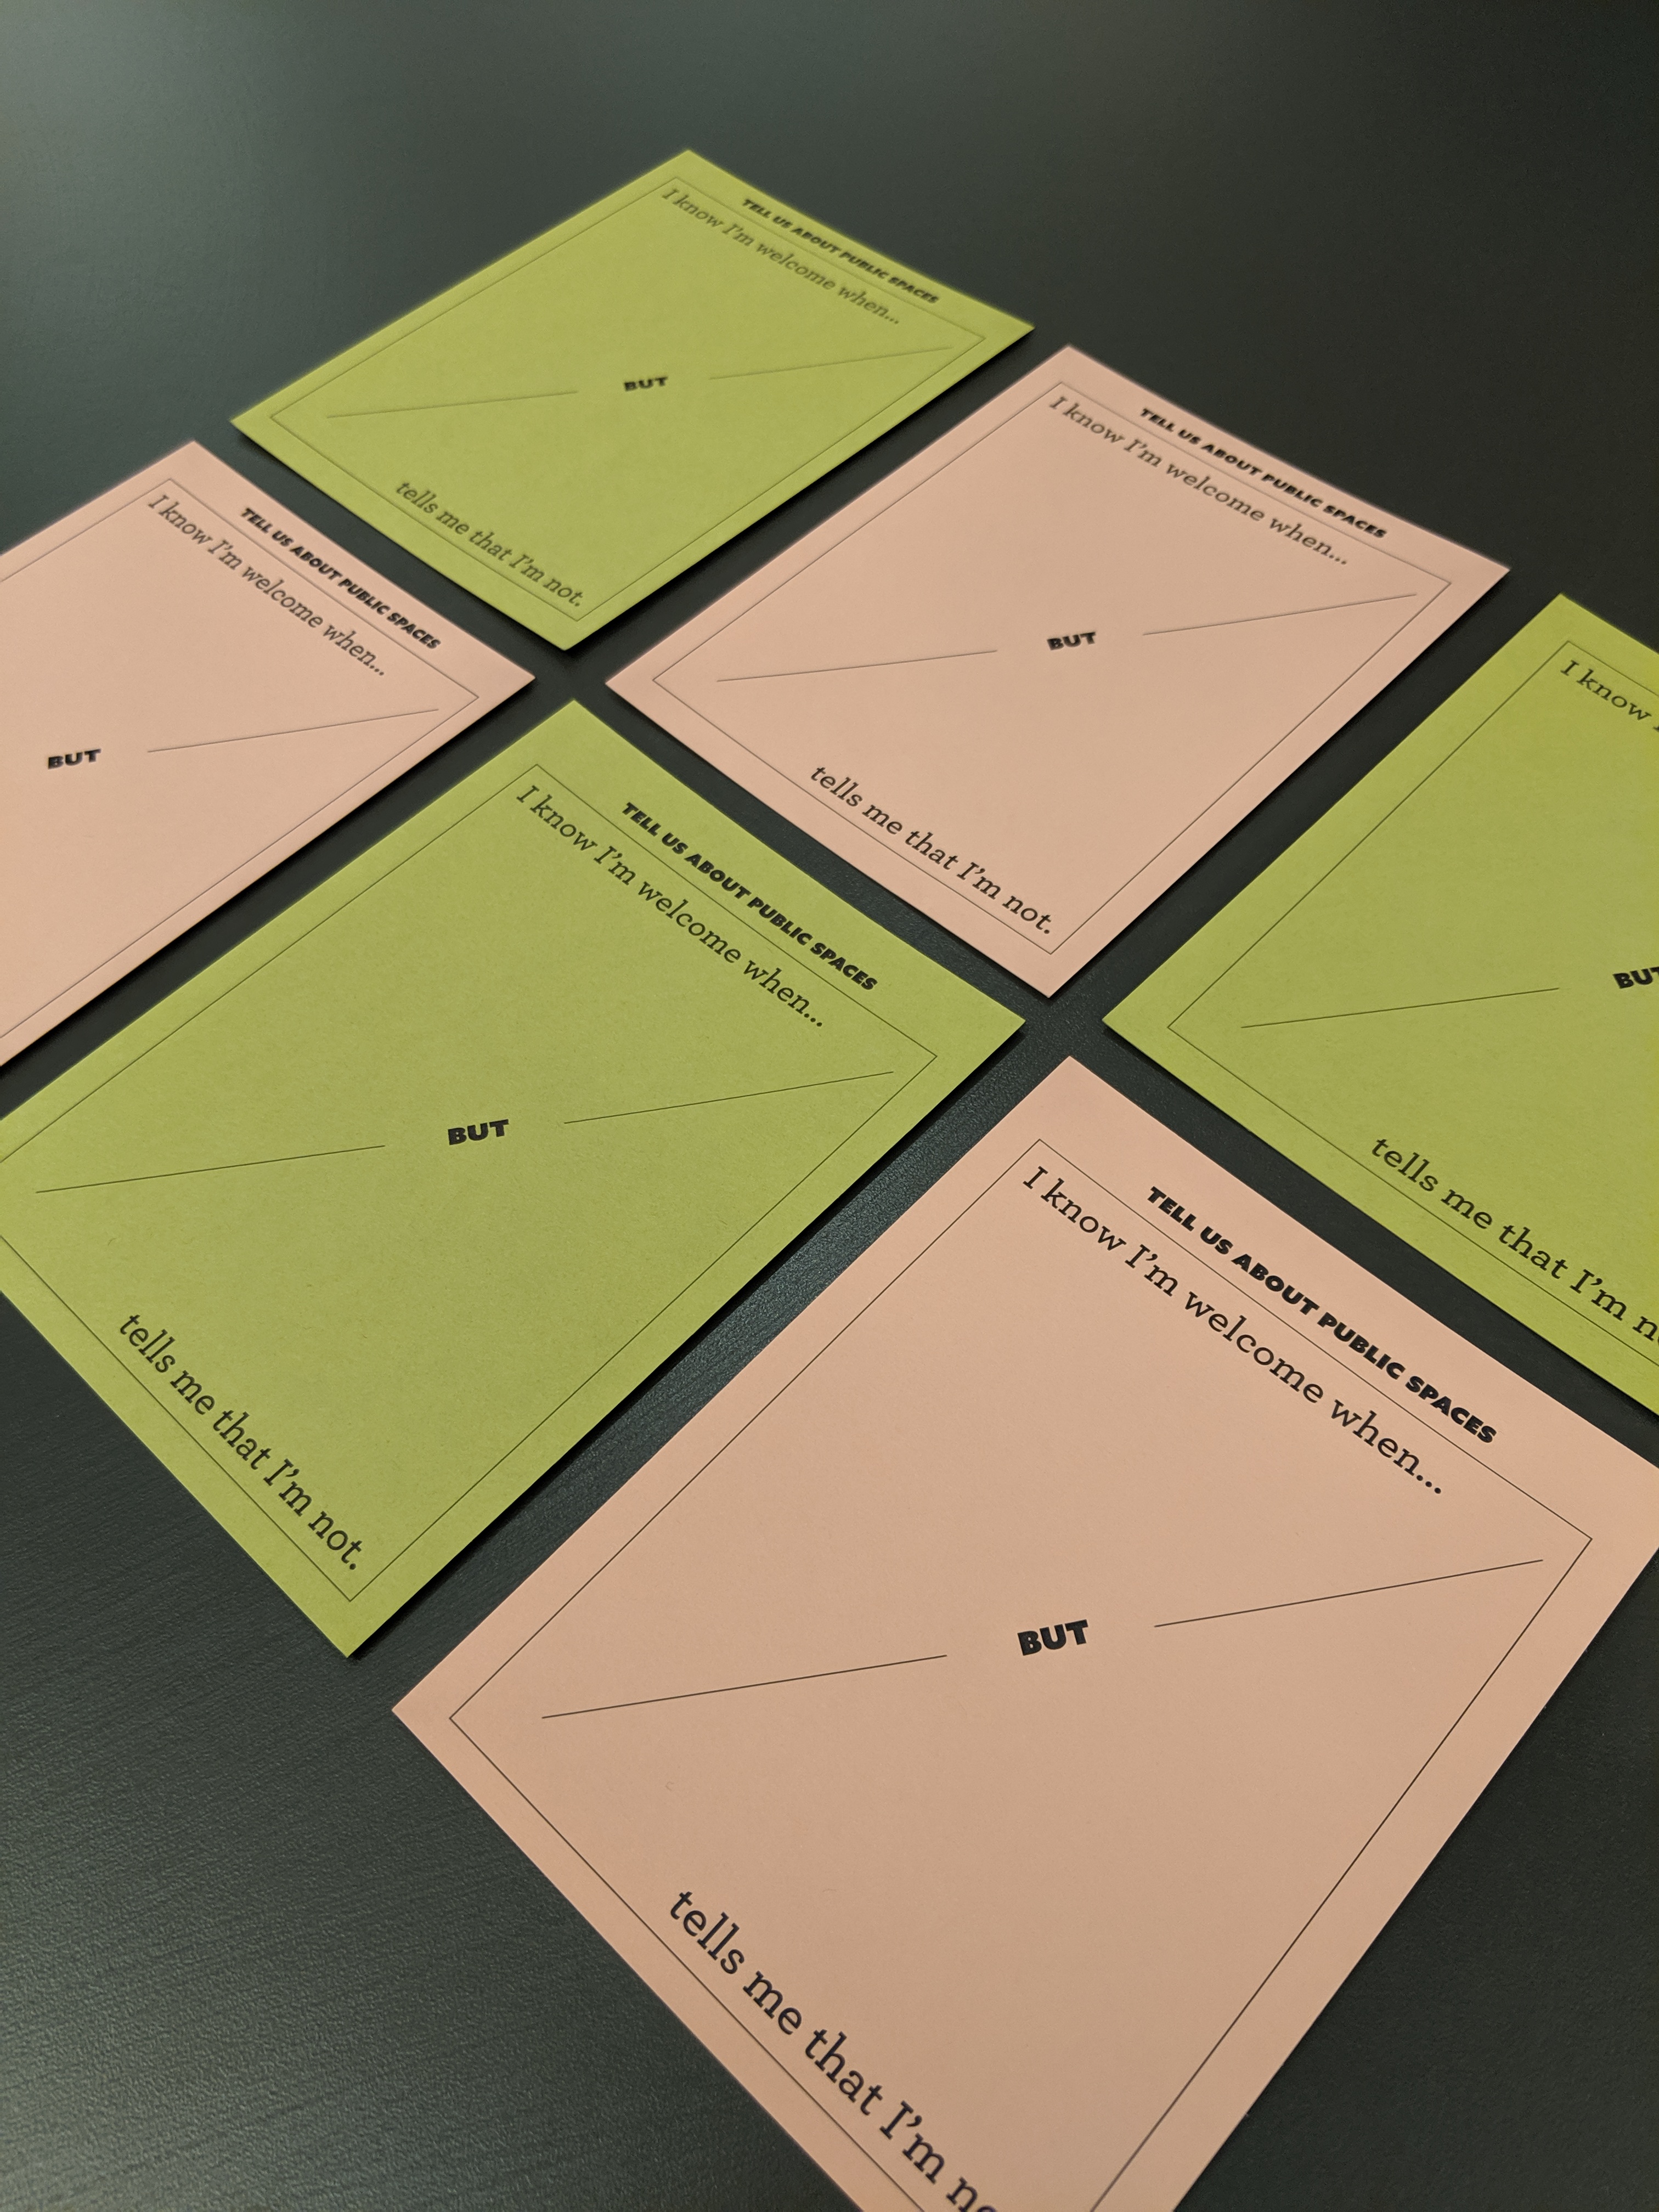


Sponsor & Expert Interviews


Intercept Surveys & Provotype


Parklet Observations

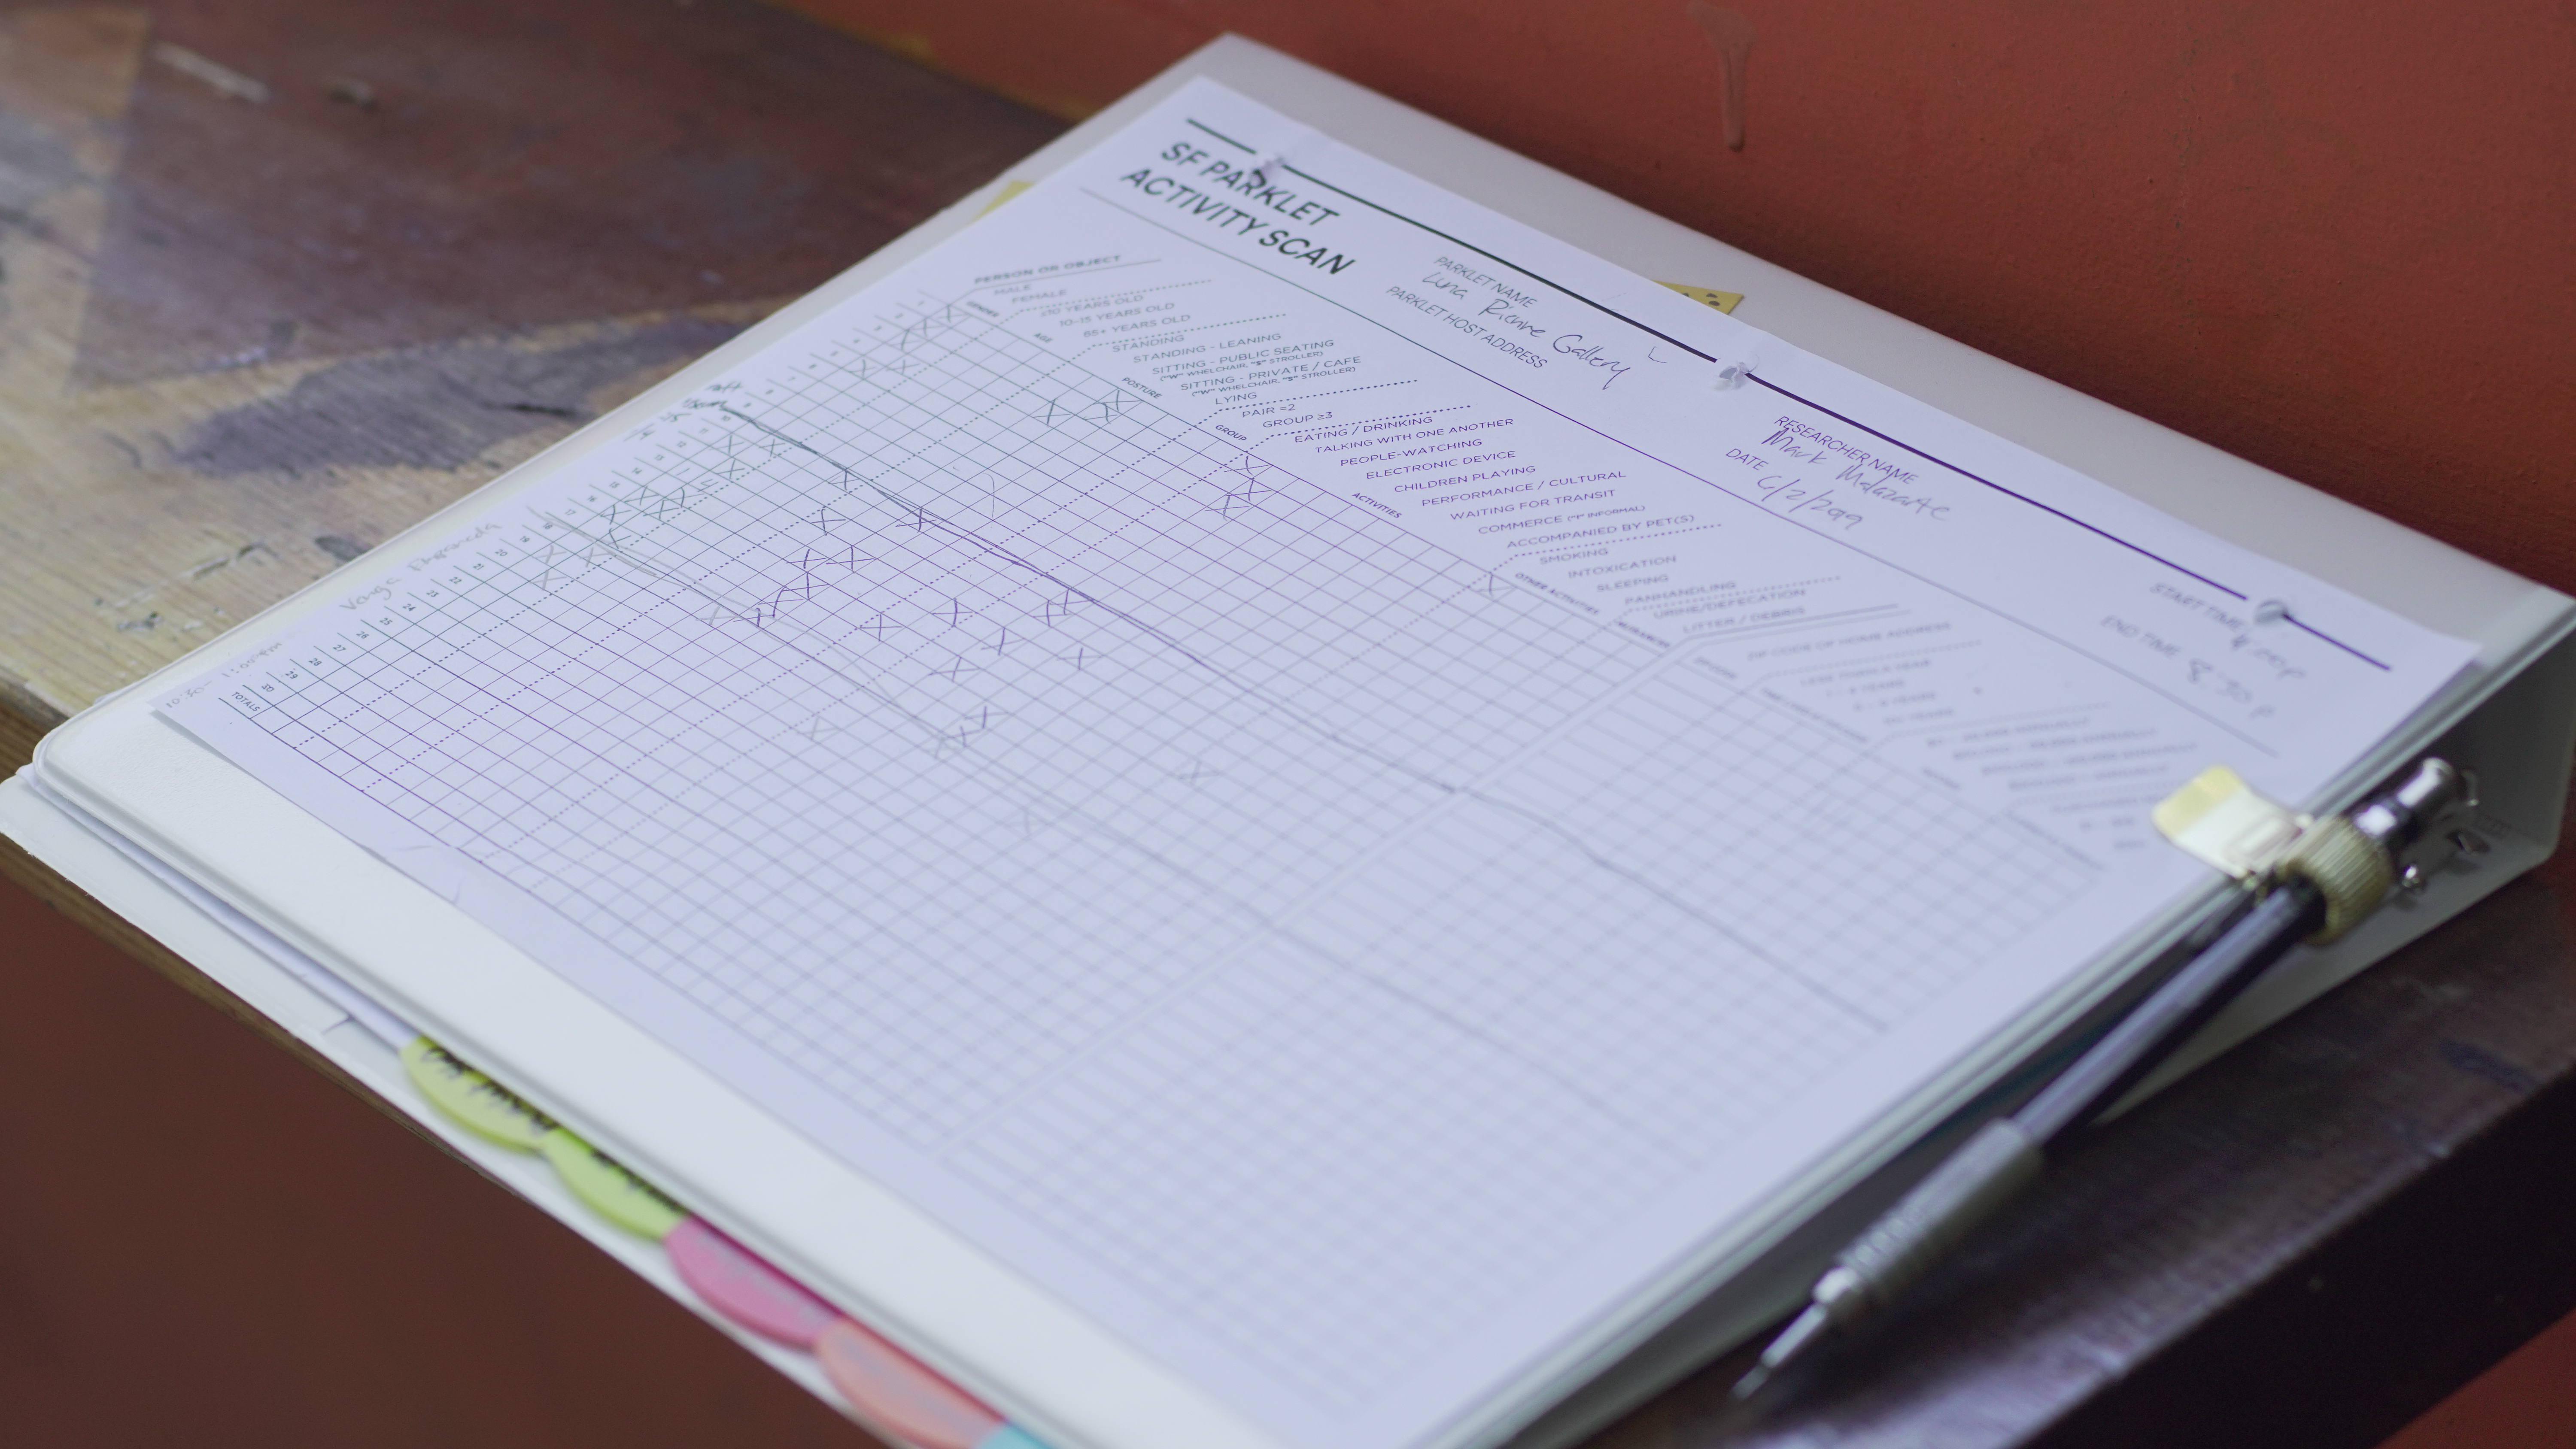

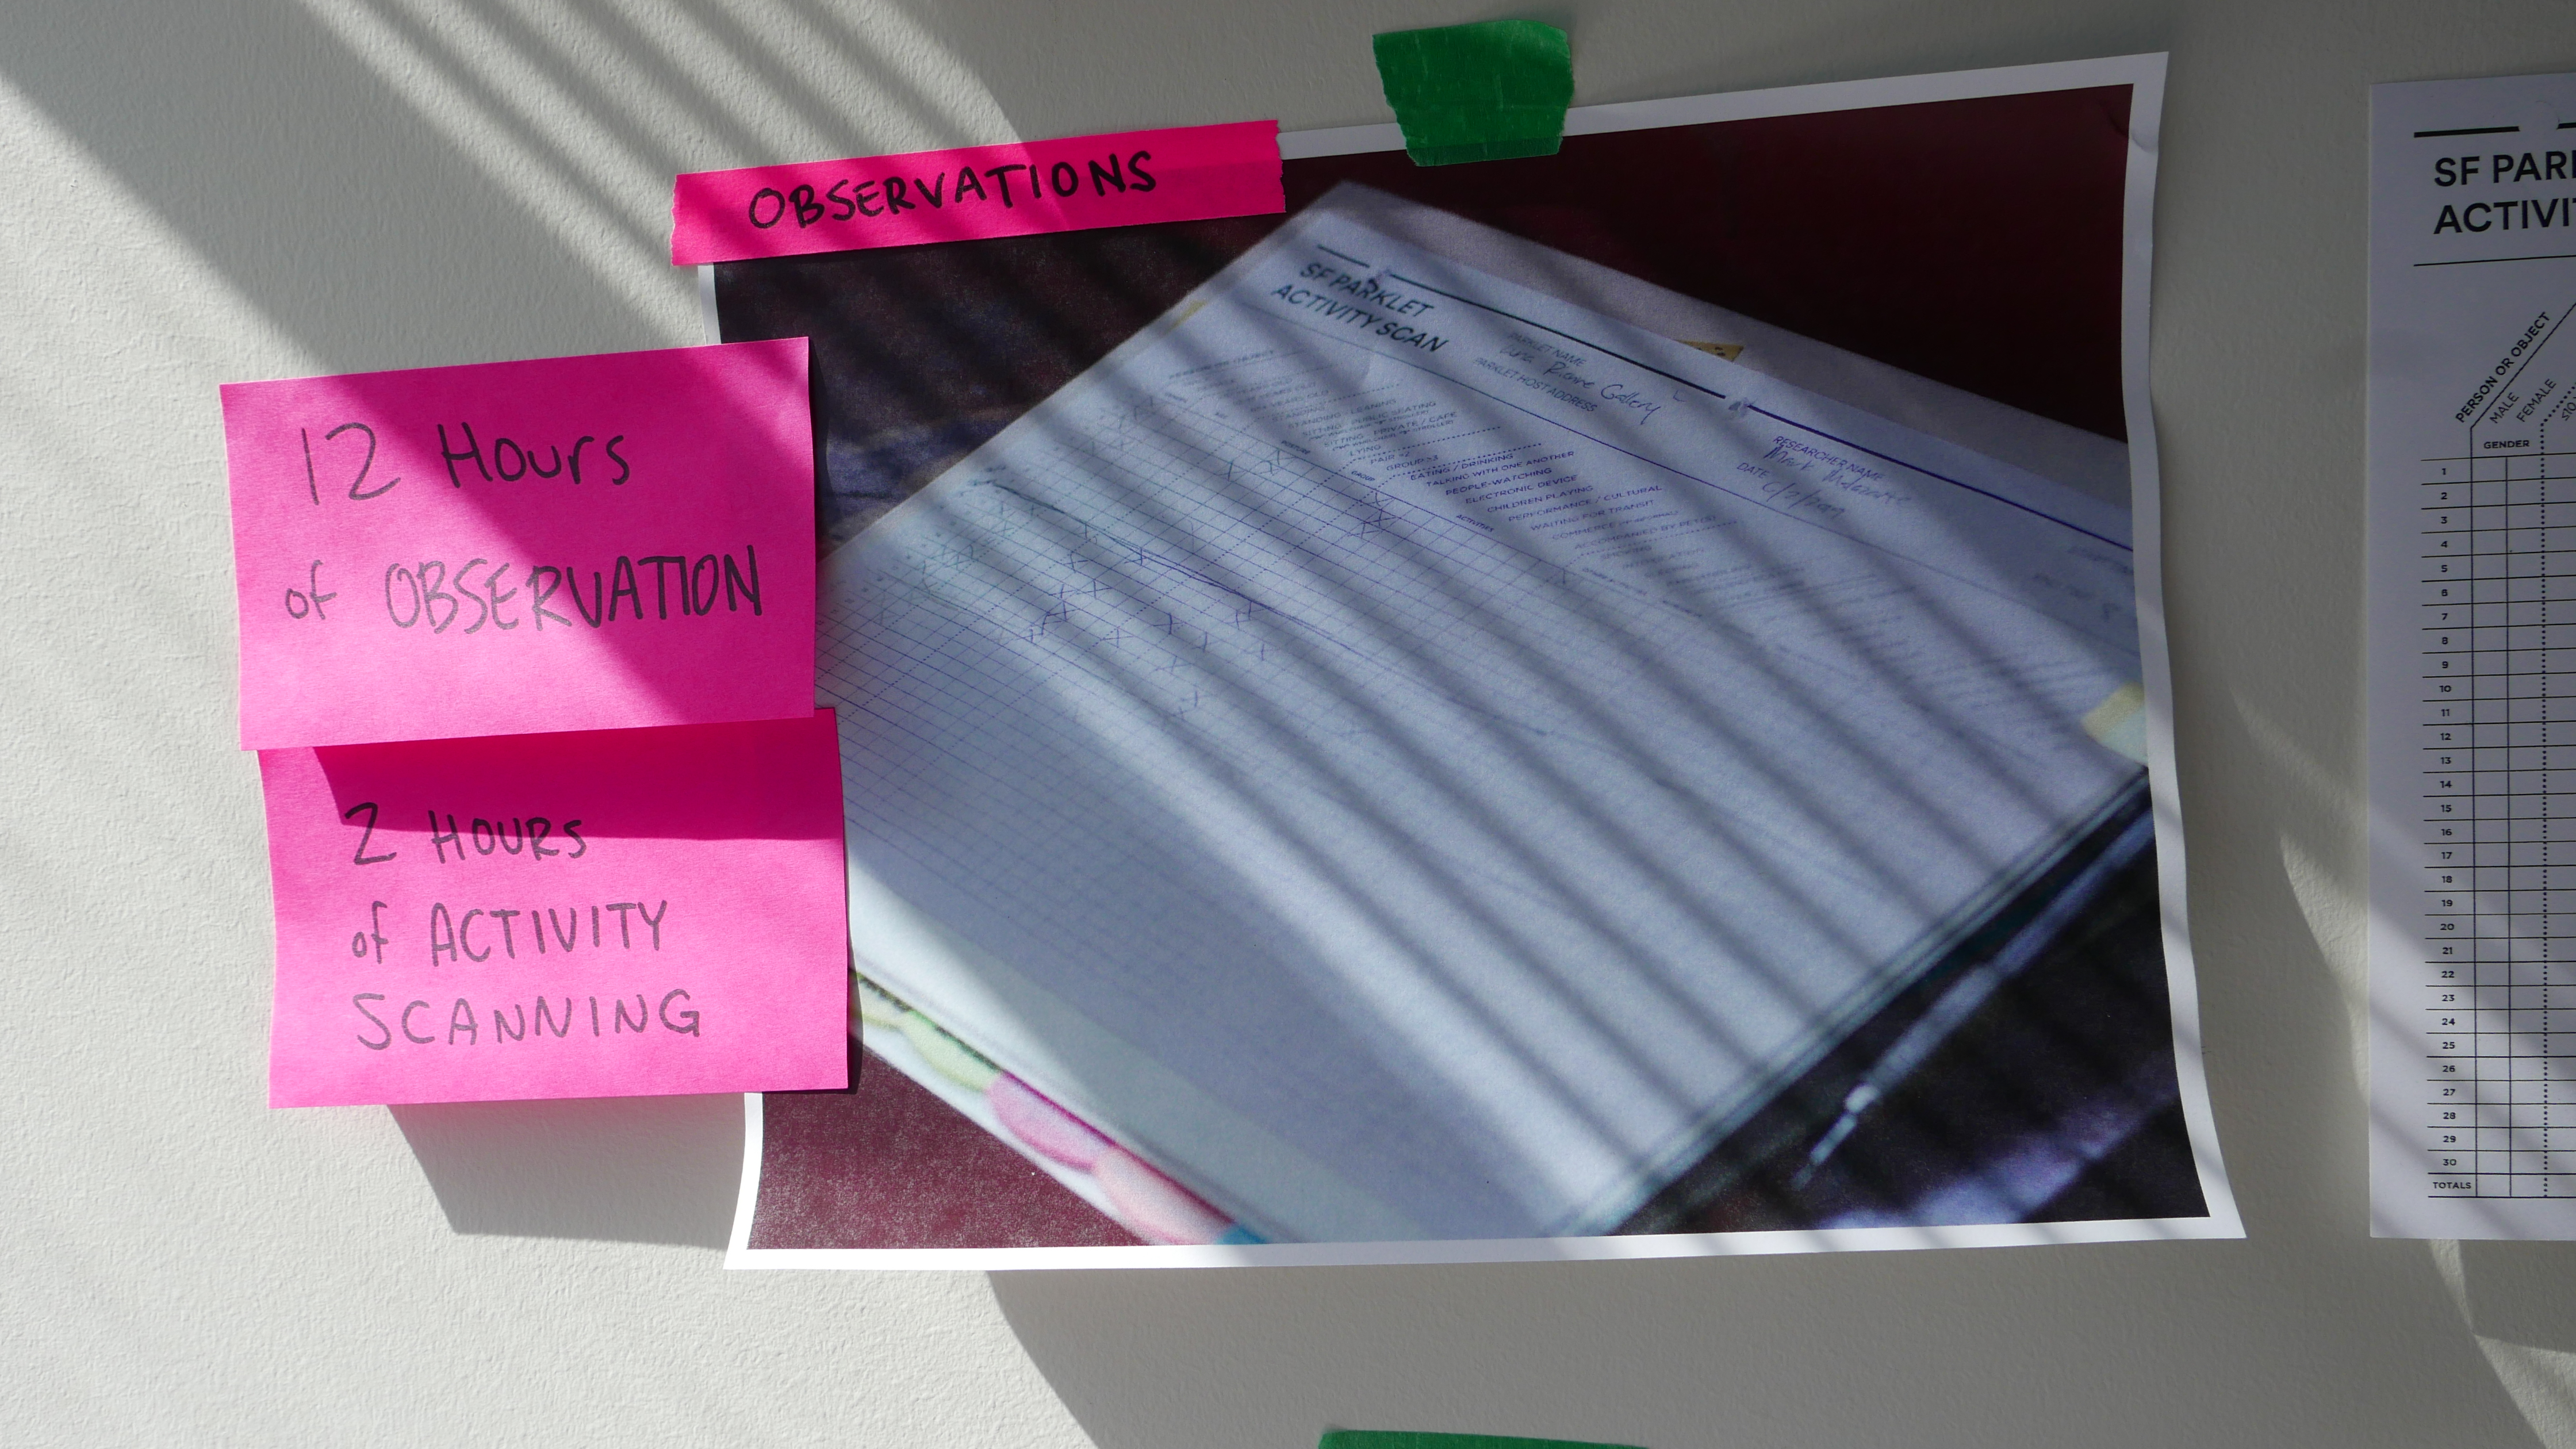
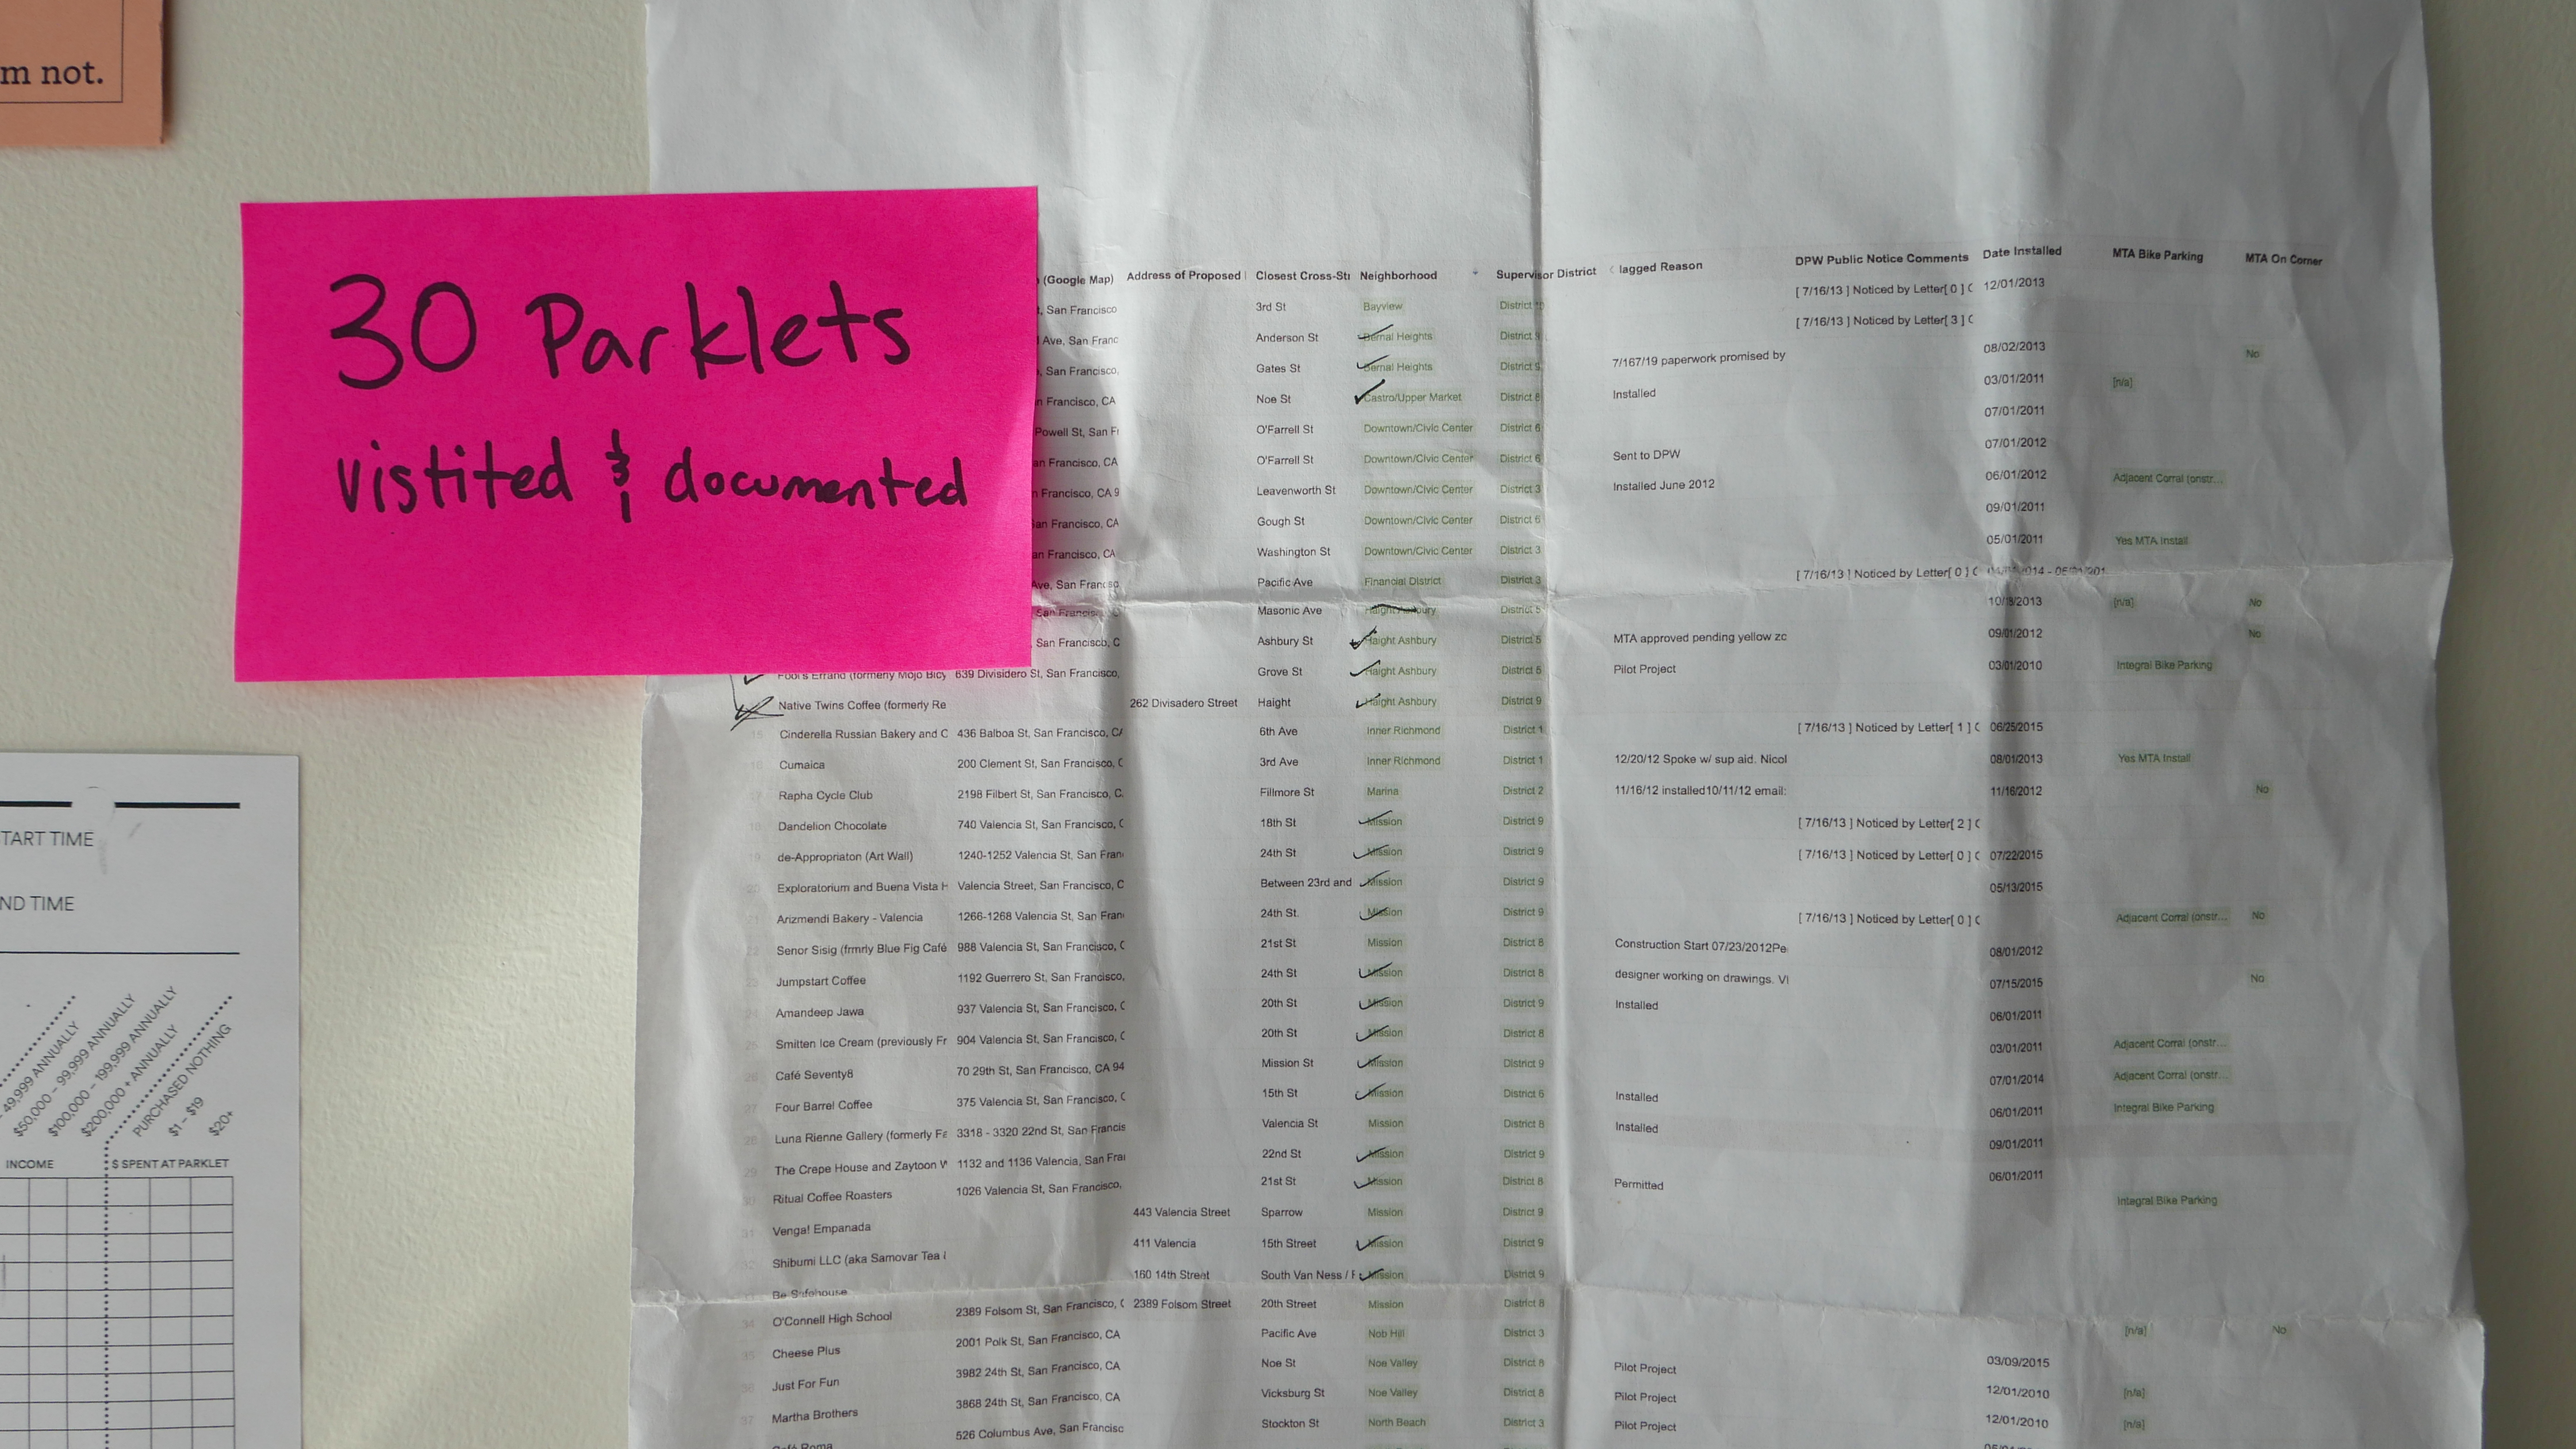
Field Research Notes


Design
Description
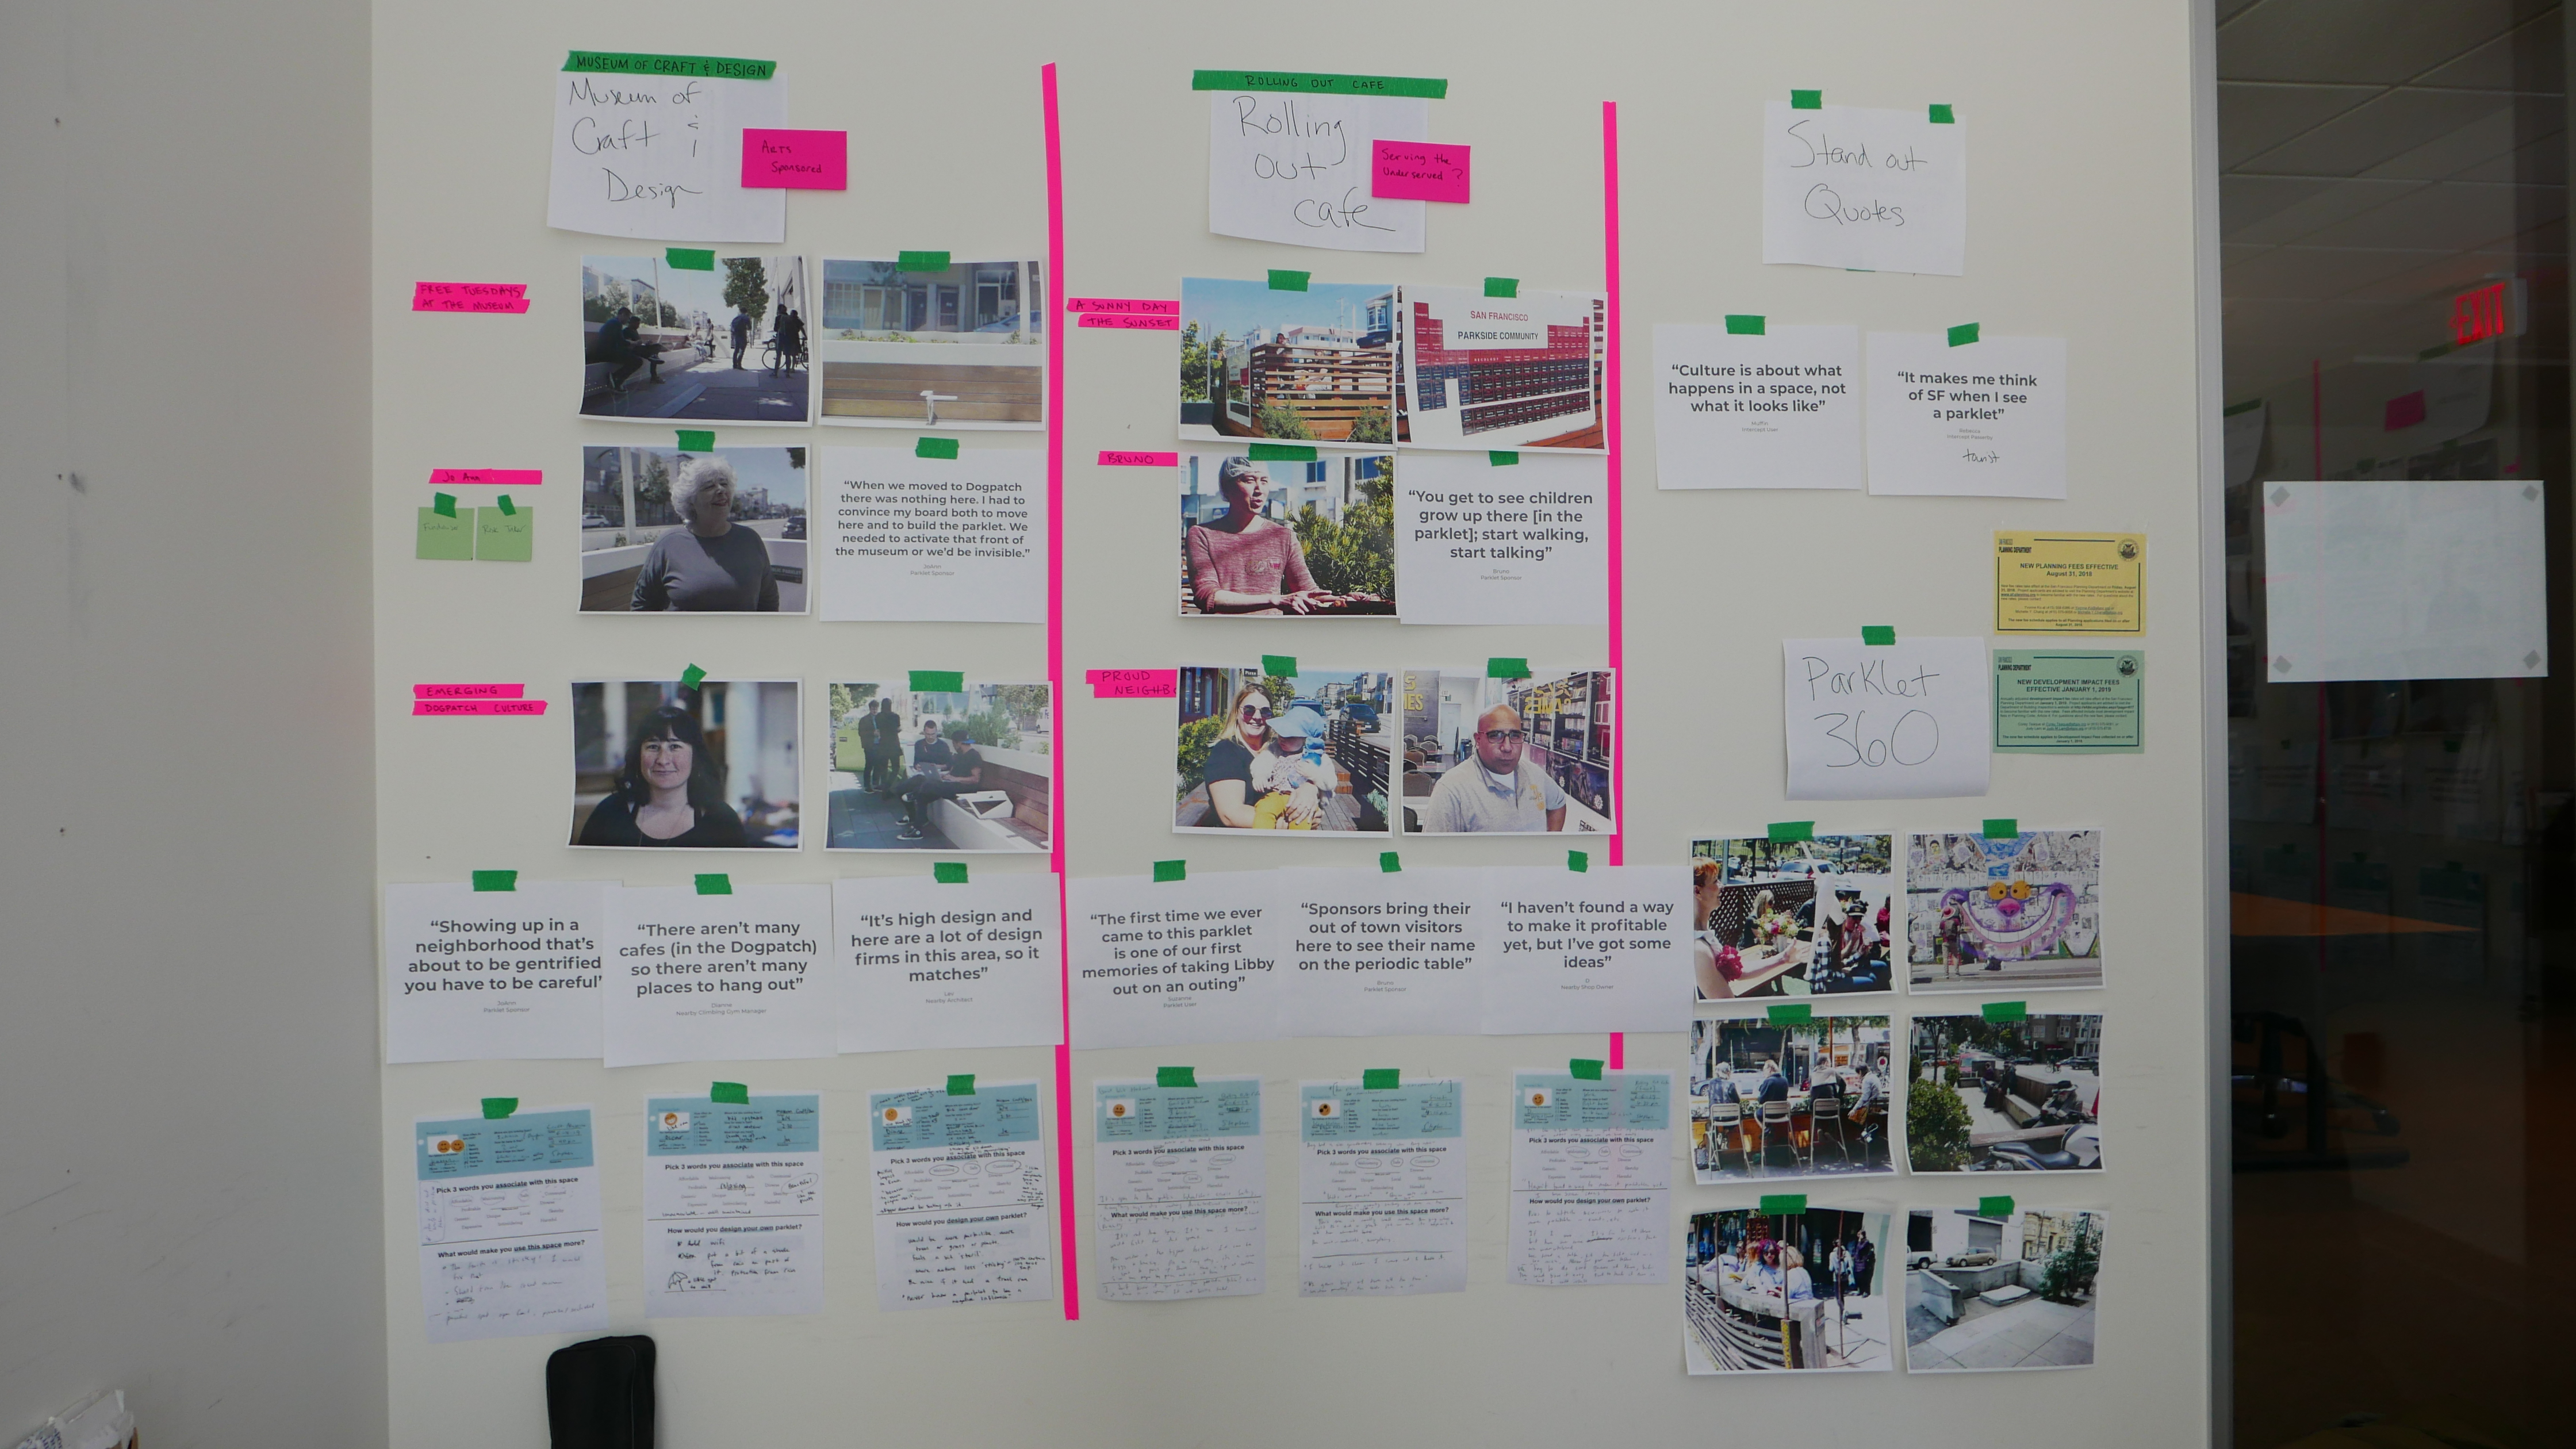
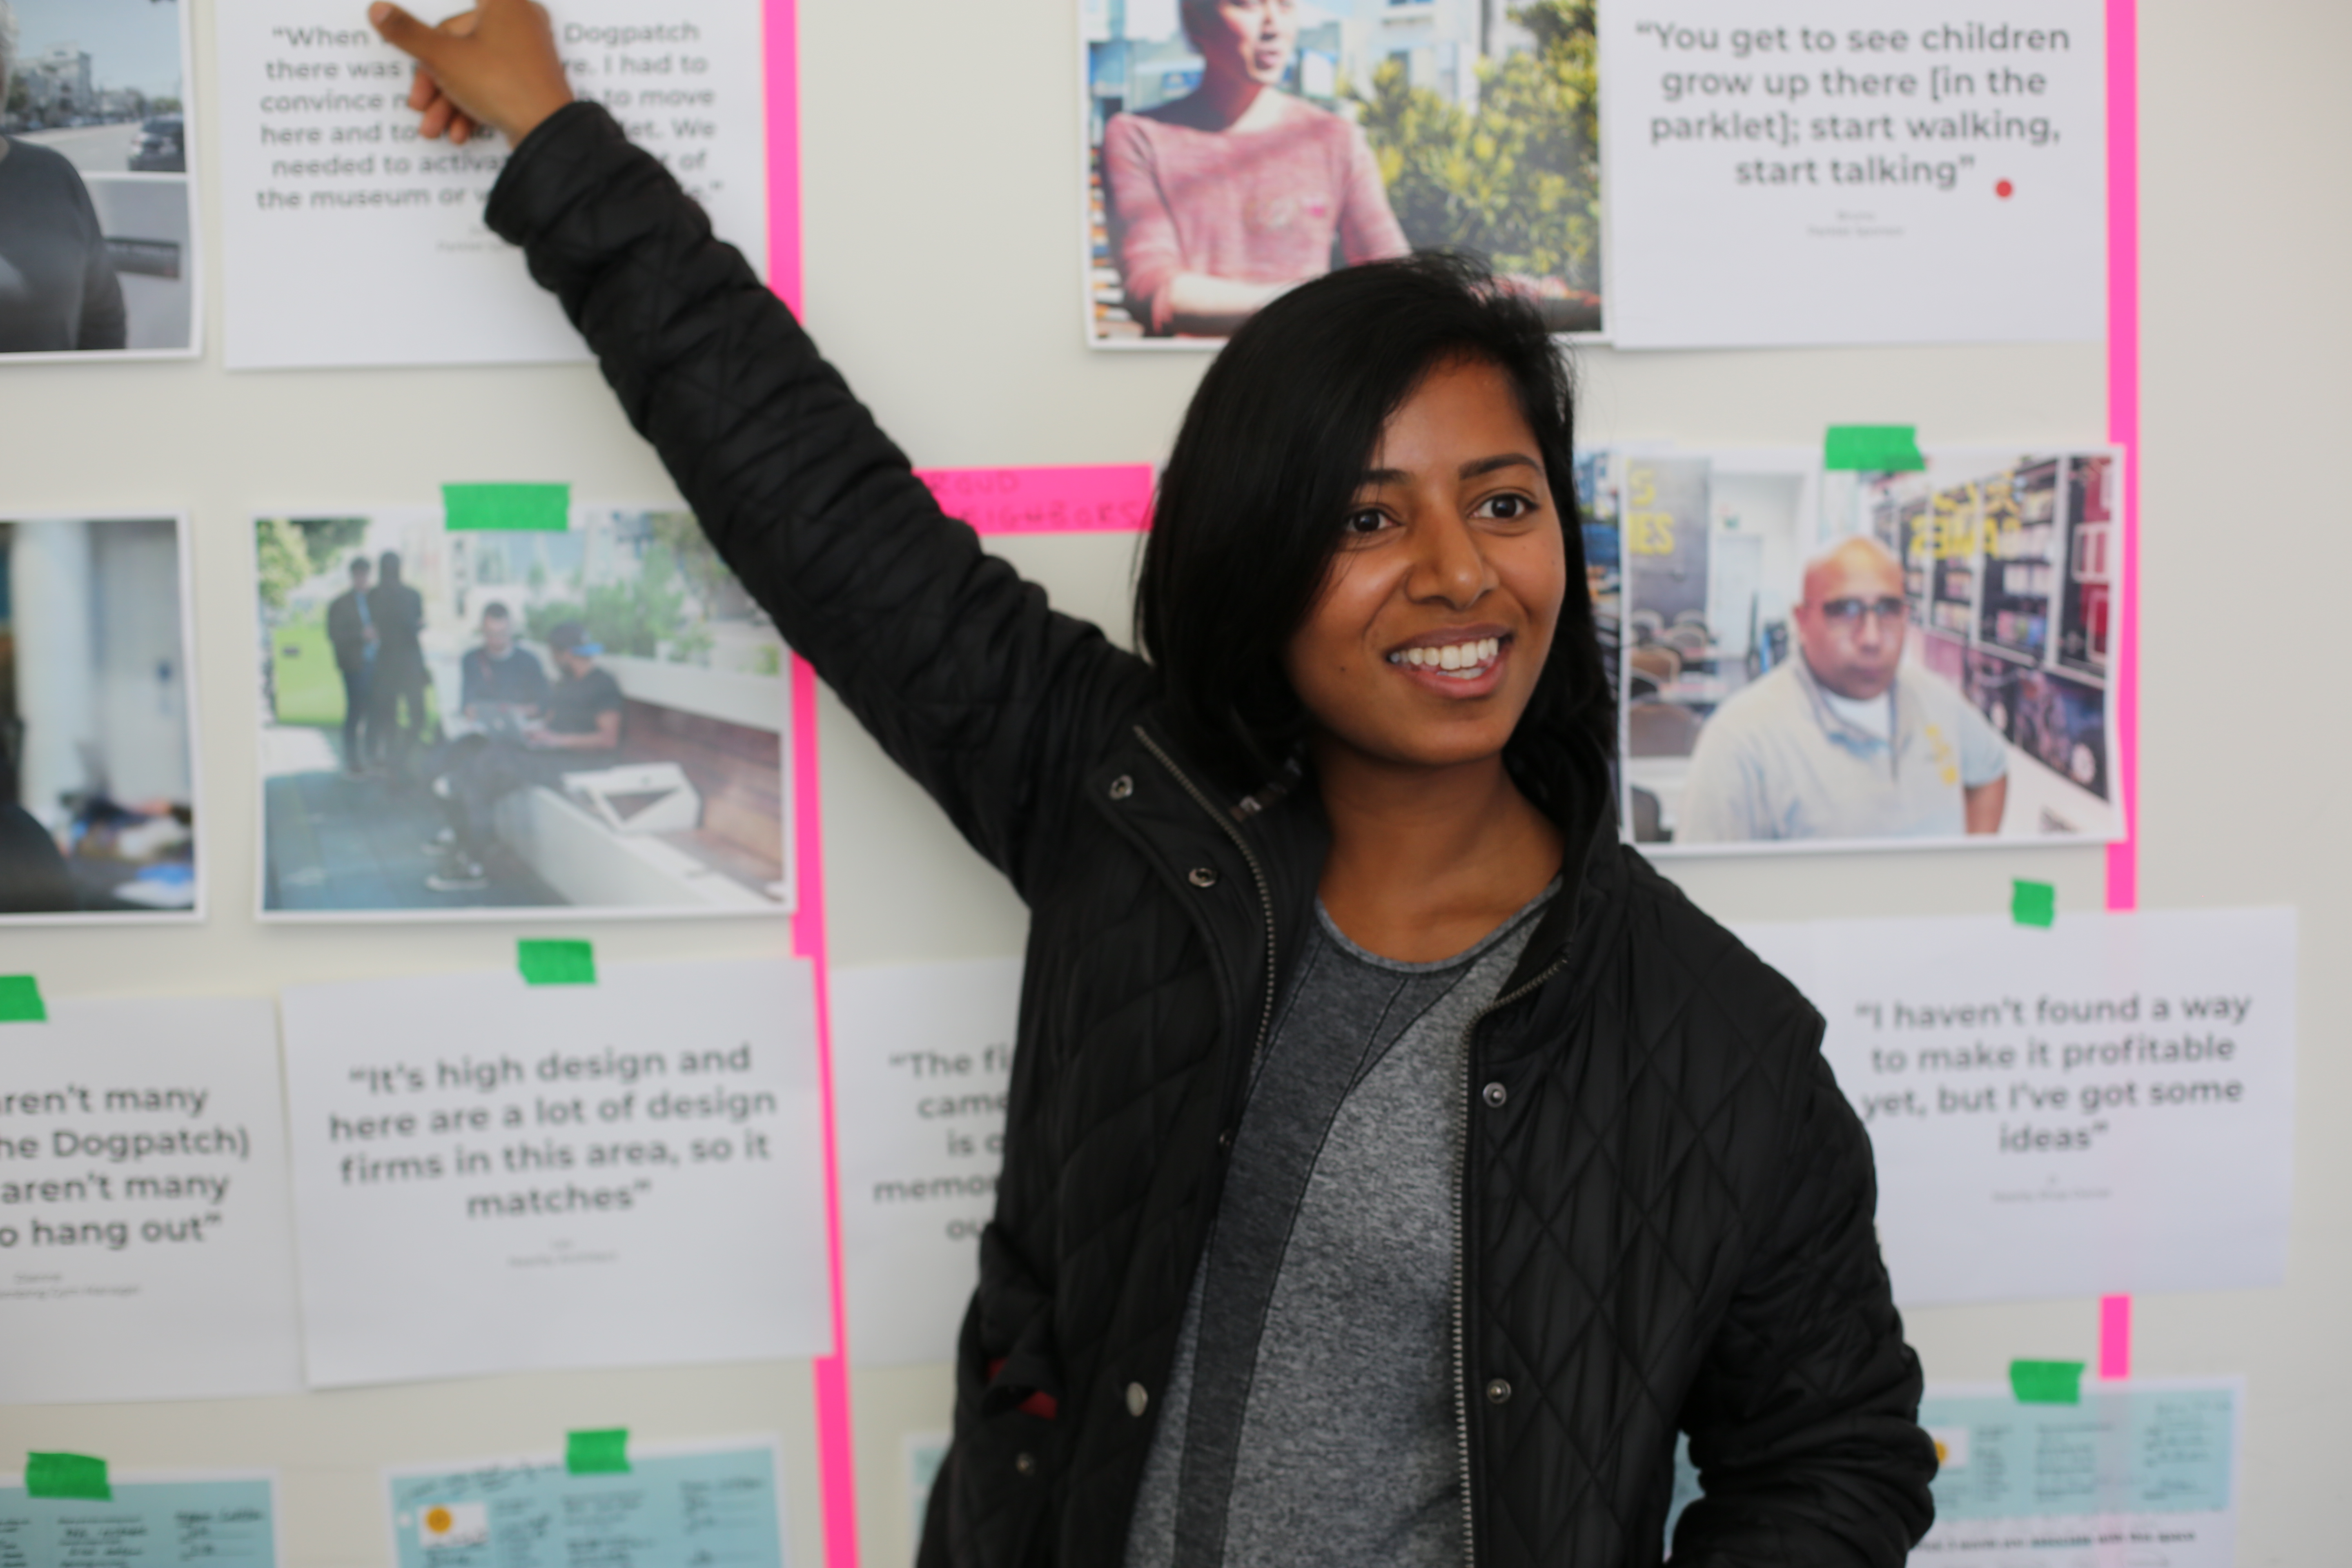
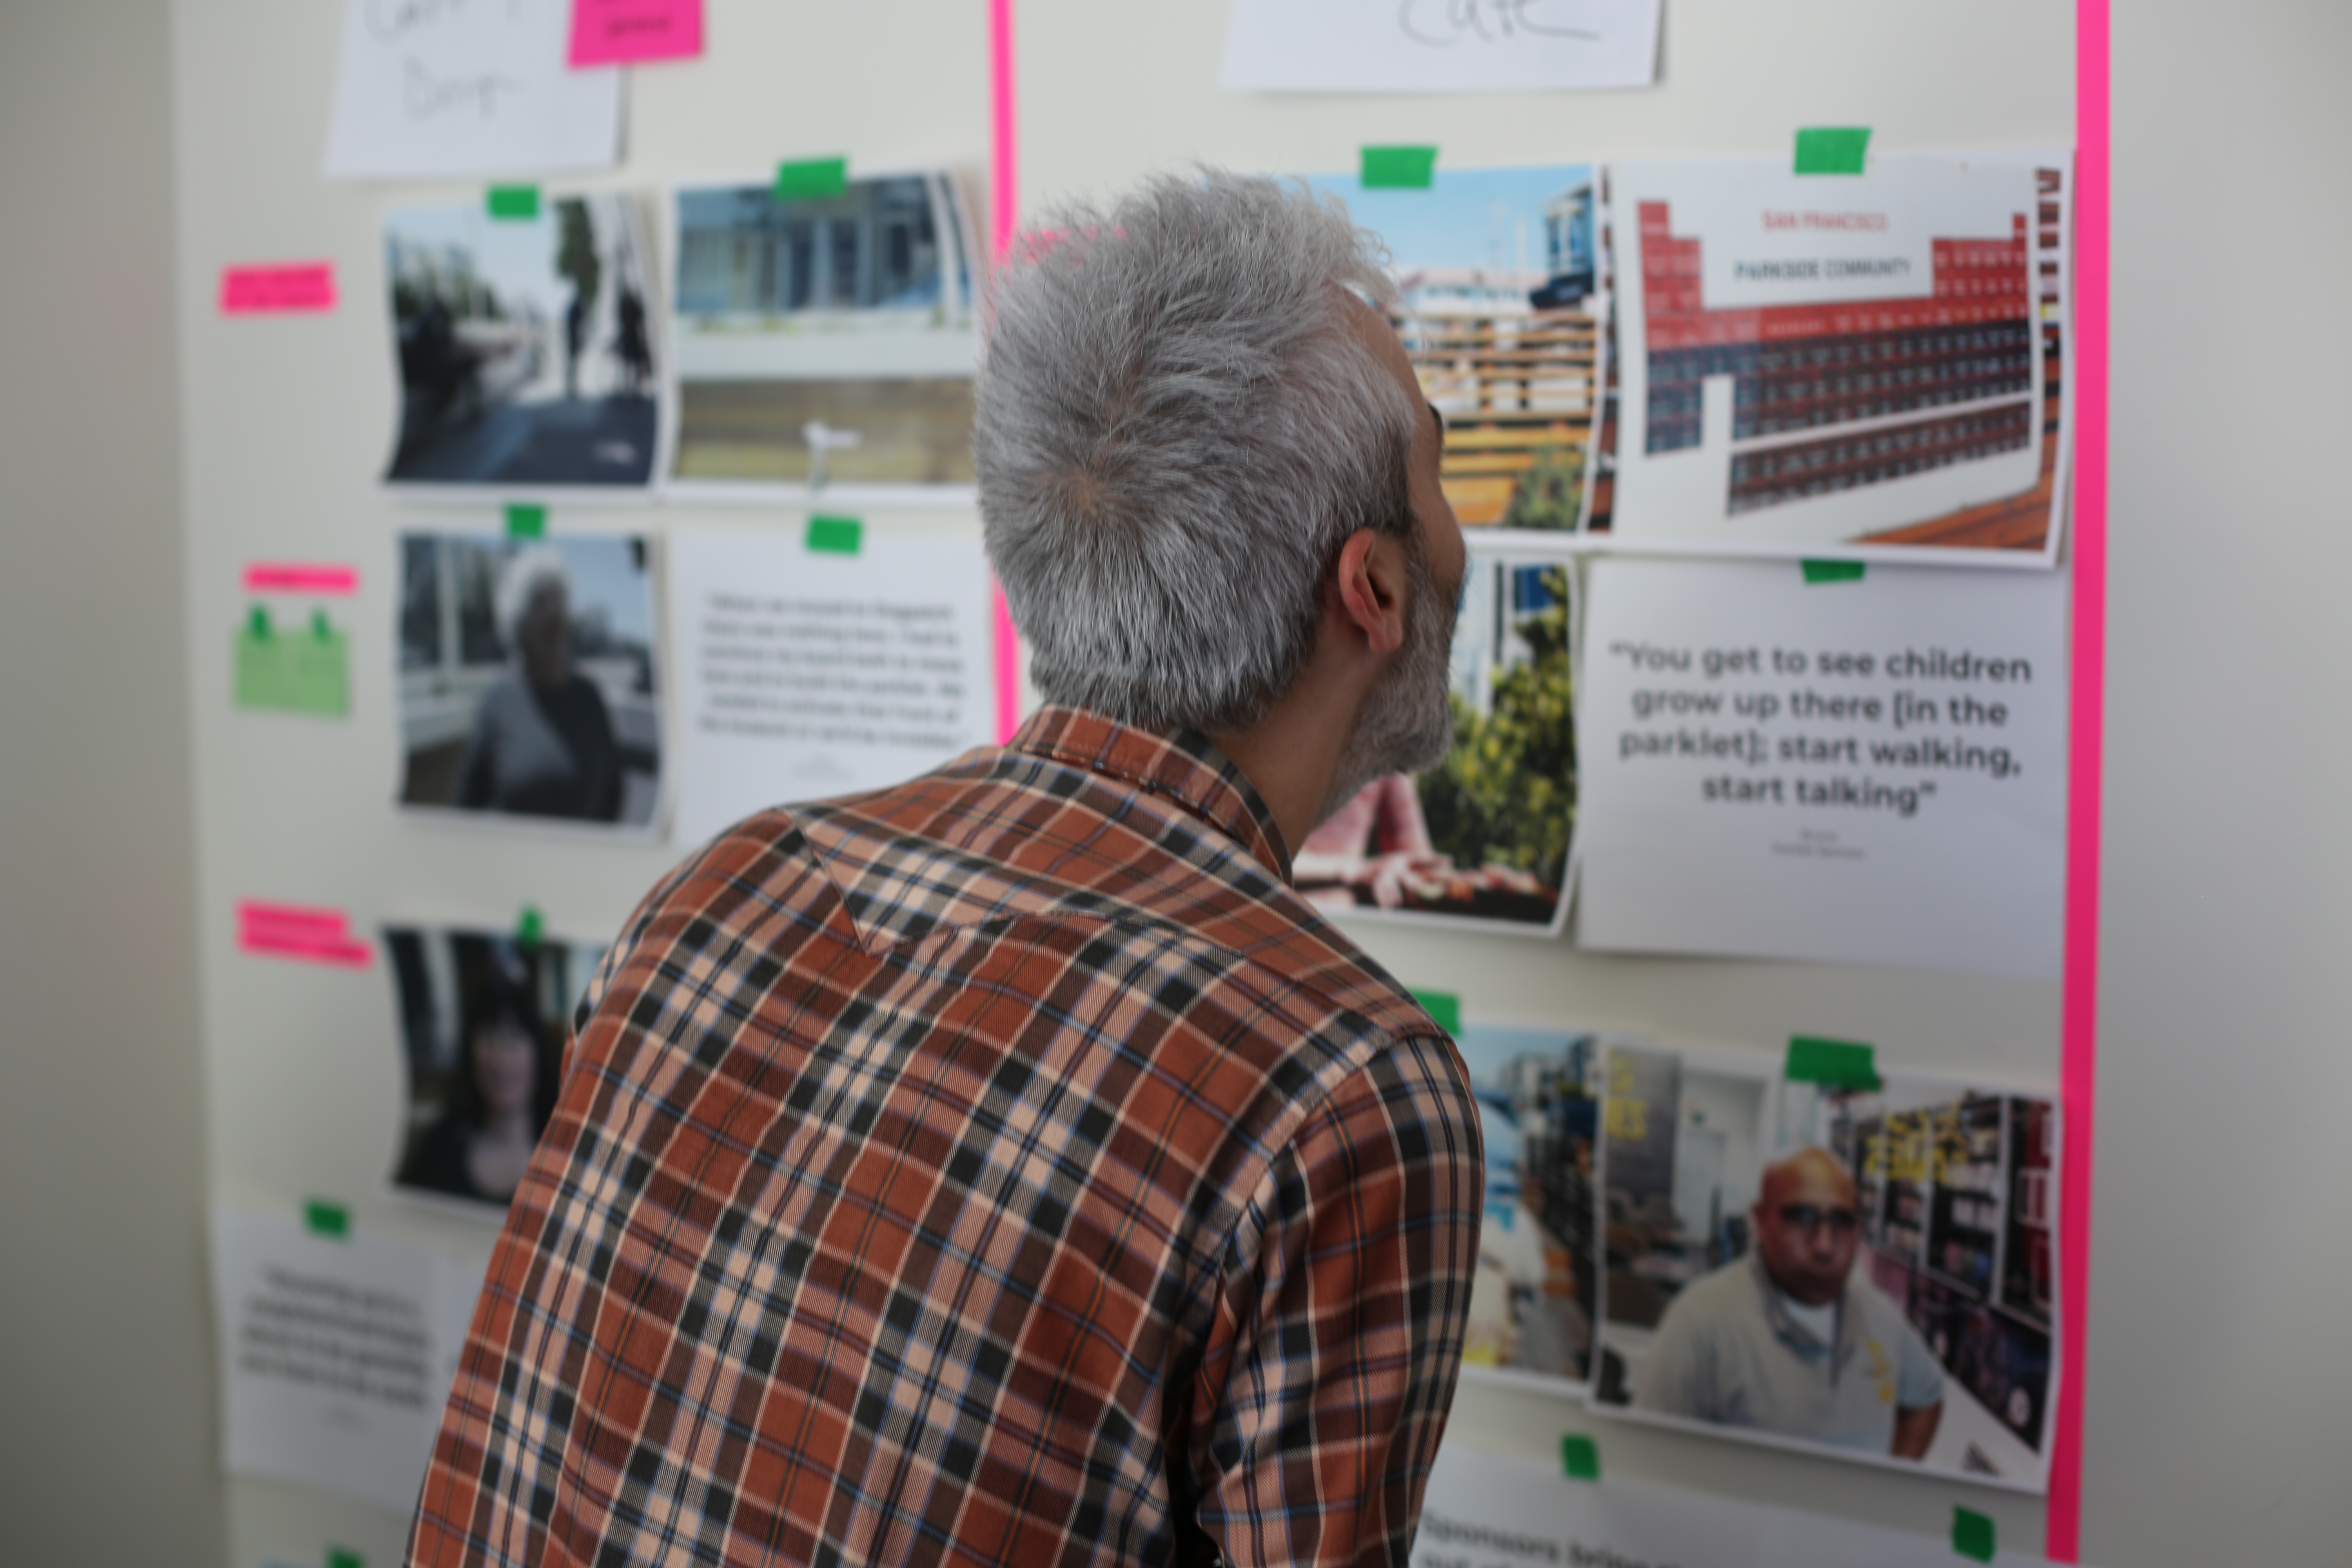
After concluding our weekly stay in San Francisco, the Stae and Openbox team continued to collaborate on what the final output of all our research and data gathering should be.
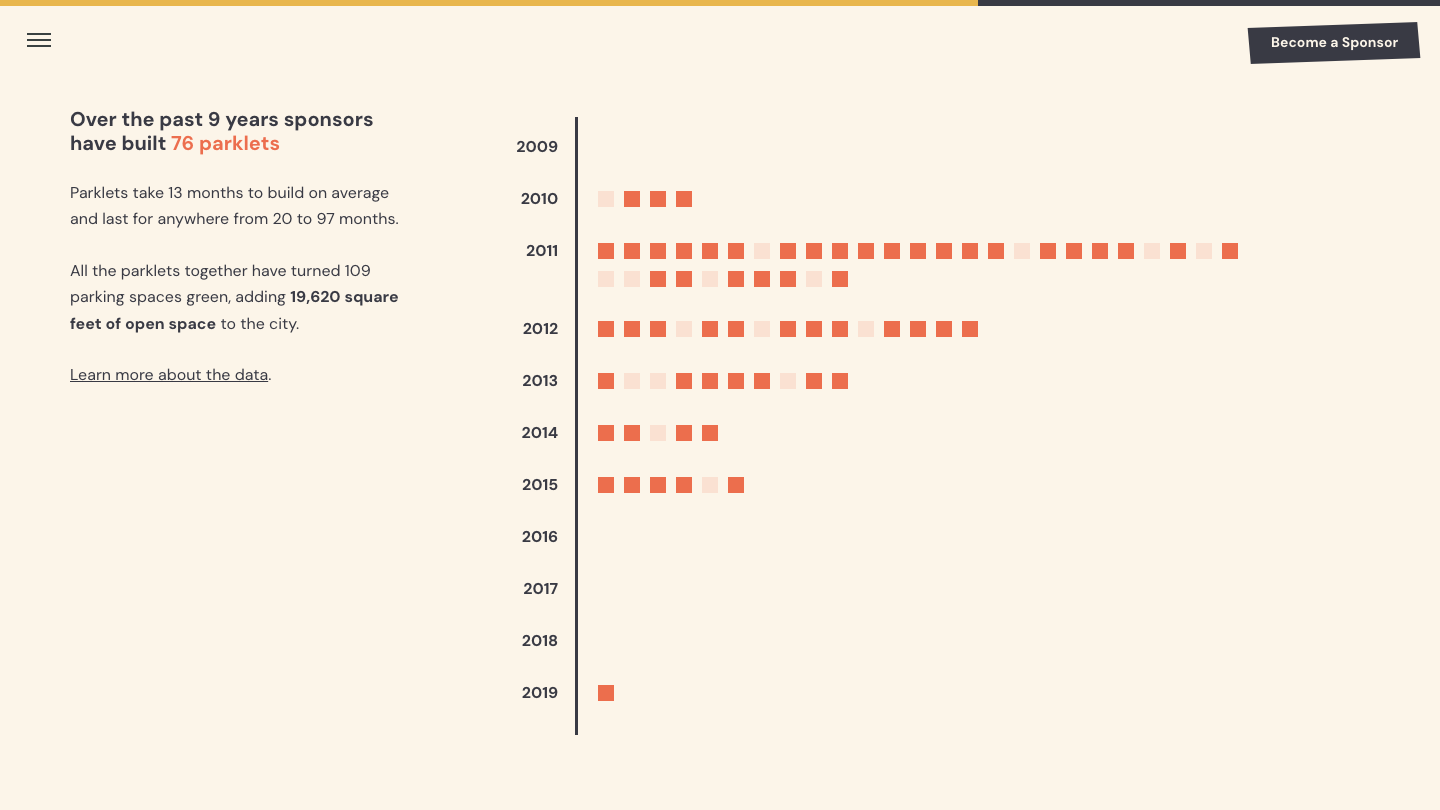
Openbox synthesized all our notes and research into a narrative story structure while Stae analyzed and plotted the data using the open-source map platform Mapbox.
Combined, the two teams, along with input from SF Planning, designed an interactive web experience that combines data trends with quotes and feedback from local residents, and features organizations in neighborhoods outside of the areas traditionally associated with parklets.
Responsibilities
- Data Visualizations
- Wireframes
- Visual Design
Visualizing Data
“Data itself needs to be designed. There’s so much data that people need to know what they can do with it and how it can help them. As human-centered designers, we need to design the data experience so that anyone can easily access and interpret their city’s data to answer a question or provide evidence for an idea they want to advocate for.”
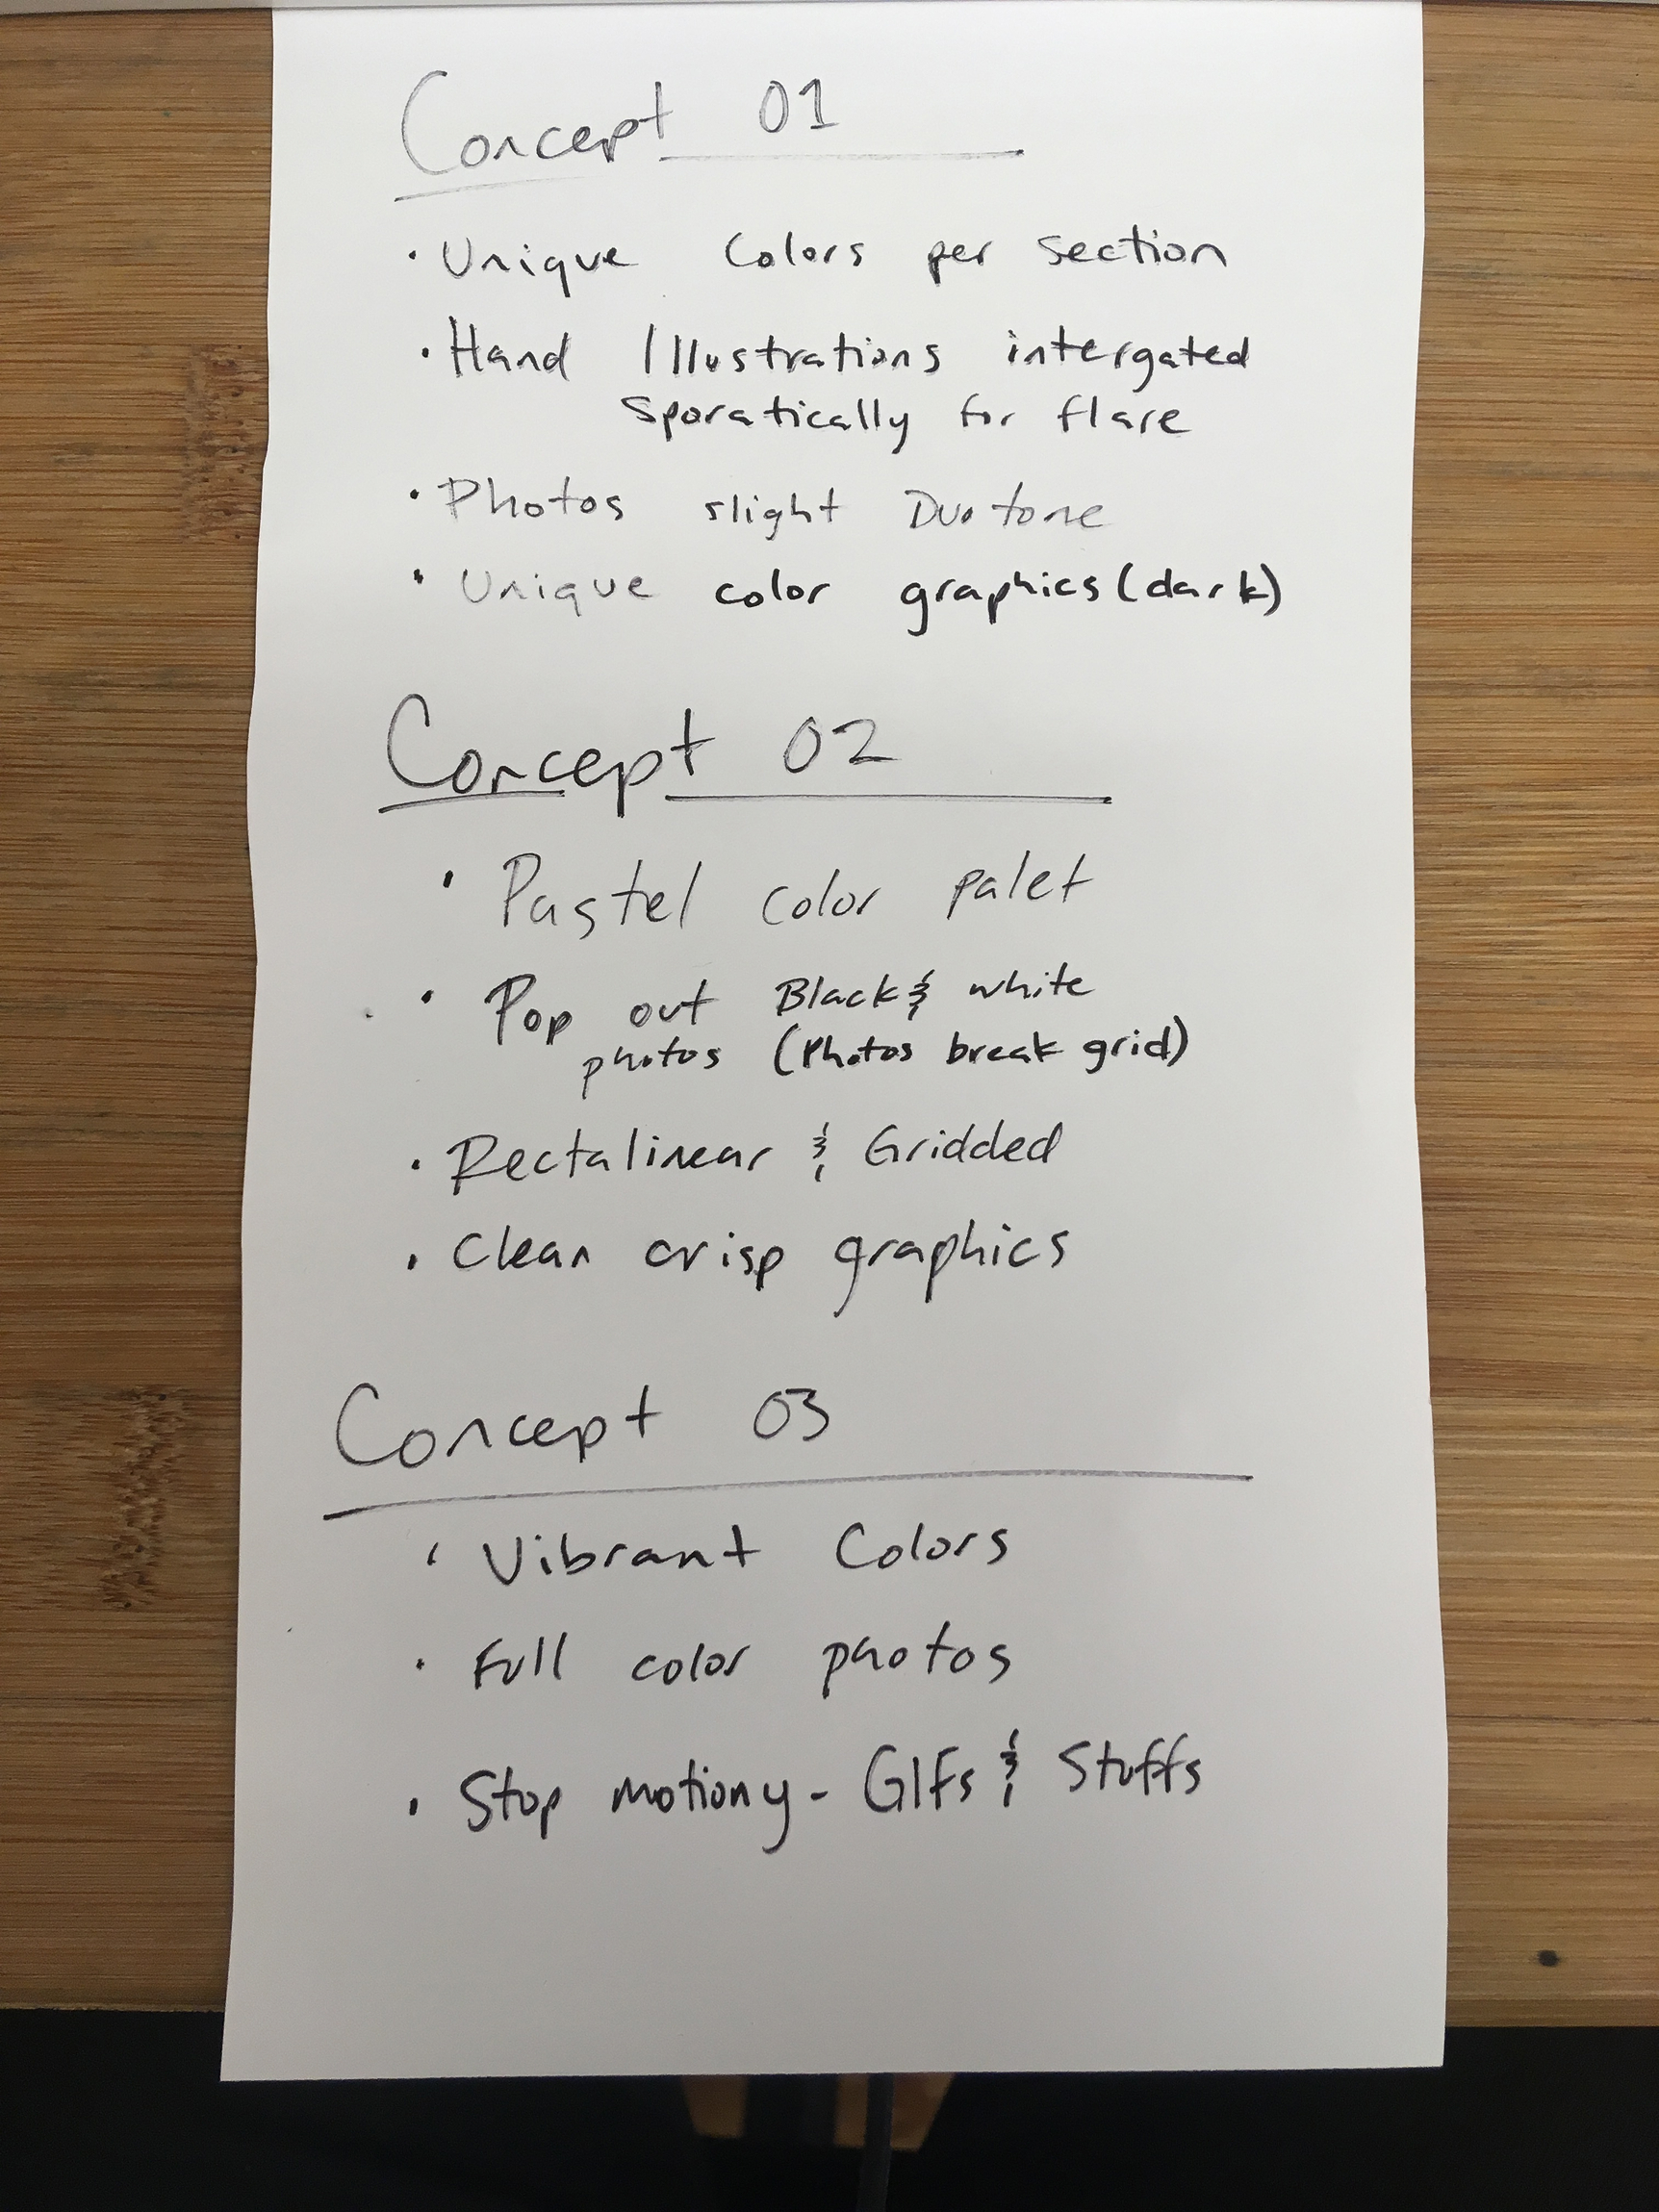
Initial Concepts


Wireframes


Navigation

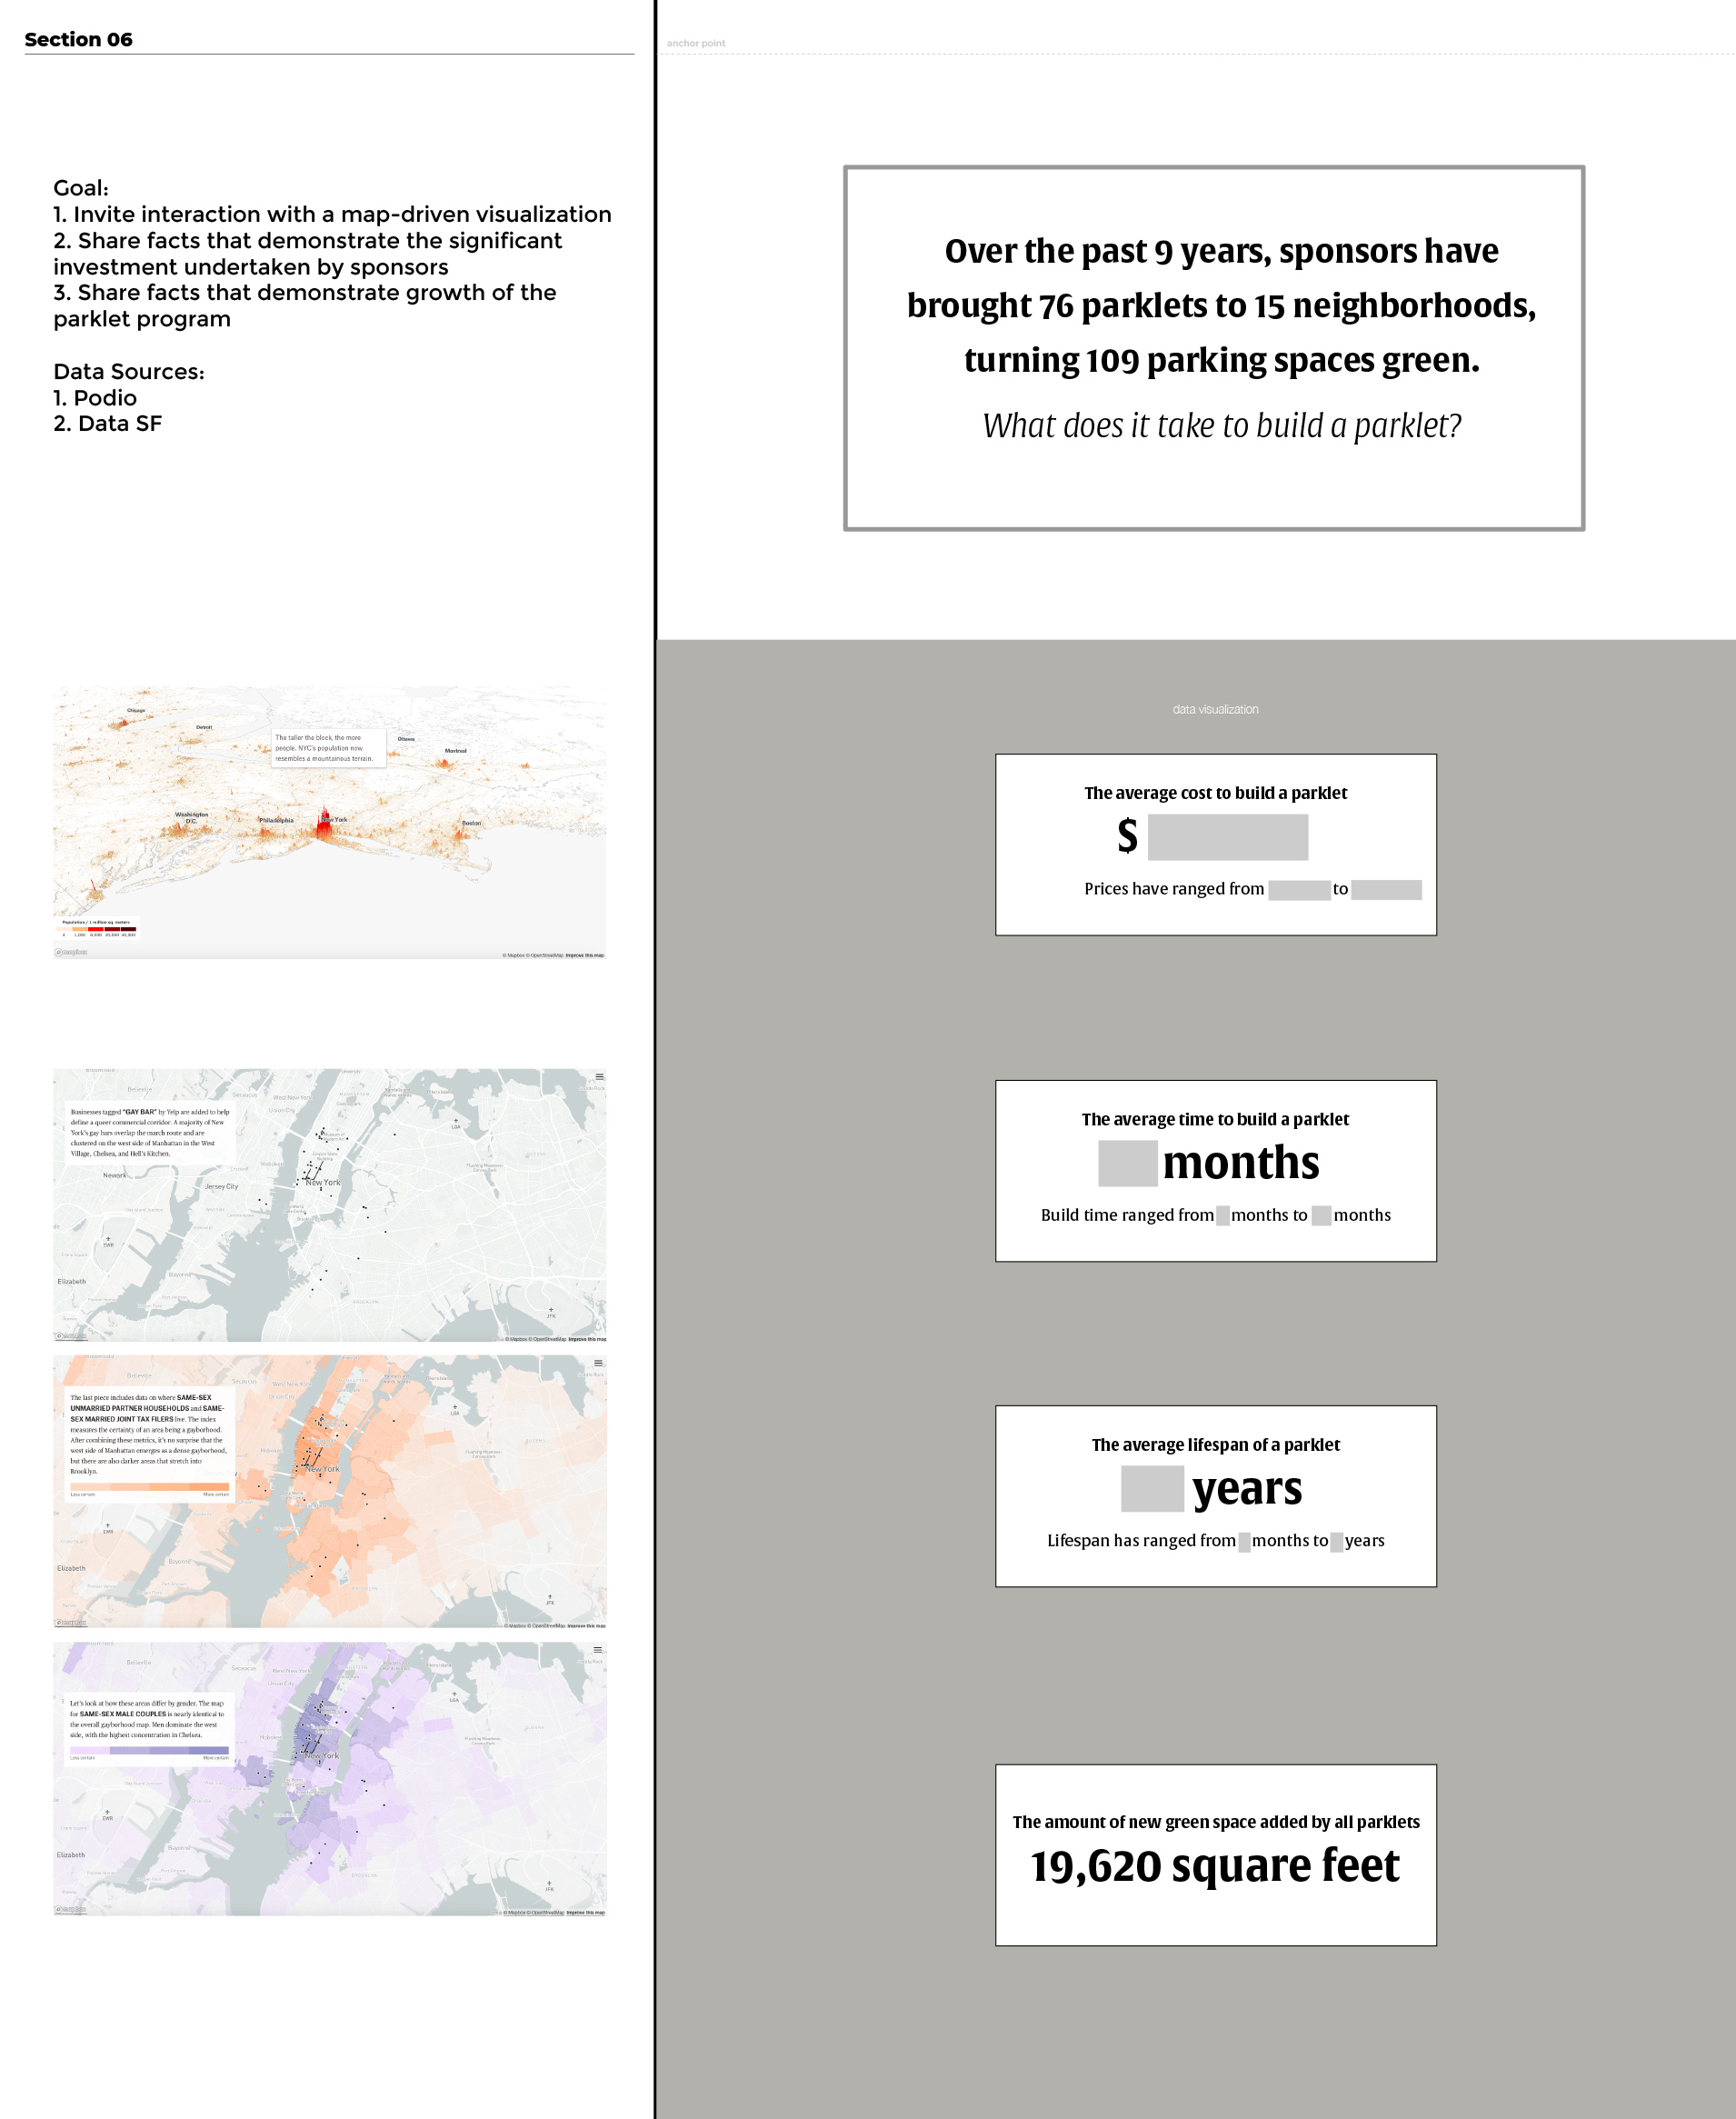
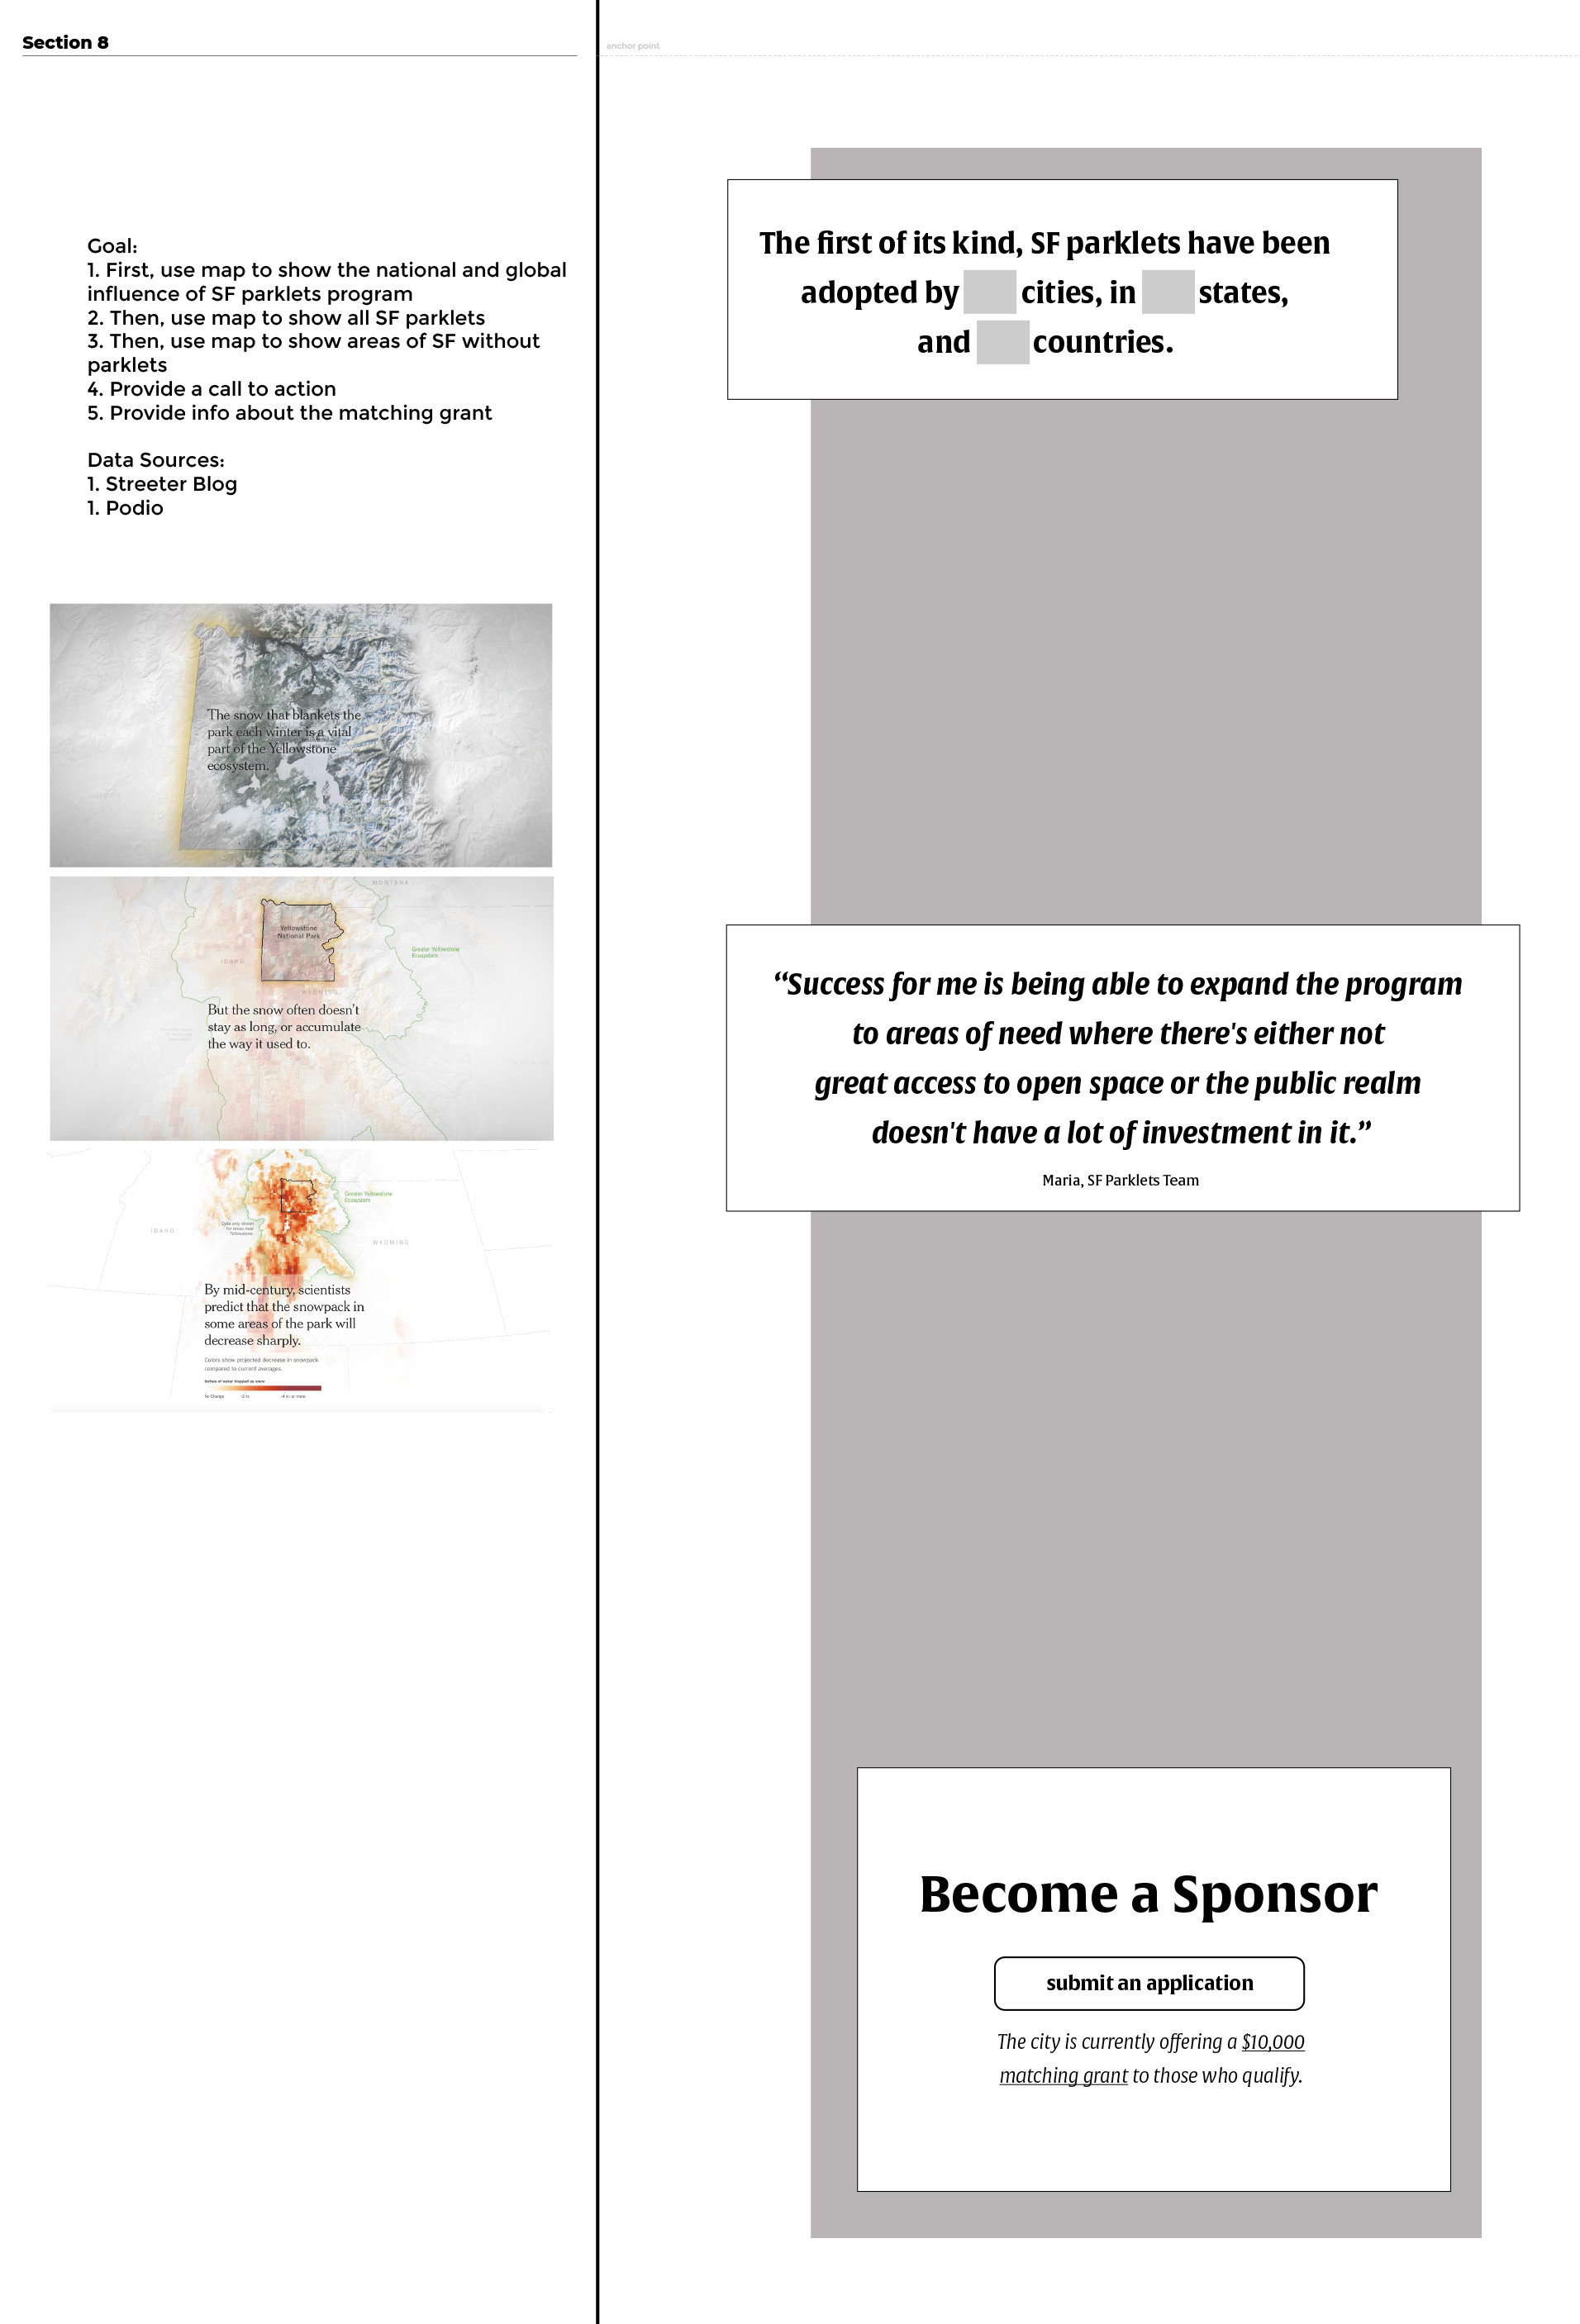
Visualizing Parklet Data
Deliverables
Description
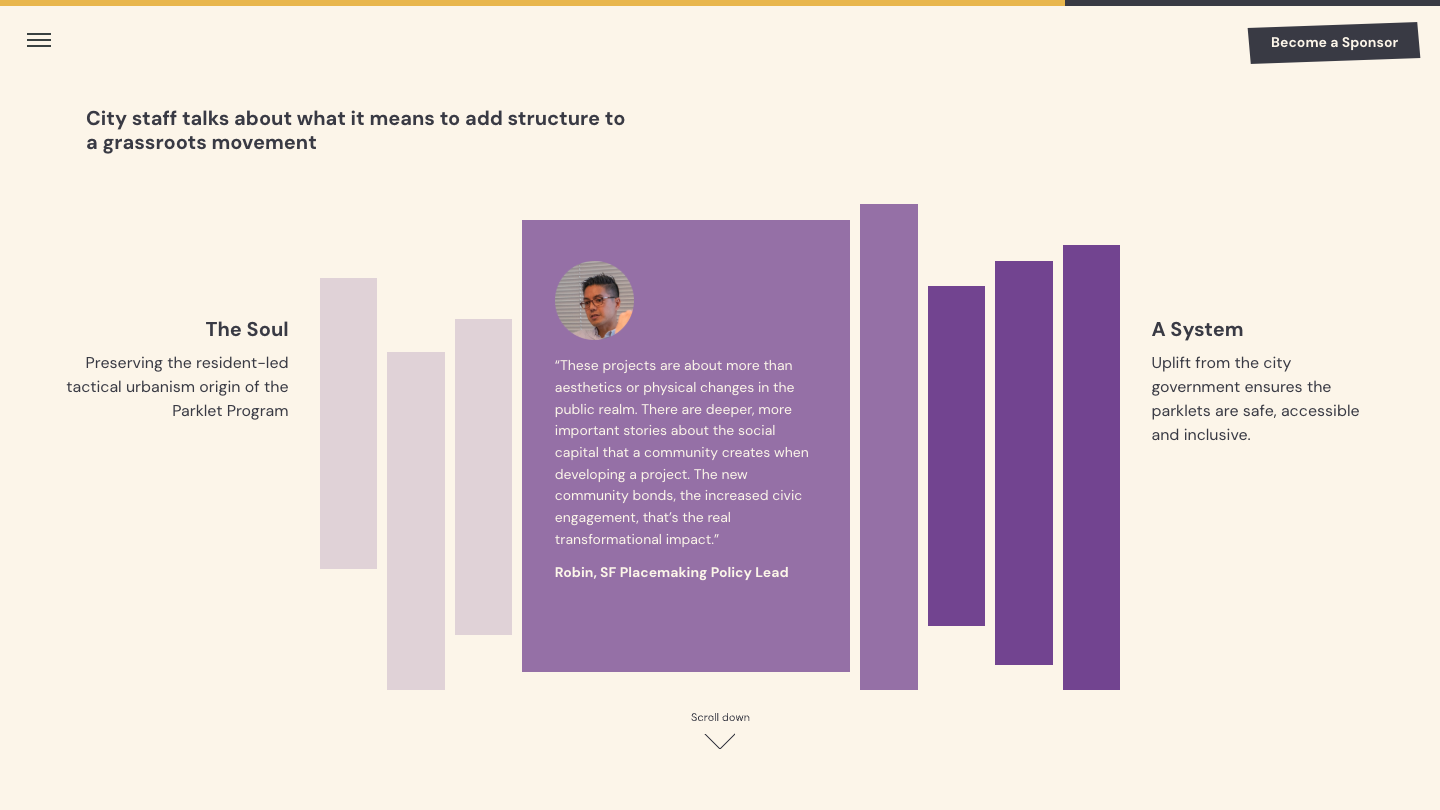
The final result is an interactive web experience called “A Look at the Human Impact of Parklets,” featuring a mix of qualitative and quantitative data, including first-person stories and perspectives of people who visit, steward, and design policy for parklets.
The narrative structure leverages experience from veteran parklet sponsors to increase transparency about the challenges of the program and to share tactics for success. The City also shares its perspective, including the pros and cons of introducing regulation, and the values that drive them.
Responsibilities
- Data Visualizations
- Front-End Web Development
- Visual Design
- Client Presentation
Final Design

Data Visualizations


Responsive Design


Methodology & Sources


Making Data Accessible & Engaging
“Publishing open data is a terrific step for cities to take to make their projects and programs more participatory and accountable; but data alone, devoid of human context, often isn’t as meaningful as we might imagine. If we want the public to engage, we need to make the data engaging. I applaud SF Planning and the team at Openbox for bringing a human-centered narrative to the way in which new information about the parklets program is being shared online for the first time.”
Outcome

The interactive data story website still lives on the Groundplay: a multi-agency program of the city of San Francisco. It was met with very positive praise by the SF Planning department as well as those generally interested in the city’s parklets program.
Parklets Update

On Tuesday July 20, 2021, the Board of Supervisors unanimously passed the permanent Shared Spaces legislation. This marked the end of the parklets program and transitioned to the Shared Spaces program.