
Civic Tech Lab
Creative Director, Product Designer
& Front-end Developer
Role
During the CommonPlace rebranding, I also helped start The Laboratory of Civic Tech, a 501(c)(3) nonprofit along with Pete Davis and Mike Bloomberg (not the former mayor) with a mission to harness the internet to revitalize local community in America.
Under The Civic Tech Lab, I also helped design and build web experiences for the Debug Politics hackathon, NYC 311 Data Jam, as well as attend BetaNYC’s School of Data and present at Civic Hall in front of then Borough of Manhattan President Gale Brewer.
Responsibilities
Work Details
Industry
Government, Civic Tech, Startup, 501(c)(3) Nonprofit
Year
2017—2019
Archive Website
Jump To Section

Branding

CommonPlace

Debug Politics

United We Post
Branding
Description
A home for Civic Tech centered on solidarity and empowerment.
My role as Creative Director and Product Designer at The Laboratory for Civic Technology (Civic Tech Lab) was to harness the internet to revitalize local community in America.
Responsibilities
- Logo Design
- Website Design
- Marketing Materials & Pitch Deck
Our Mission
“The growth of civic tech—technology created in service of democracy—is an inspiration. Foundations are funding it. Universities are fostering it. Cities are using it. And civic-minded developers and designers are getting together by the thousands across the country to create it.
In fact, we believe that the civic tech world is getting big enough that it is becoming worthwhile for the civic tech community to begin identifying subcategories within itself. A rudimentary taxonomy could help us identify useful patterns, as well as ensure that corners of the civic tech world are not being ignored.”
Logo Designs


Updated Color Palette & Branding
Animated Versions


CommonPlace
Description
CommonPlace, the flagship project of the Laboratory for Civic Technology, is an online town bulletin that has proven to be the best not-for-profit, open source web platform for local community engagement.
The civic tool makes it super easy for neighbors and civic leaders to share and connect with their town.
Based on a successful pilot from 2009-2013, the Civic Tech Lab relaunched CommonPlace in Spring 2017.
Responsibilities
- Logo Design
- UX Research & Design
- Feature Ideation
- Web App (UI) Design
- Interactive Prototypes
- HTML/CSS
- Marketing Materials & Pitch Deck
CommonPlace Pilot:
Figma Prototype:
HTML Prototype:
Rebranding


Lorem Ipsum
Figma Prototype
Rebranding
Research
Description
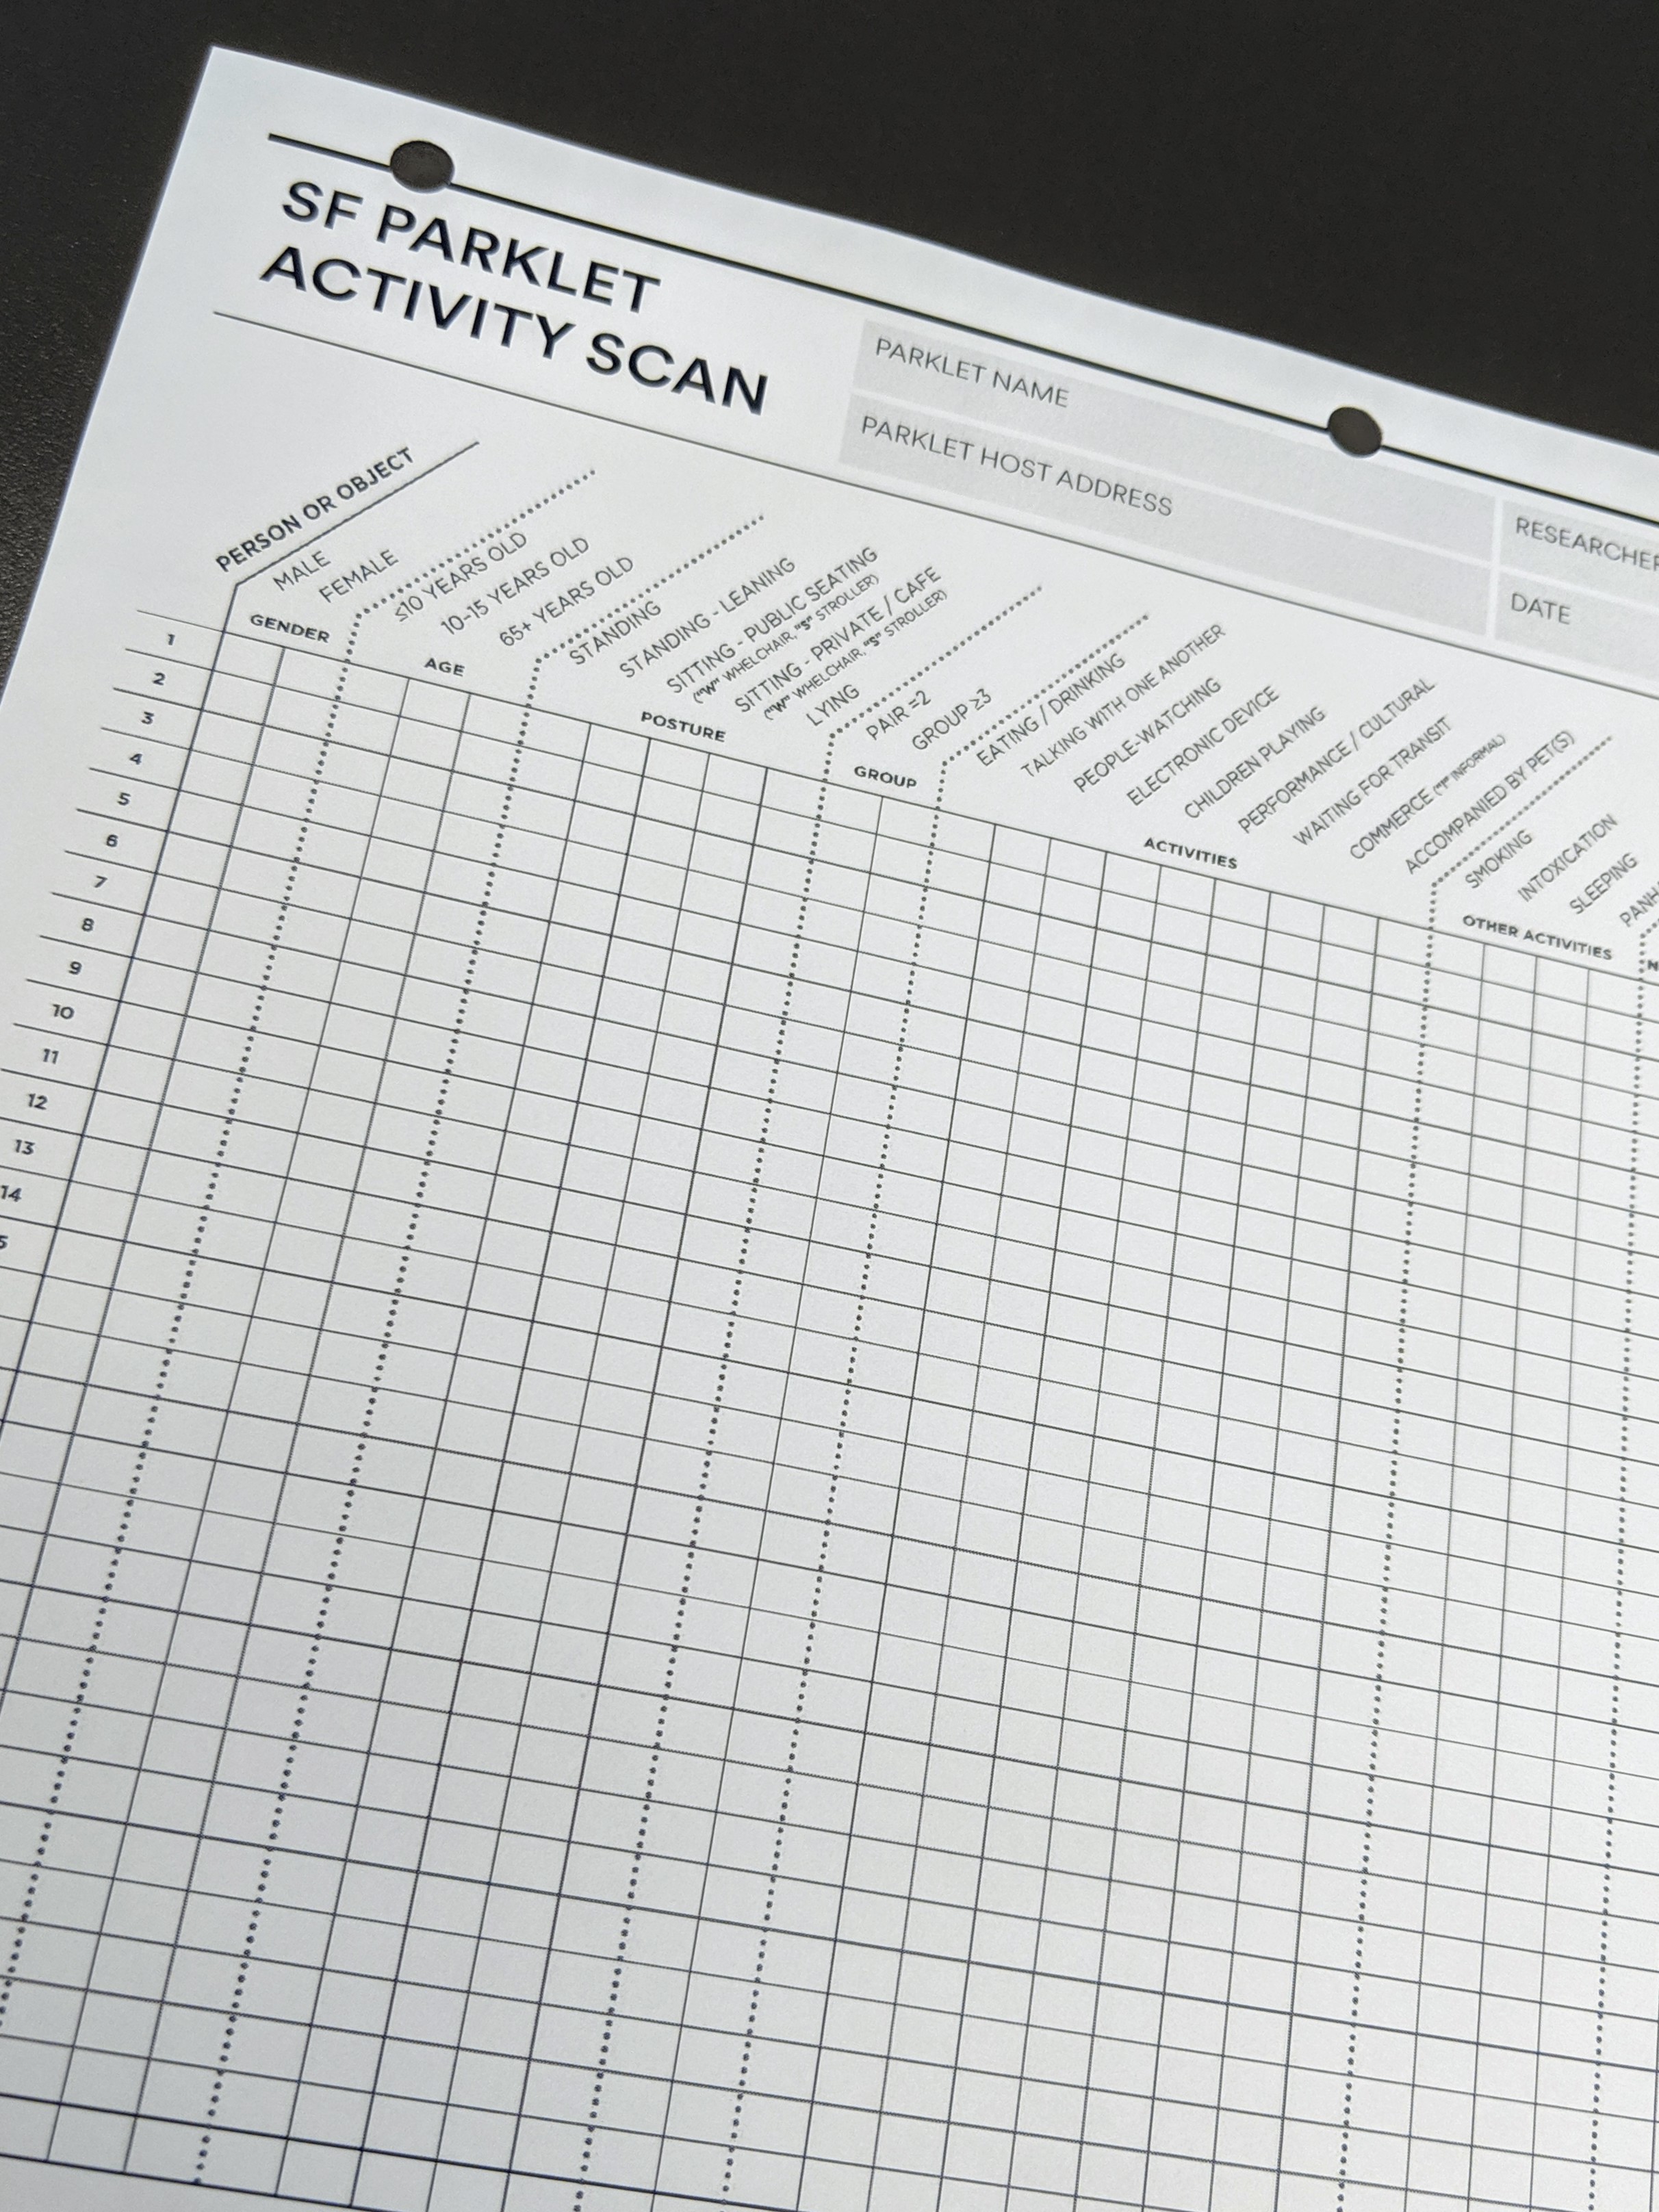
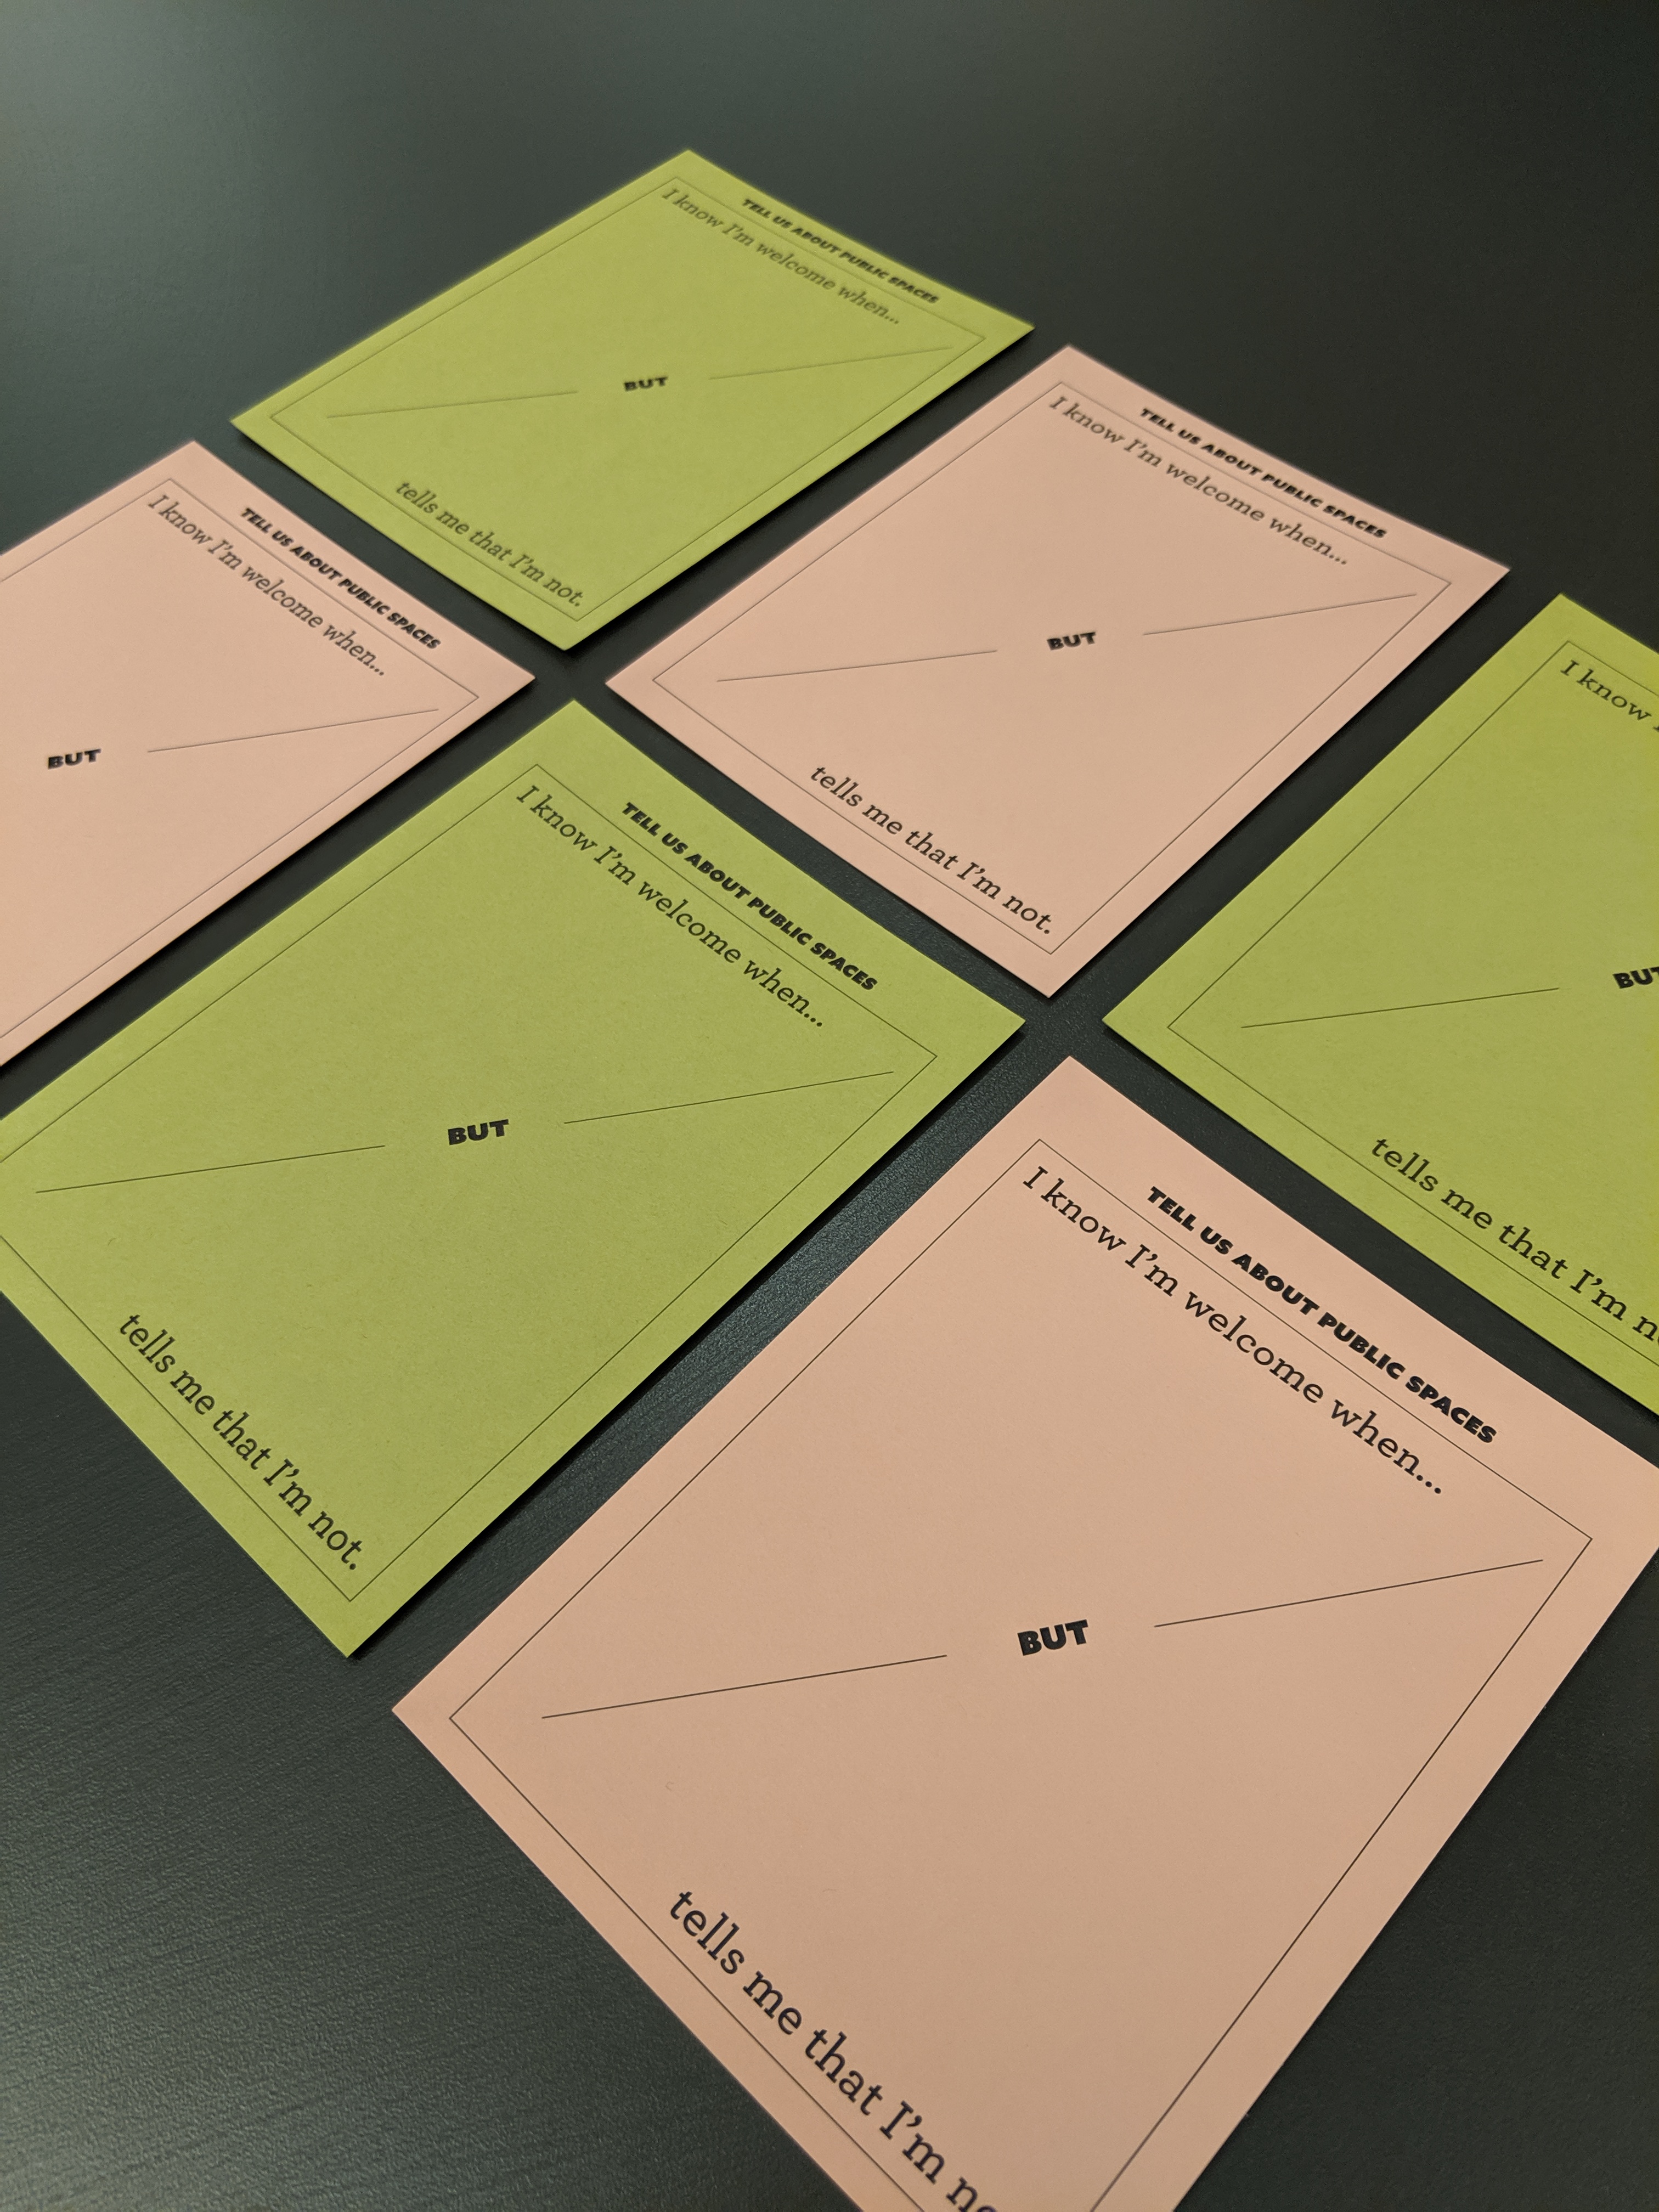
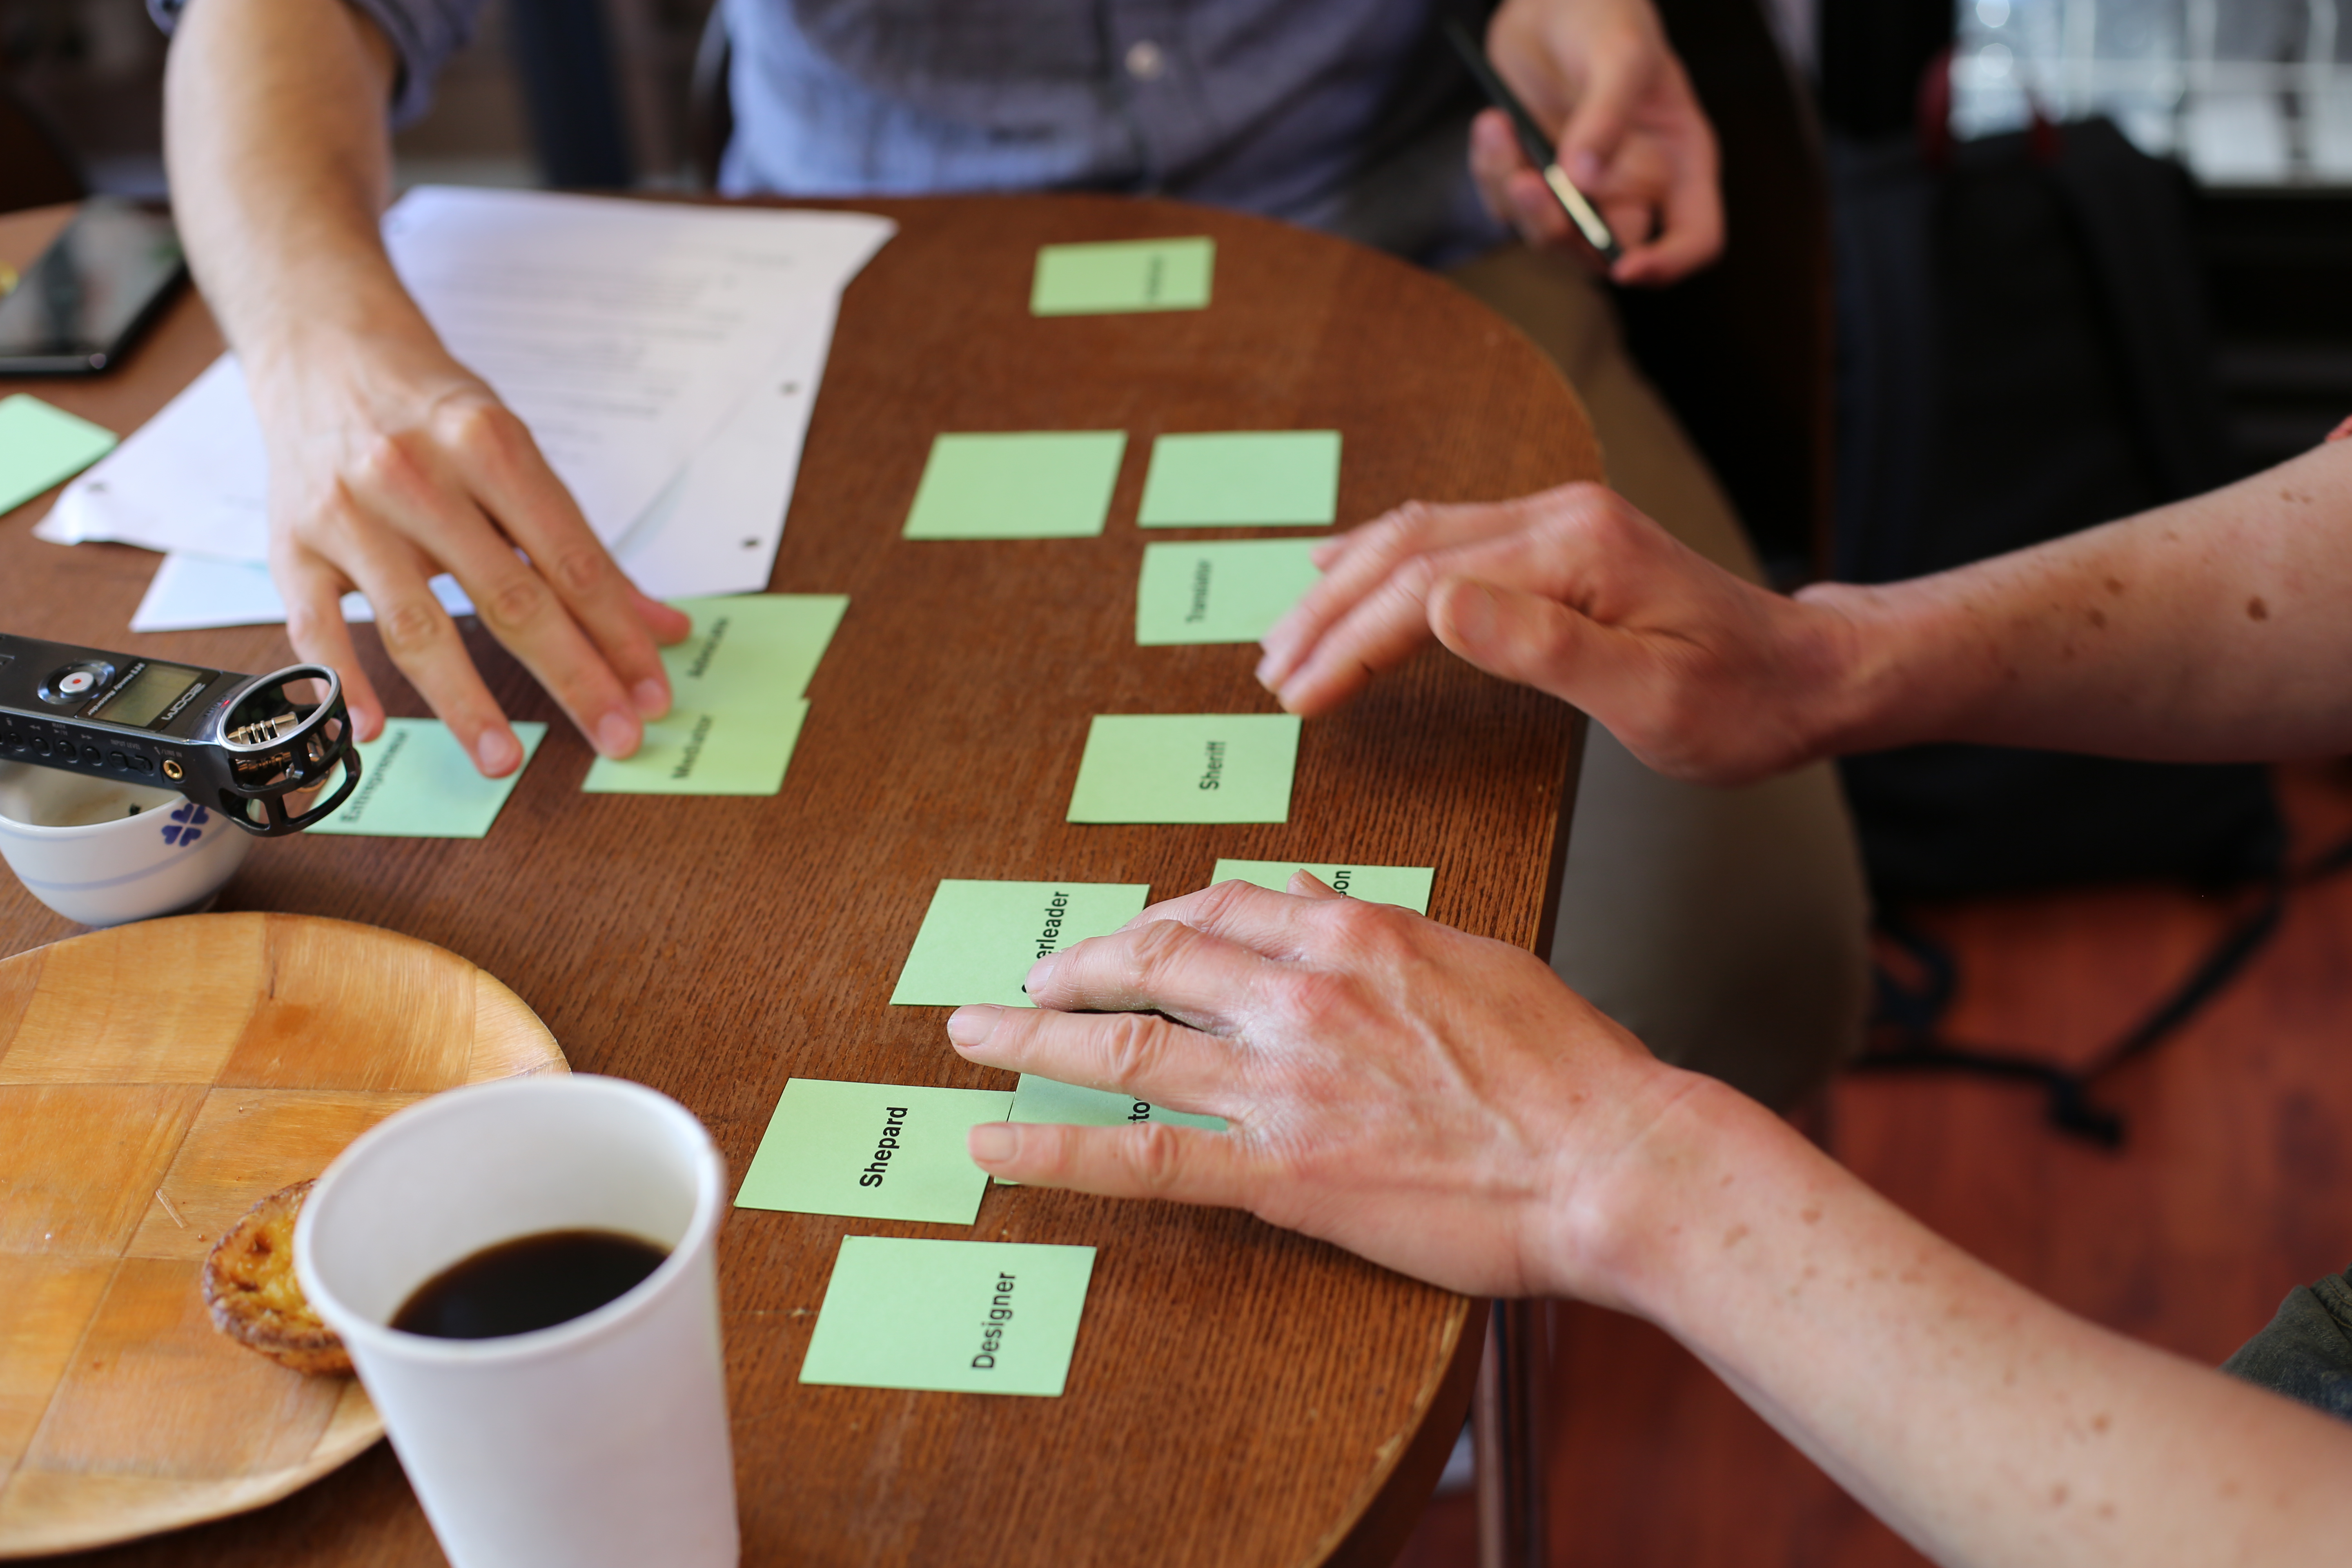
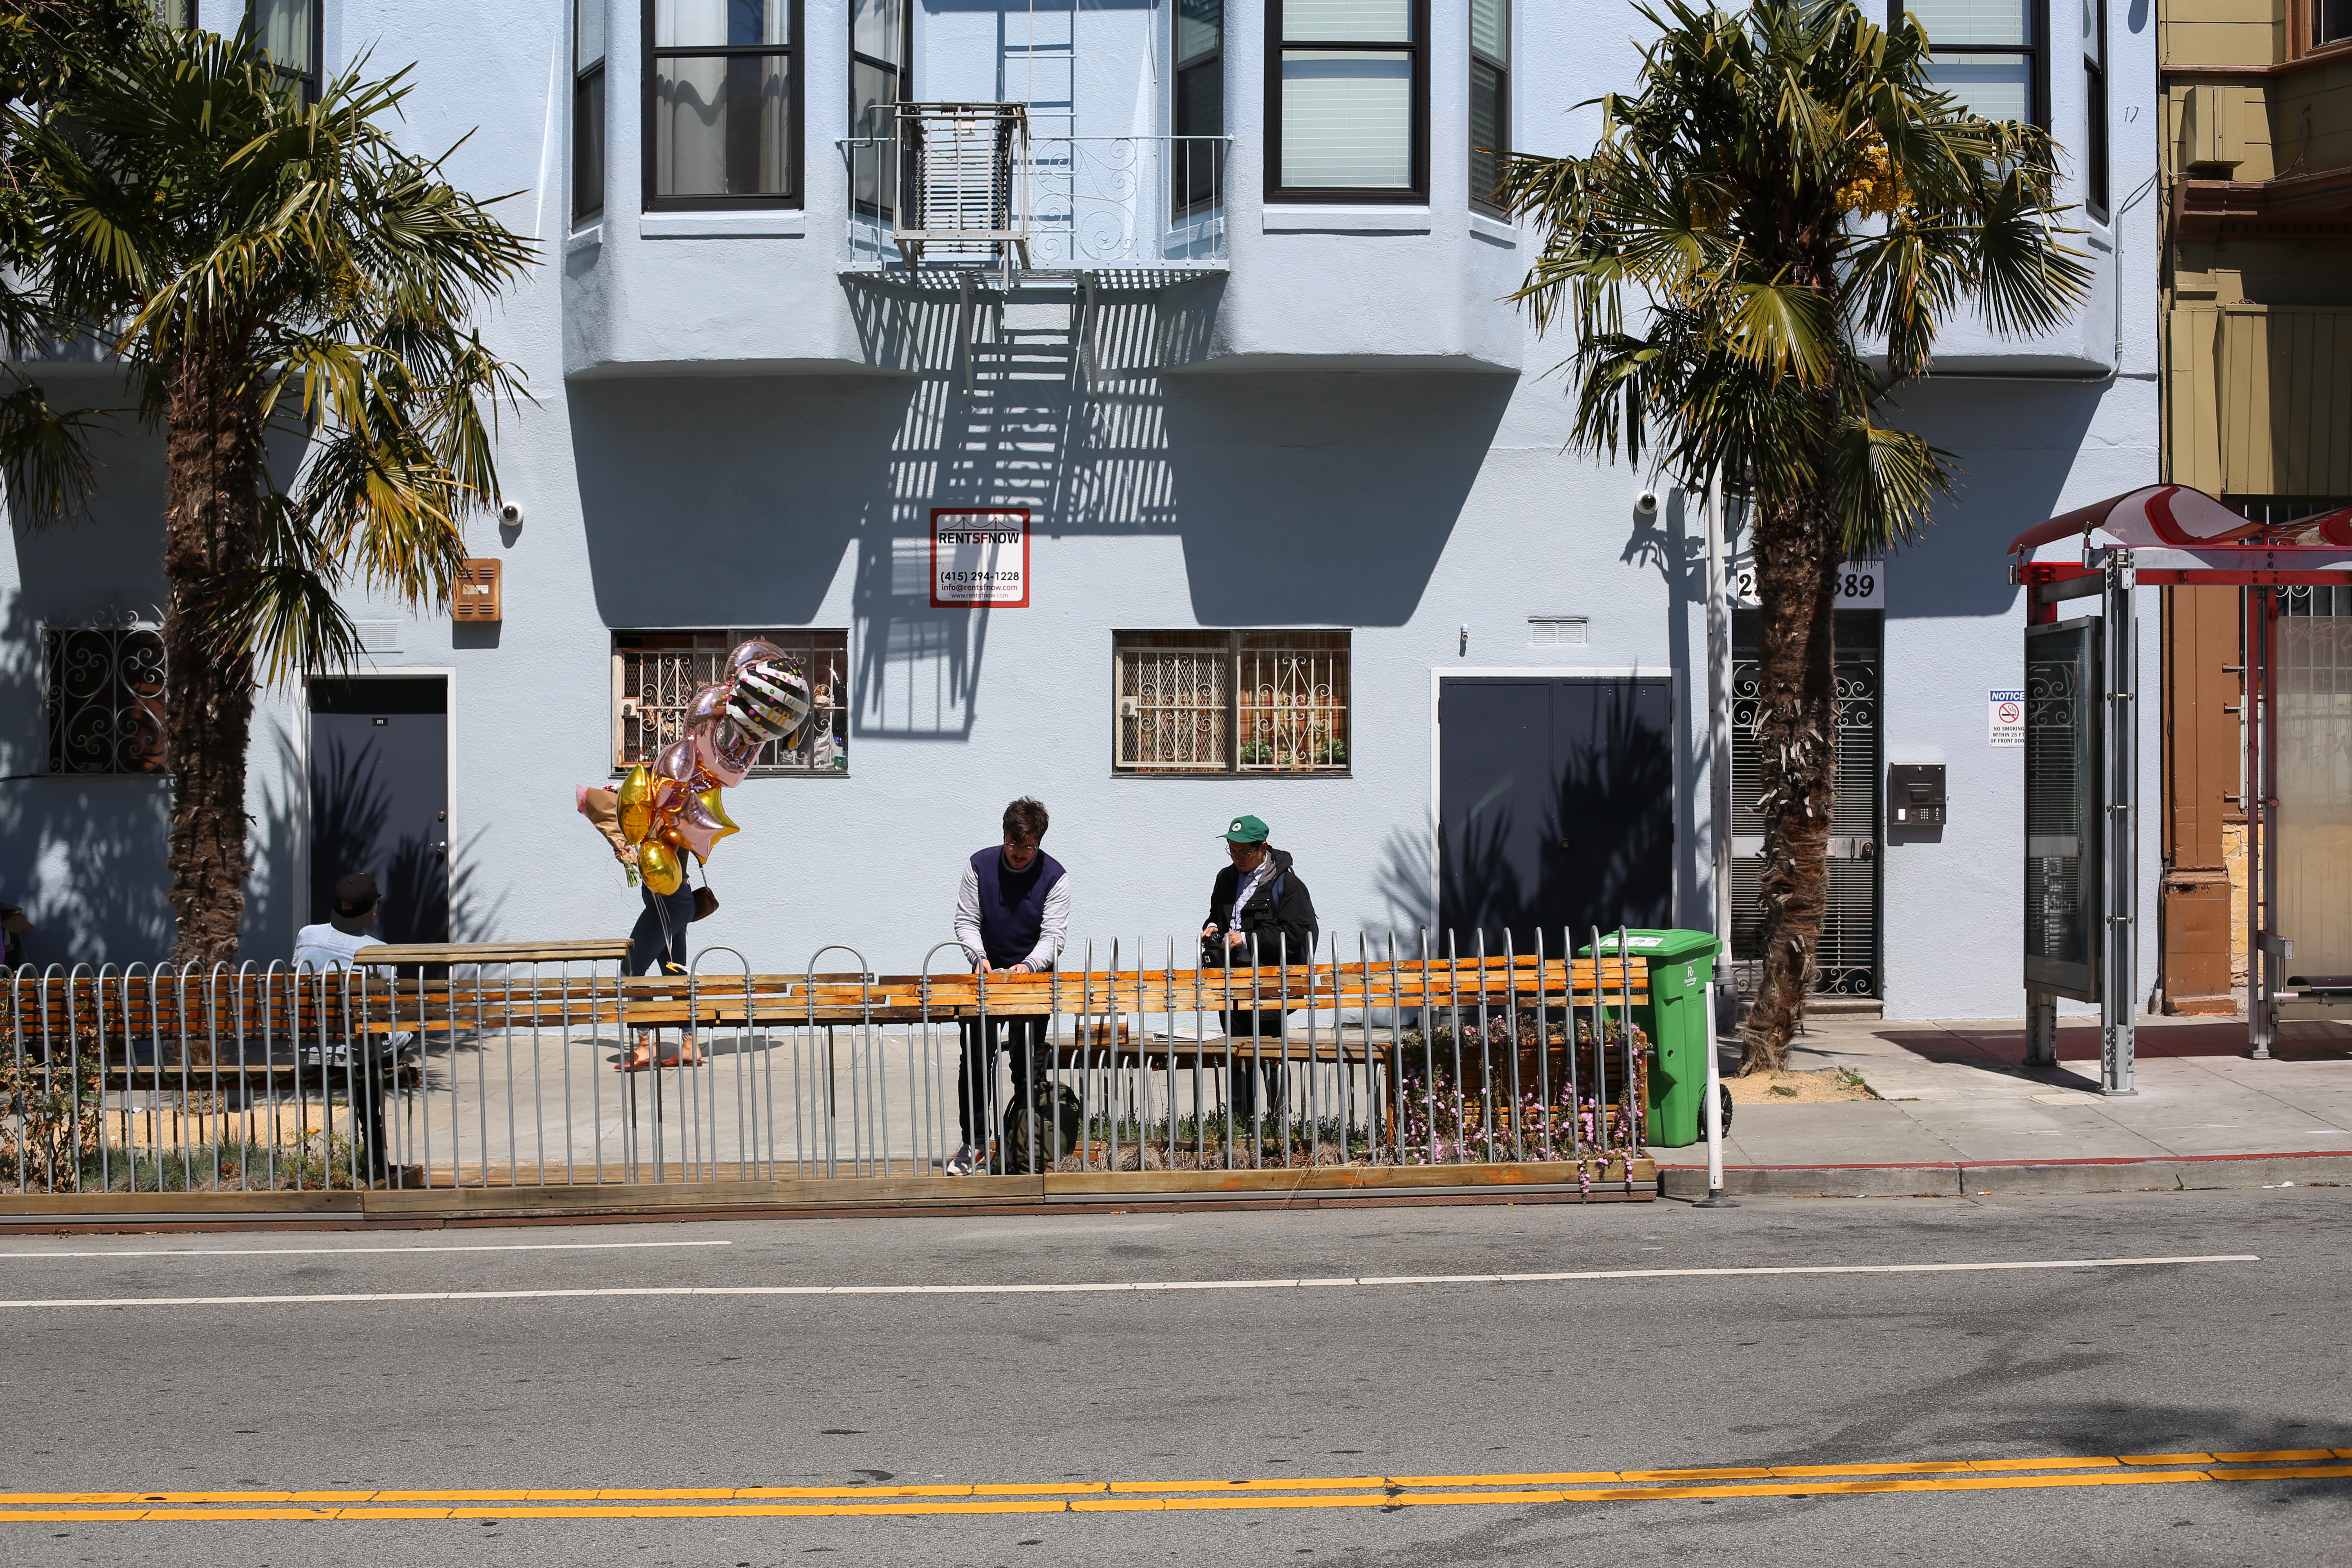
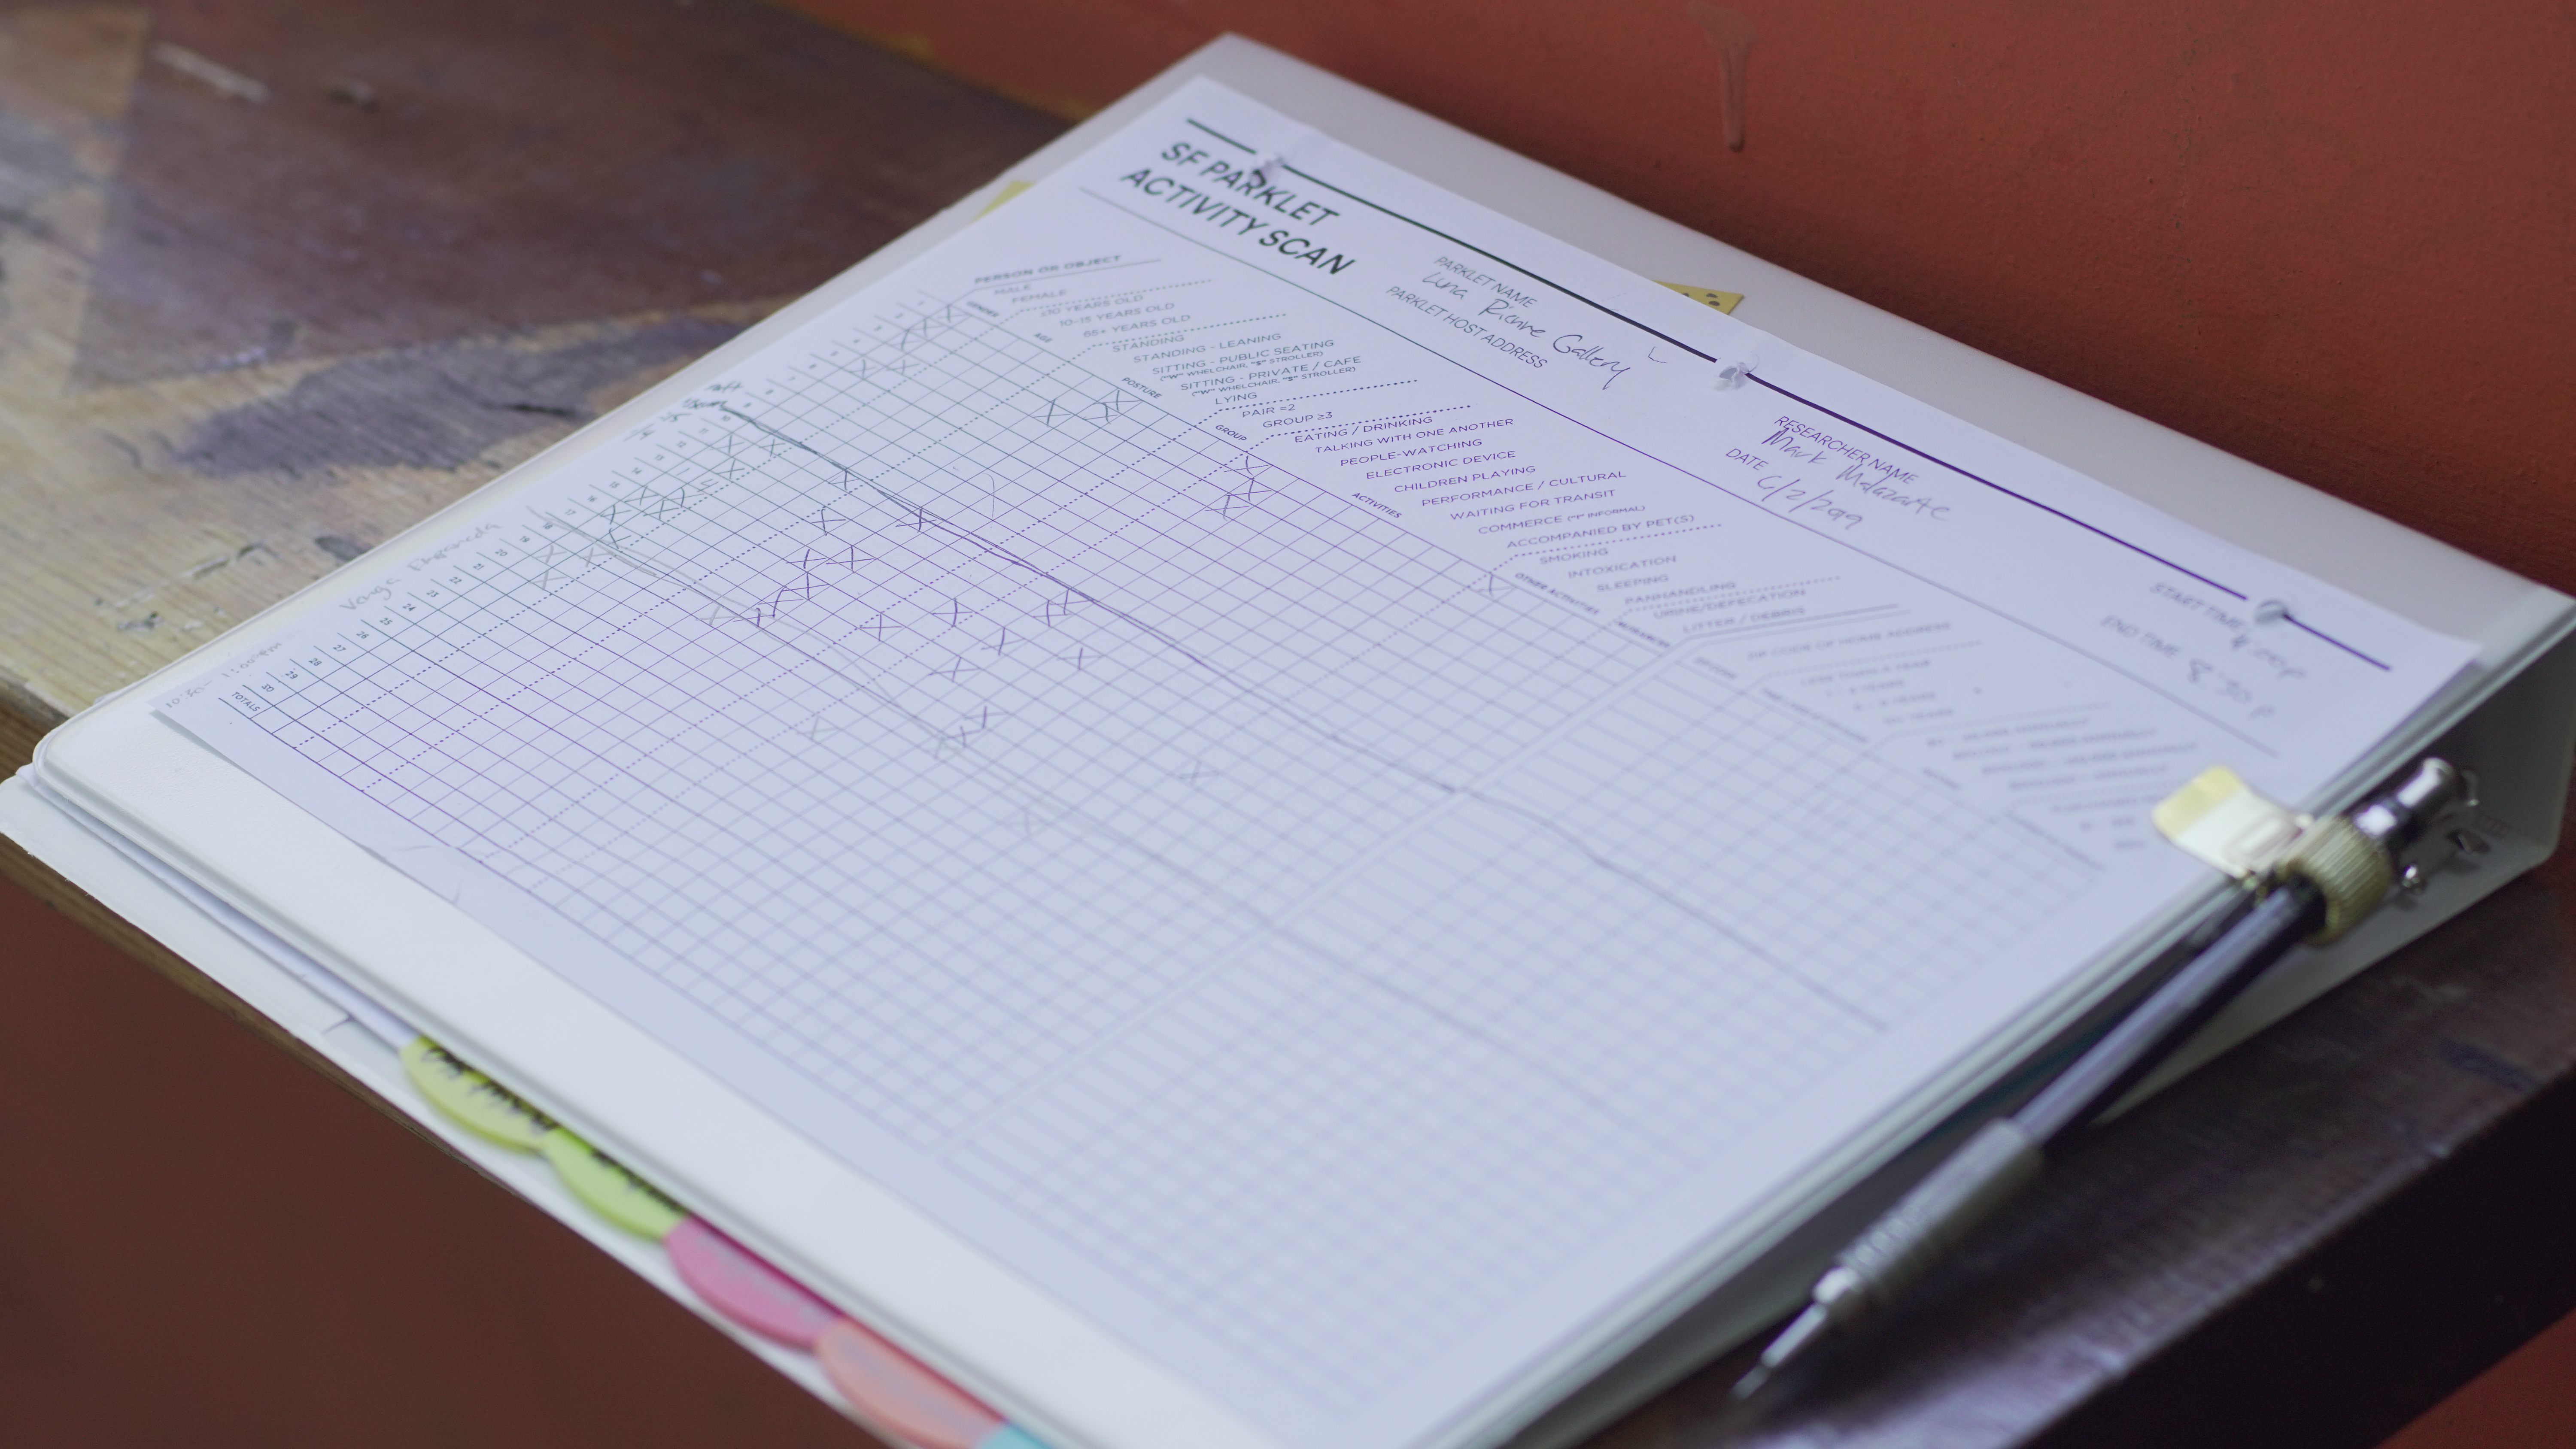
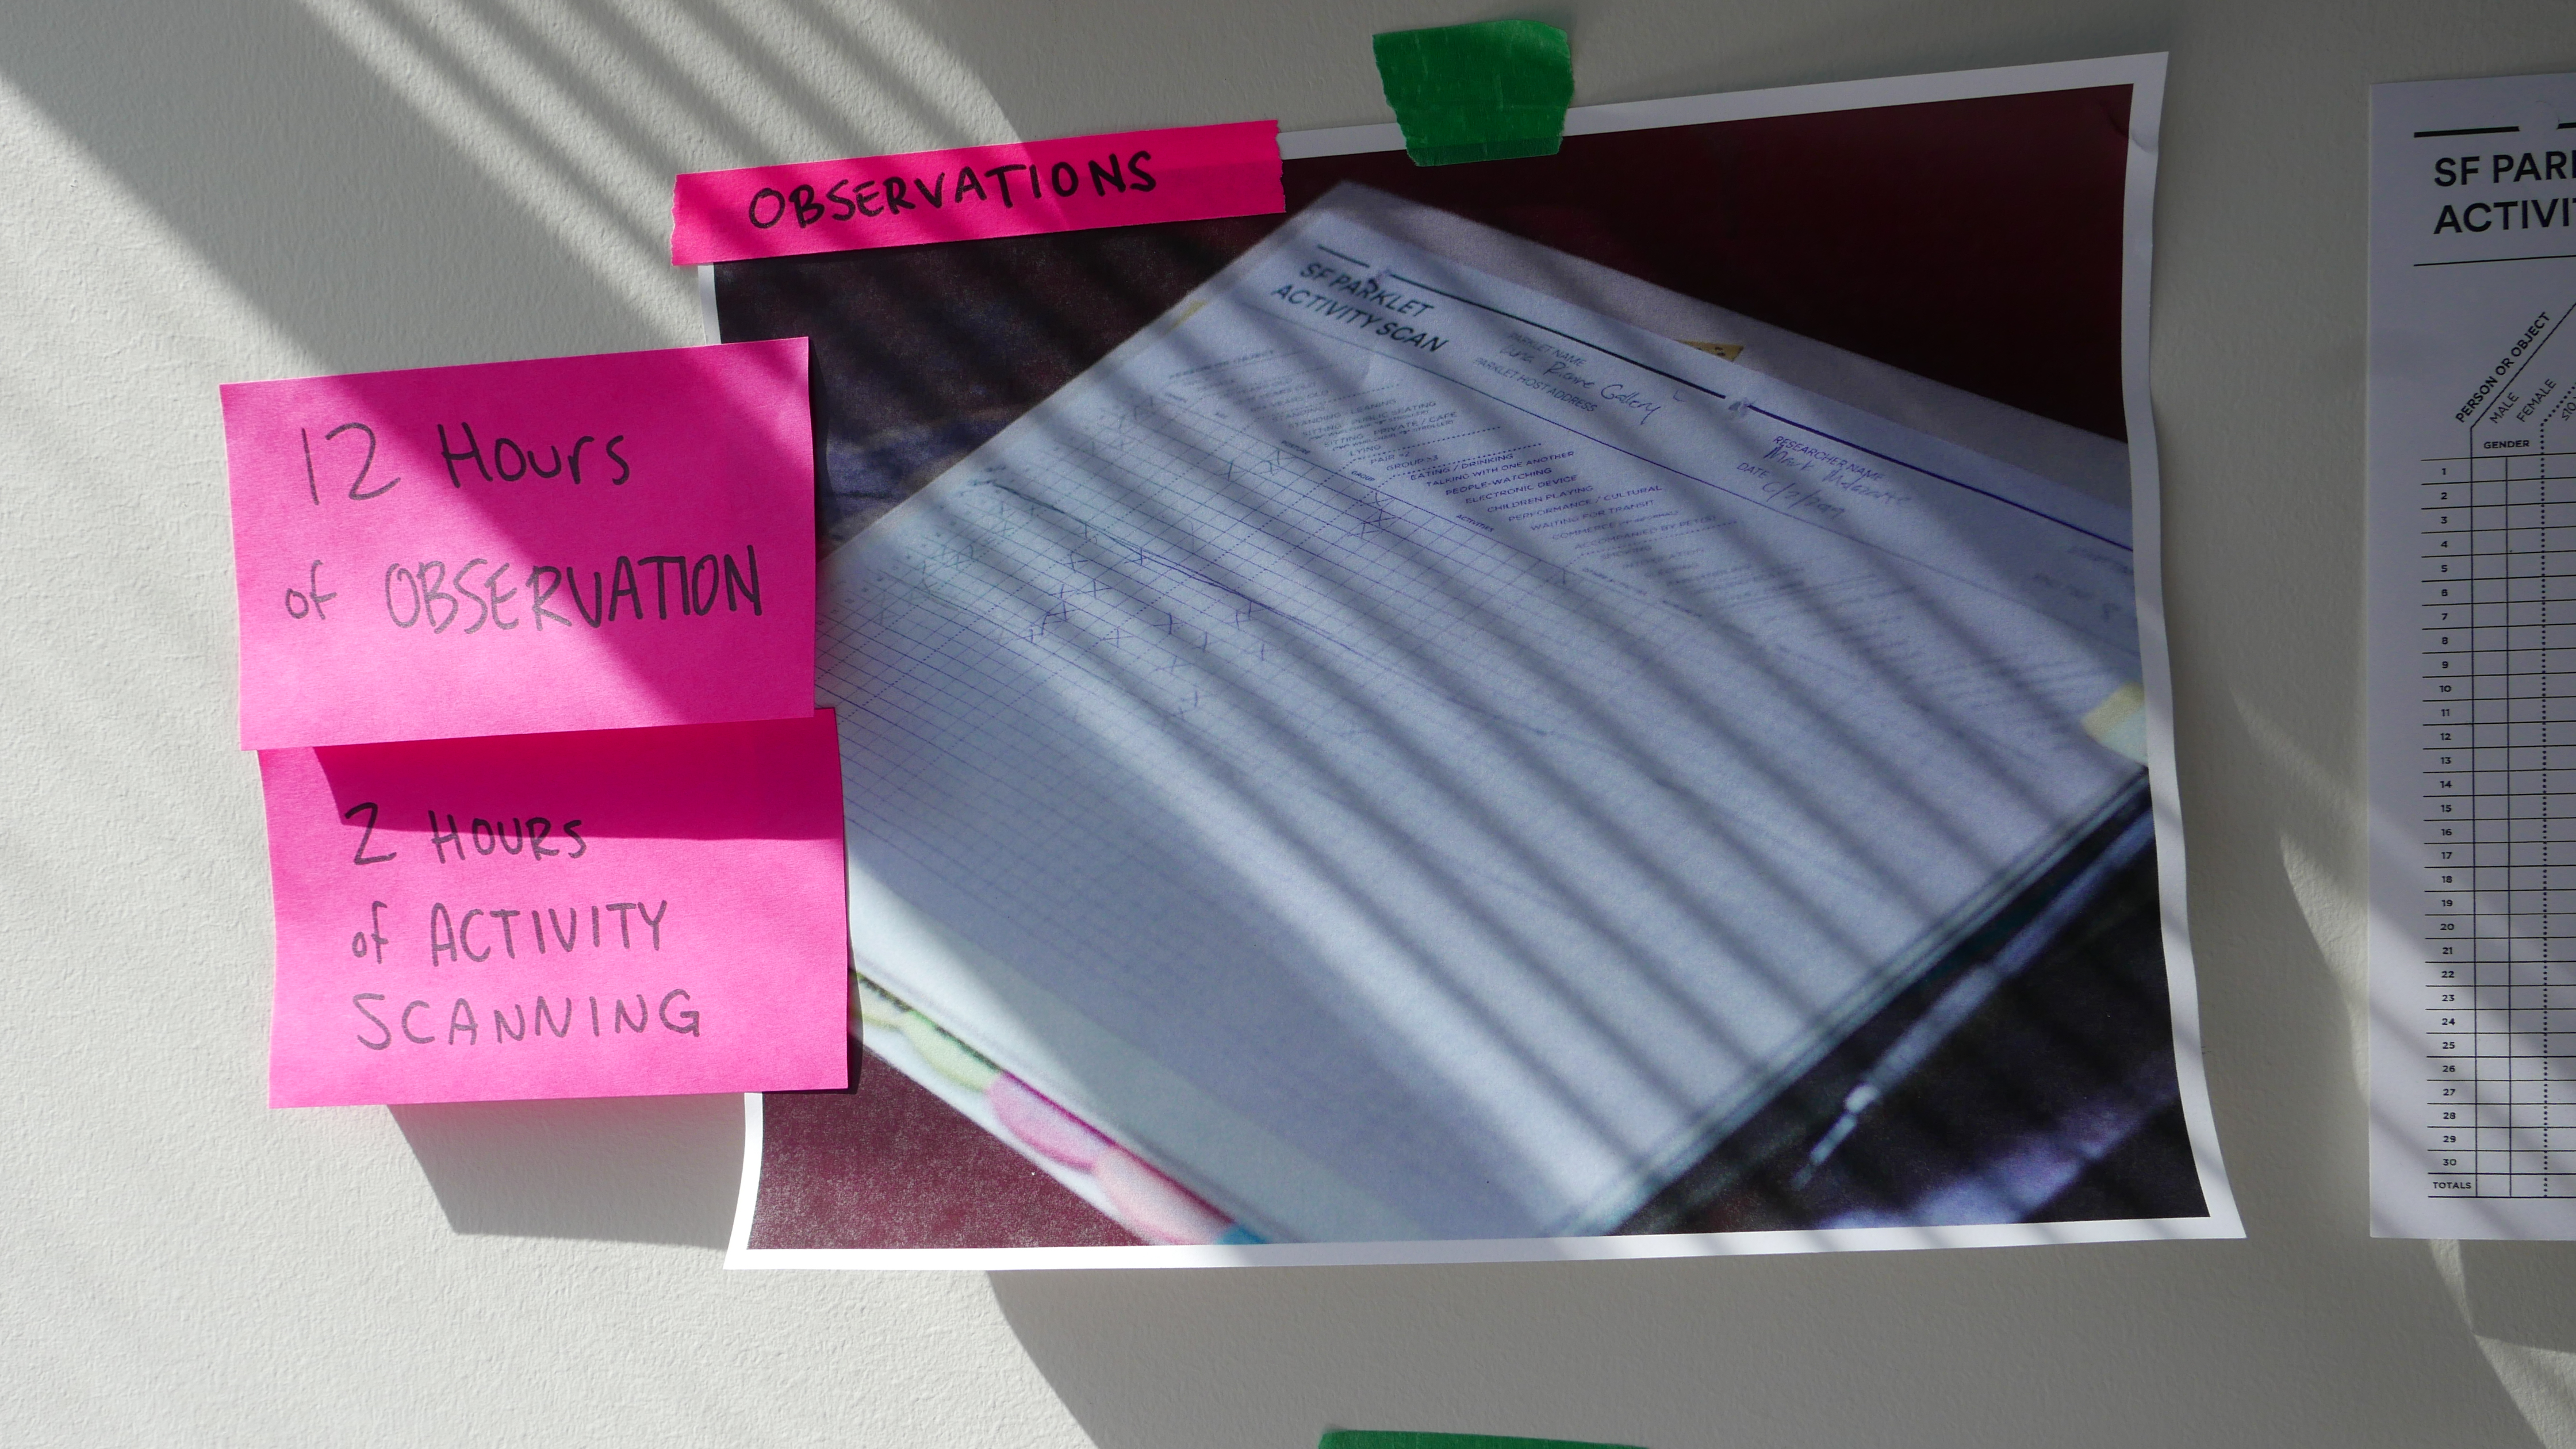
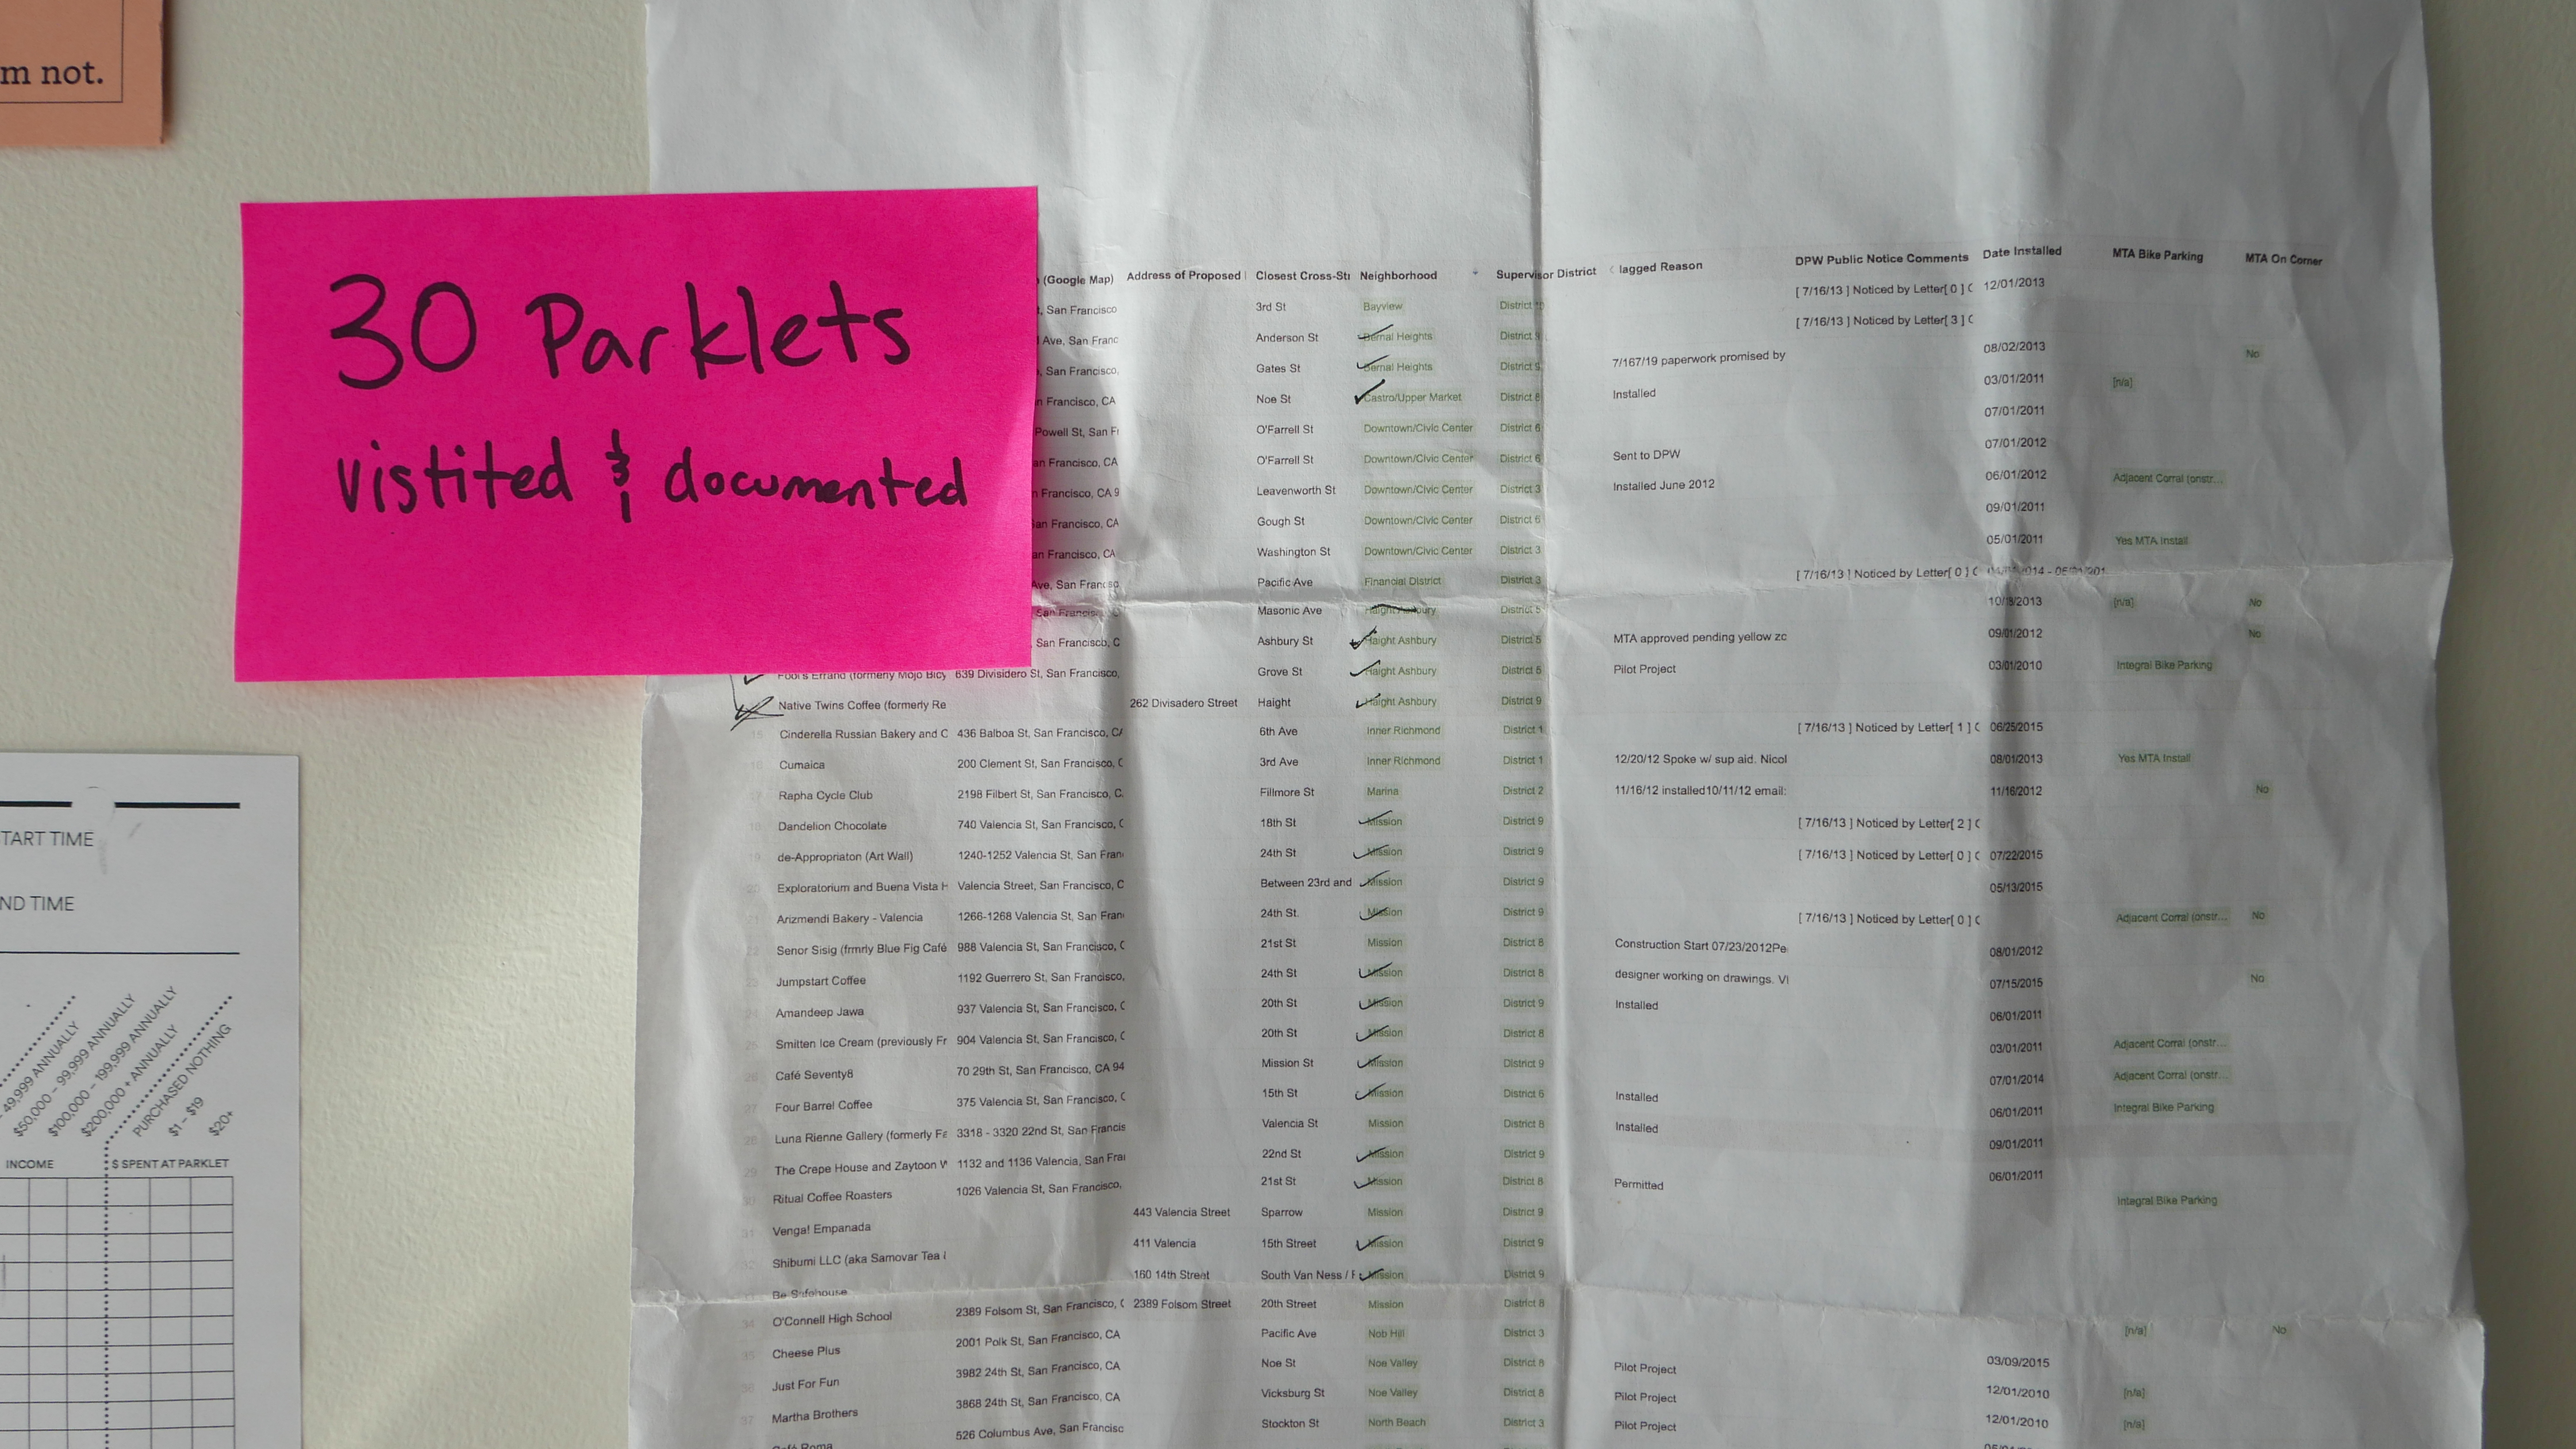
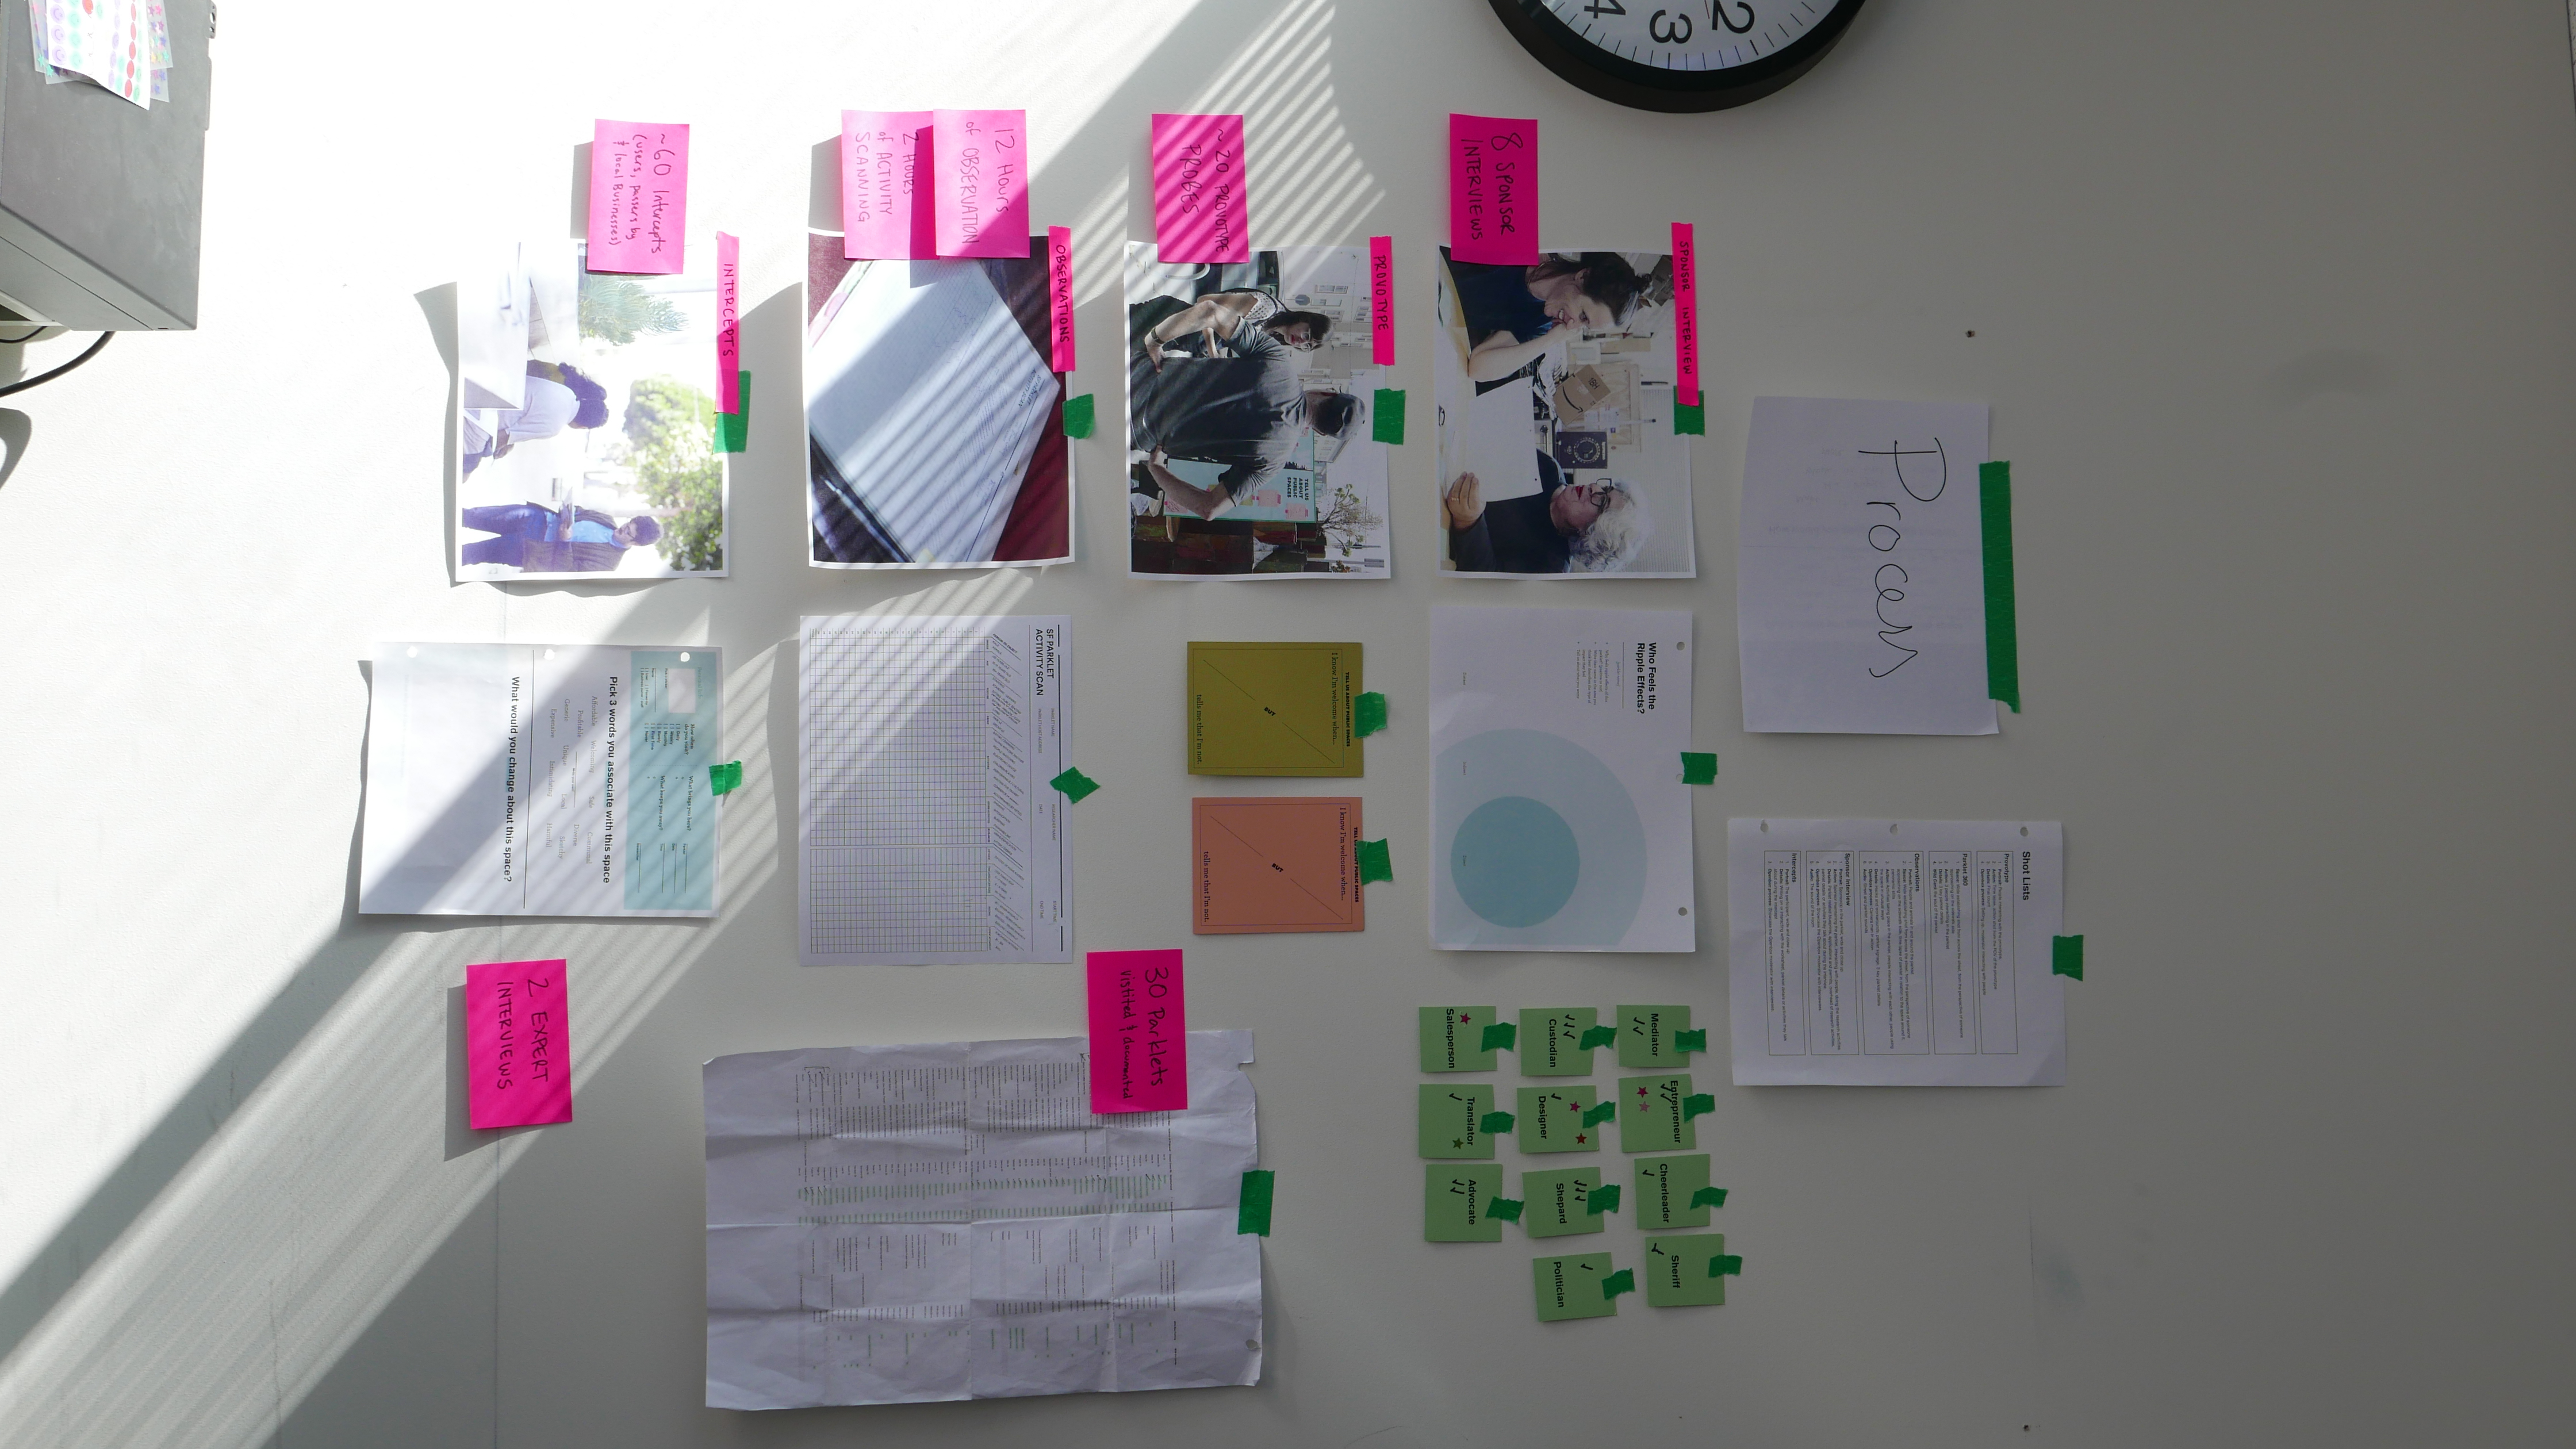
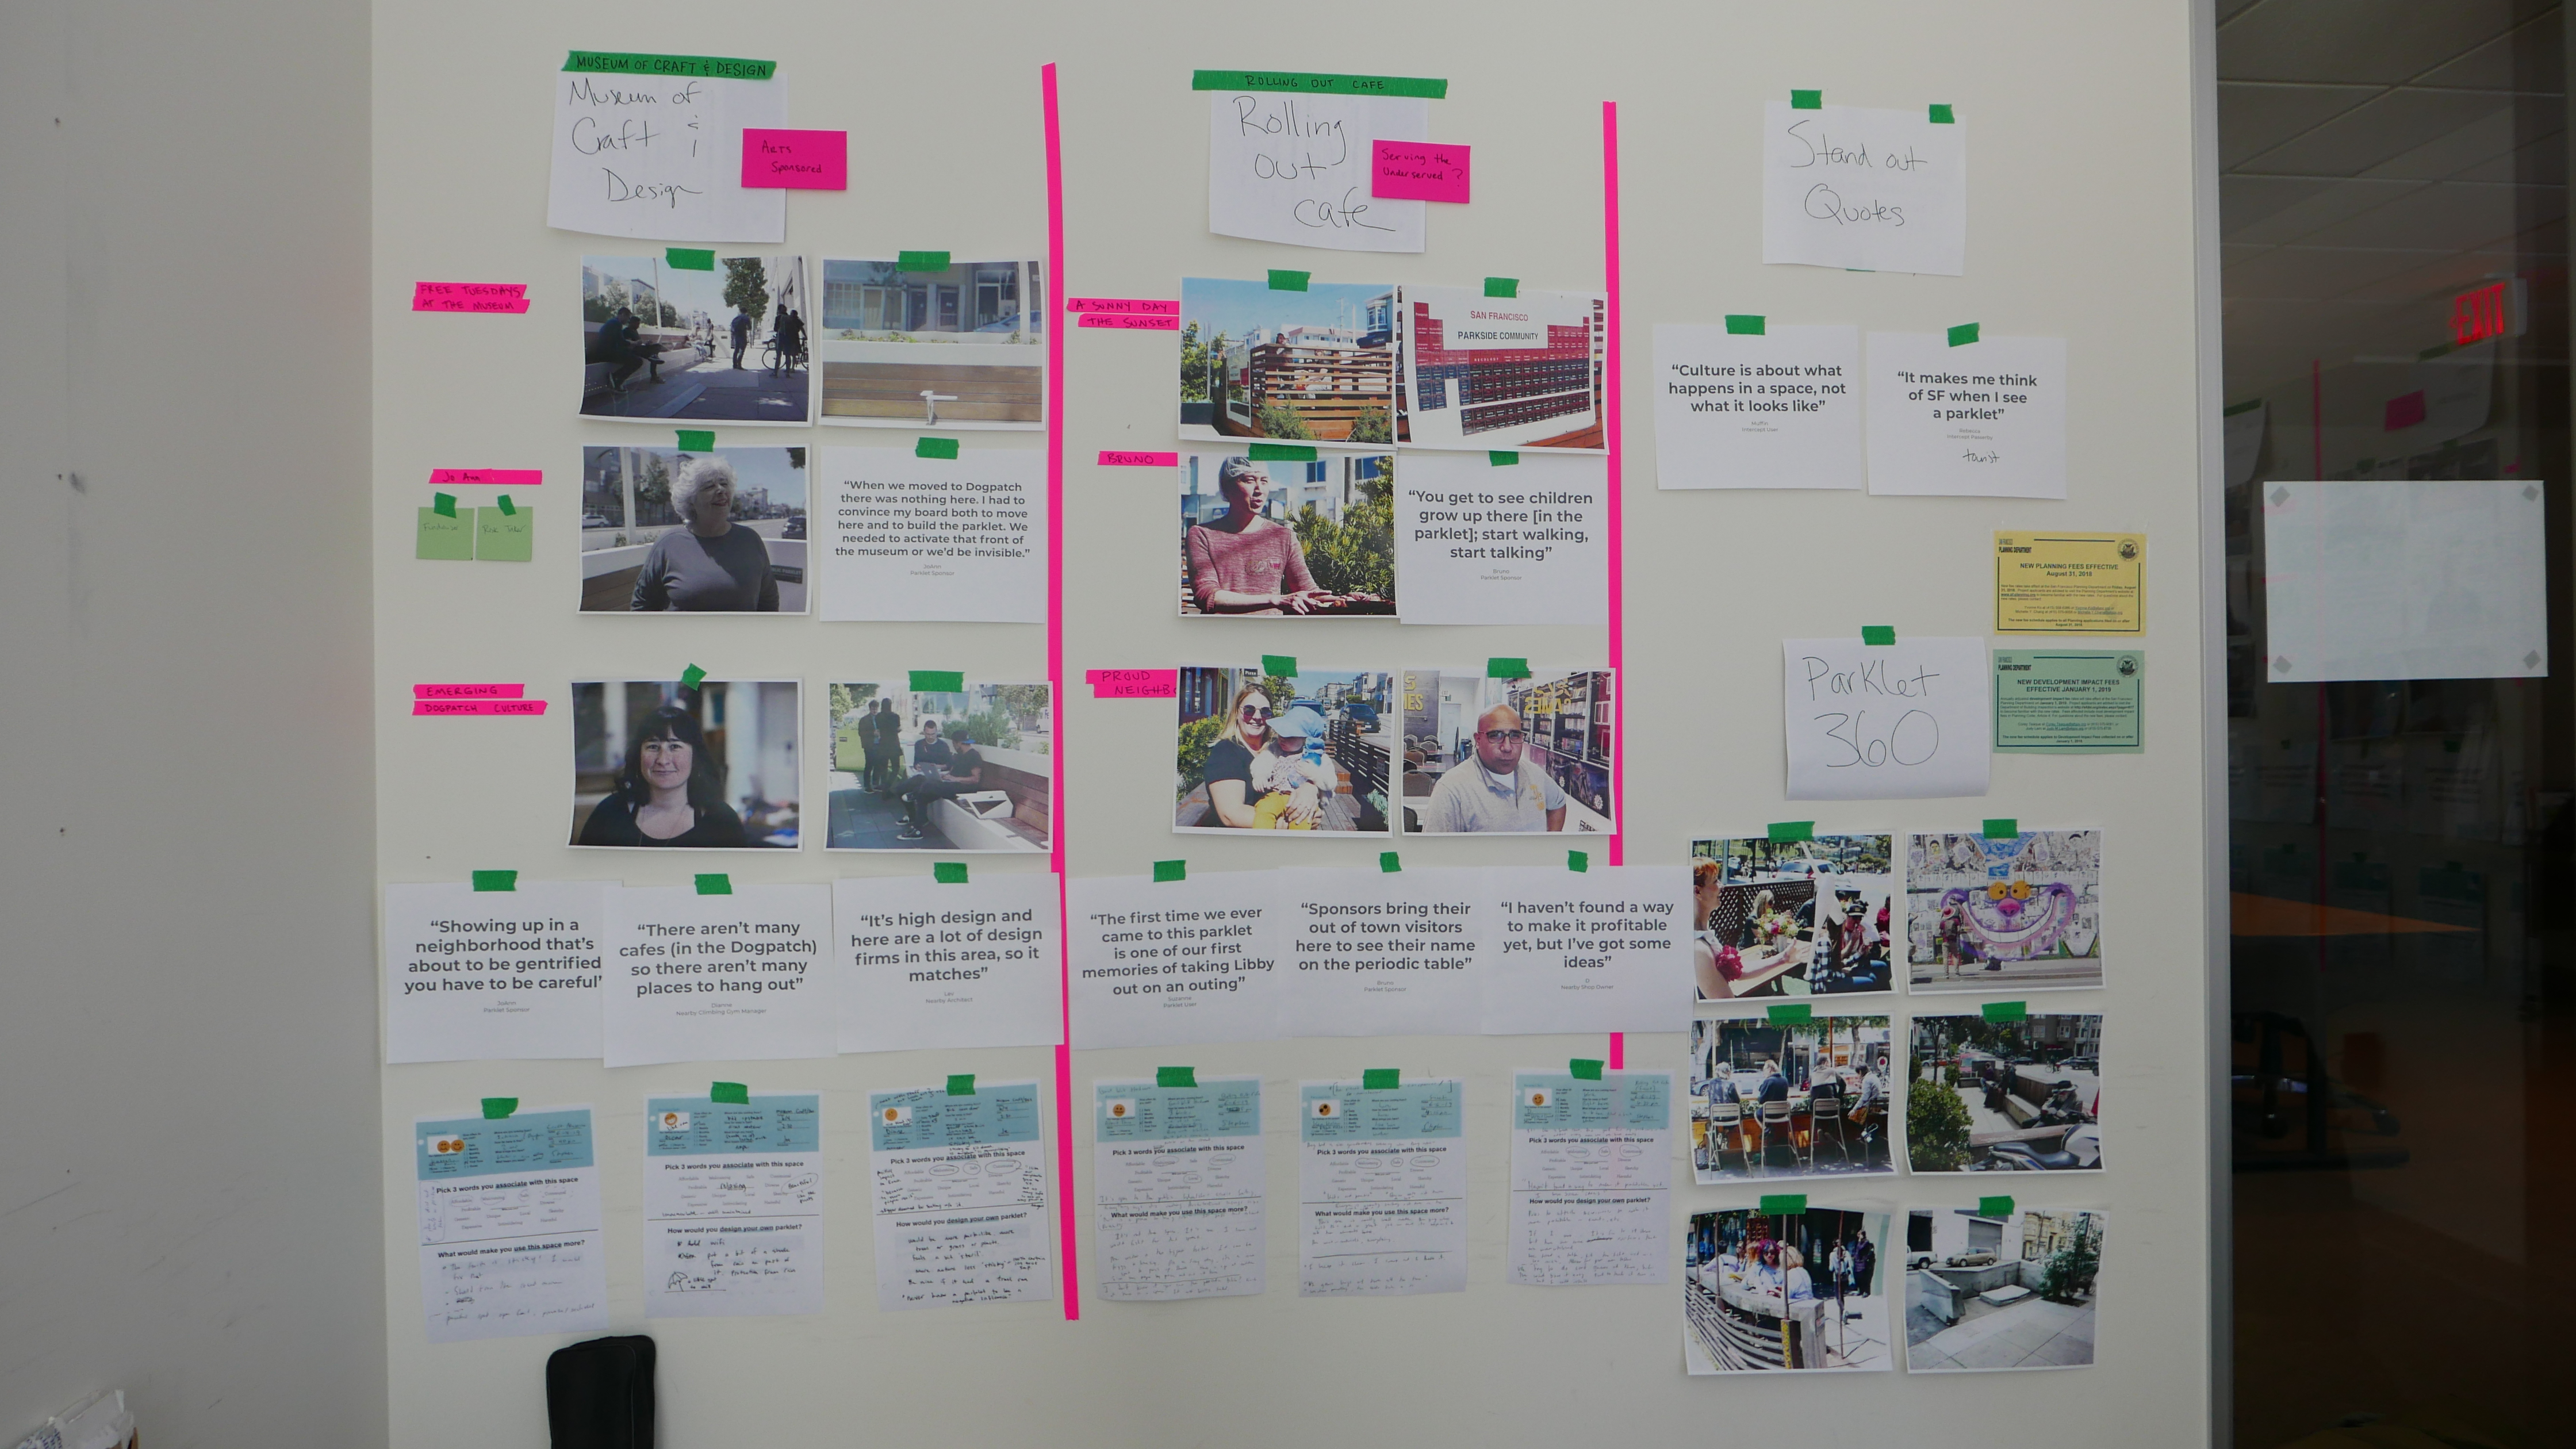
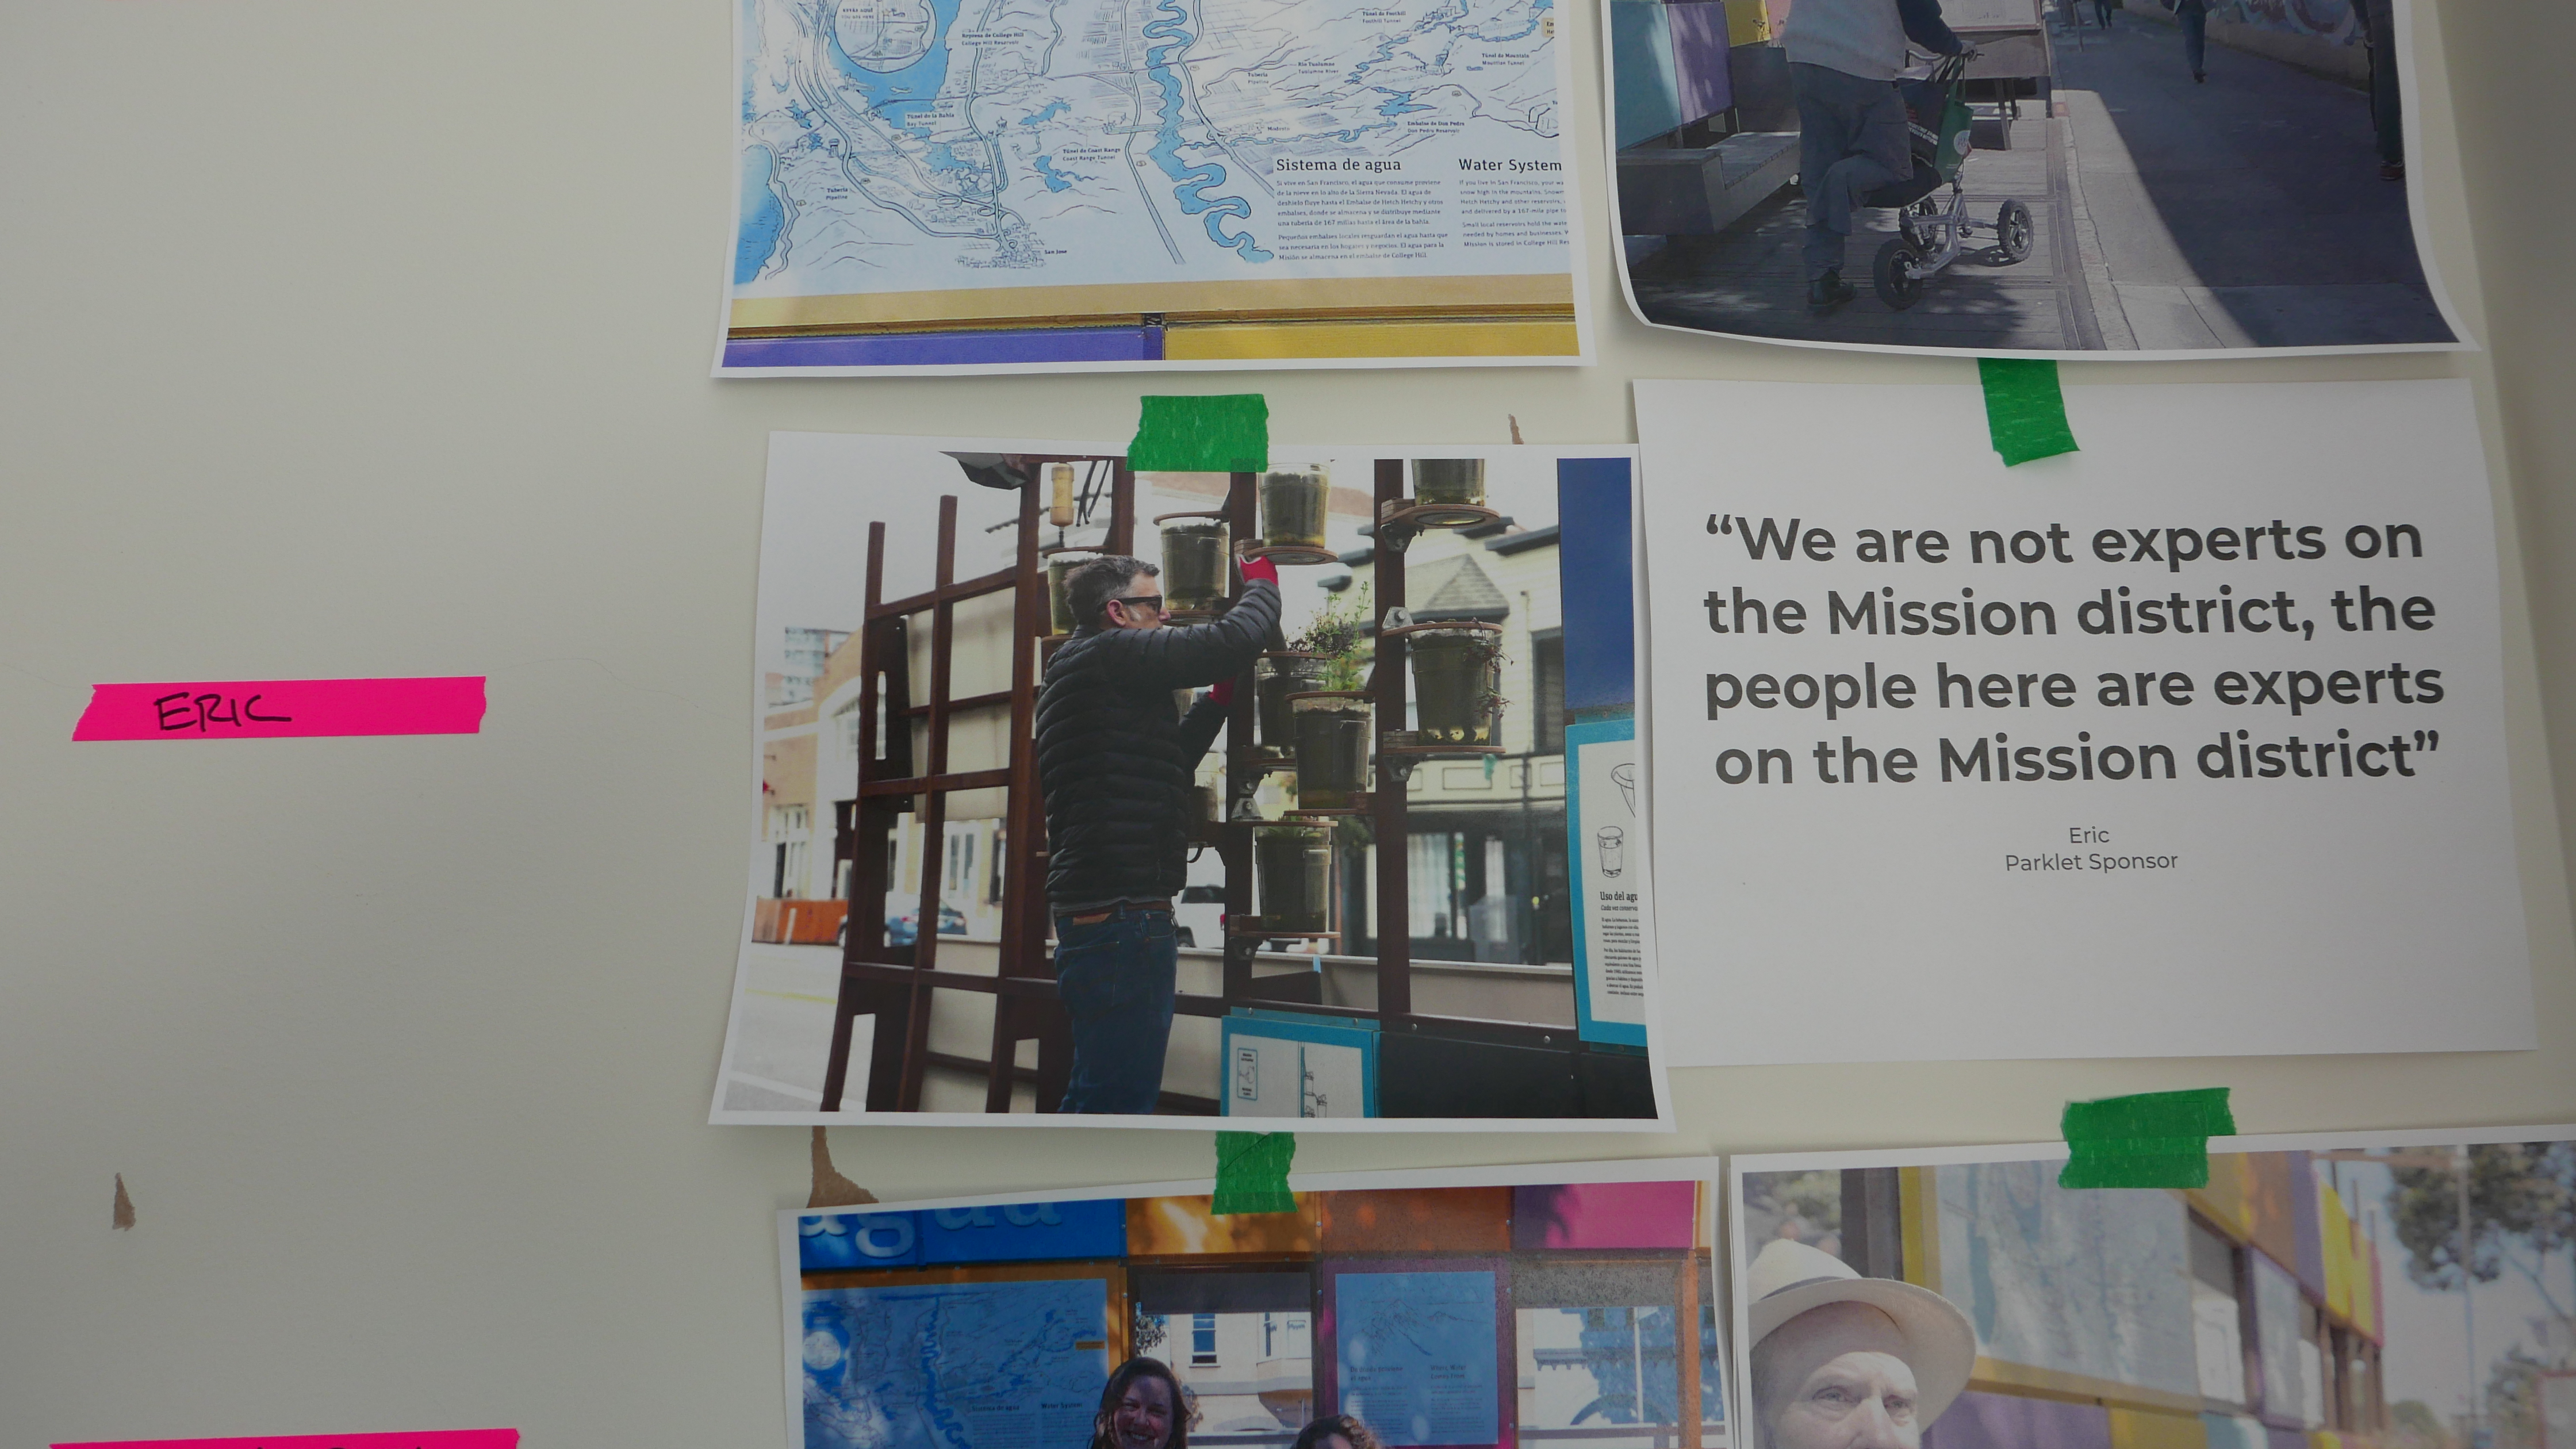
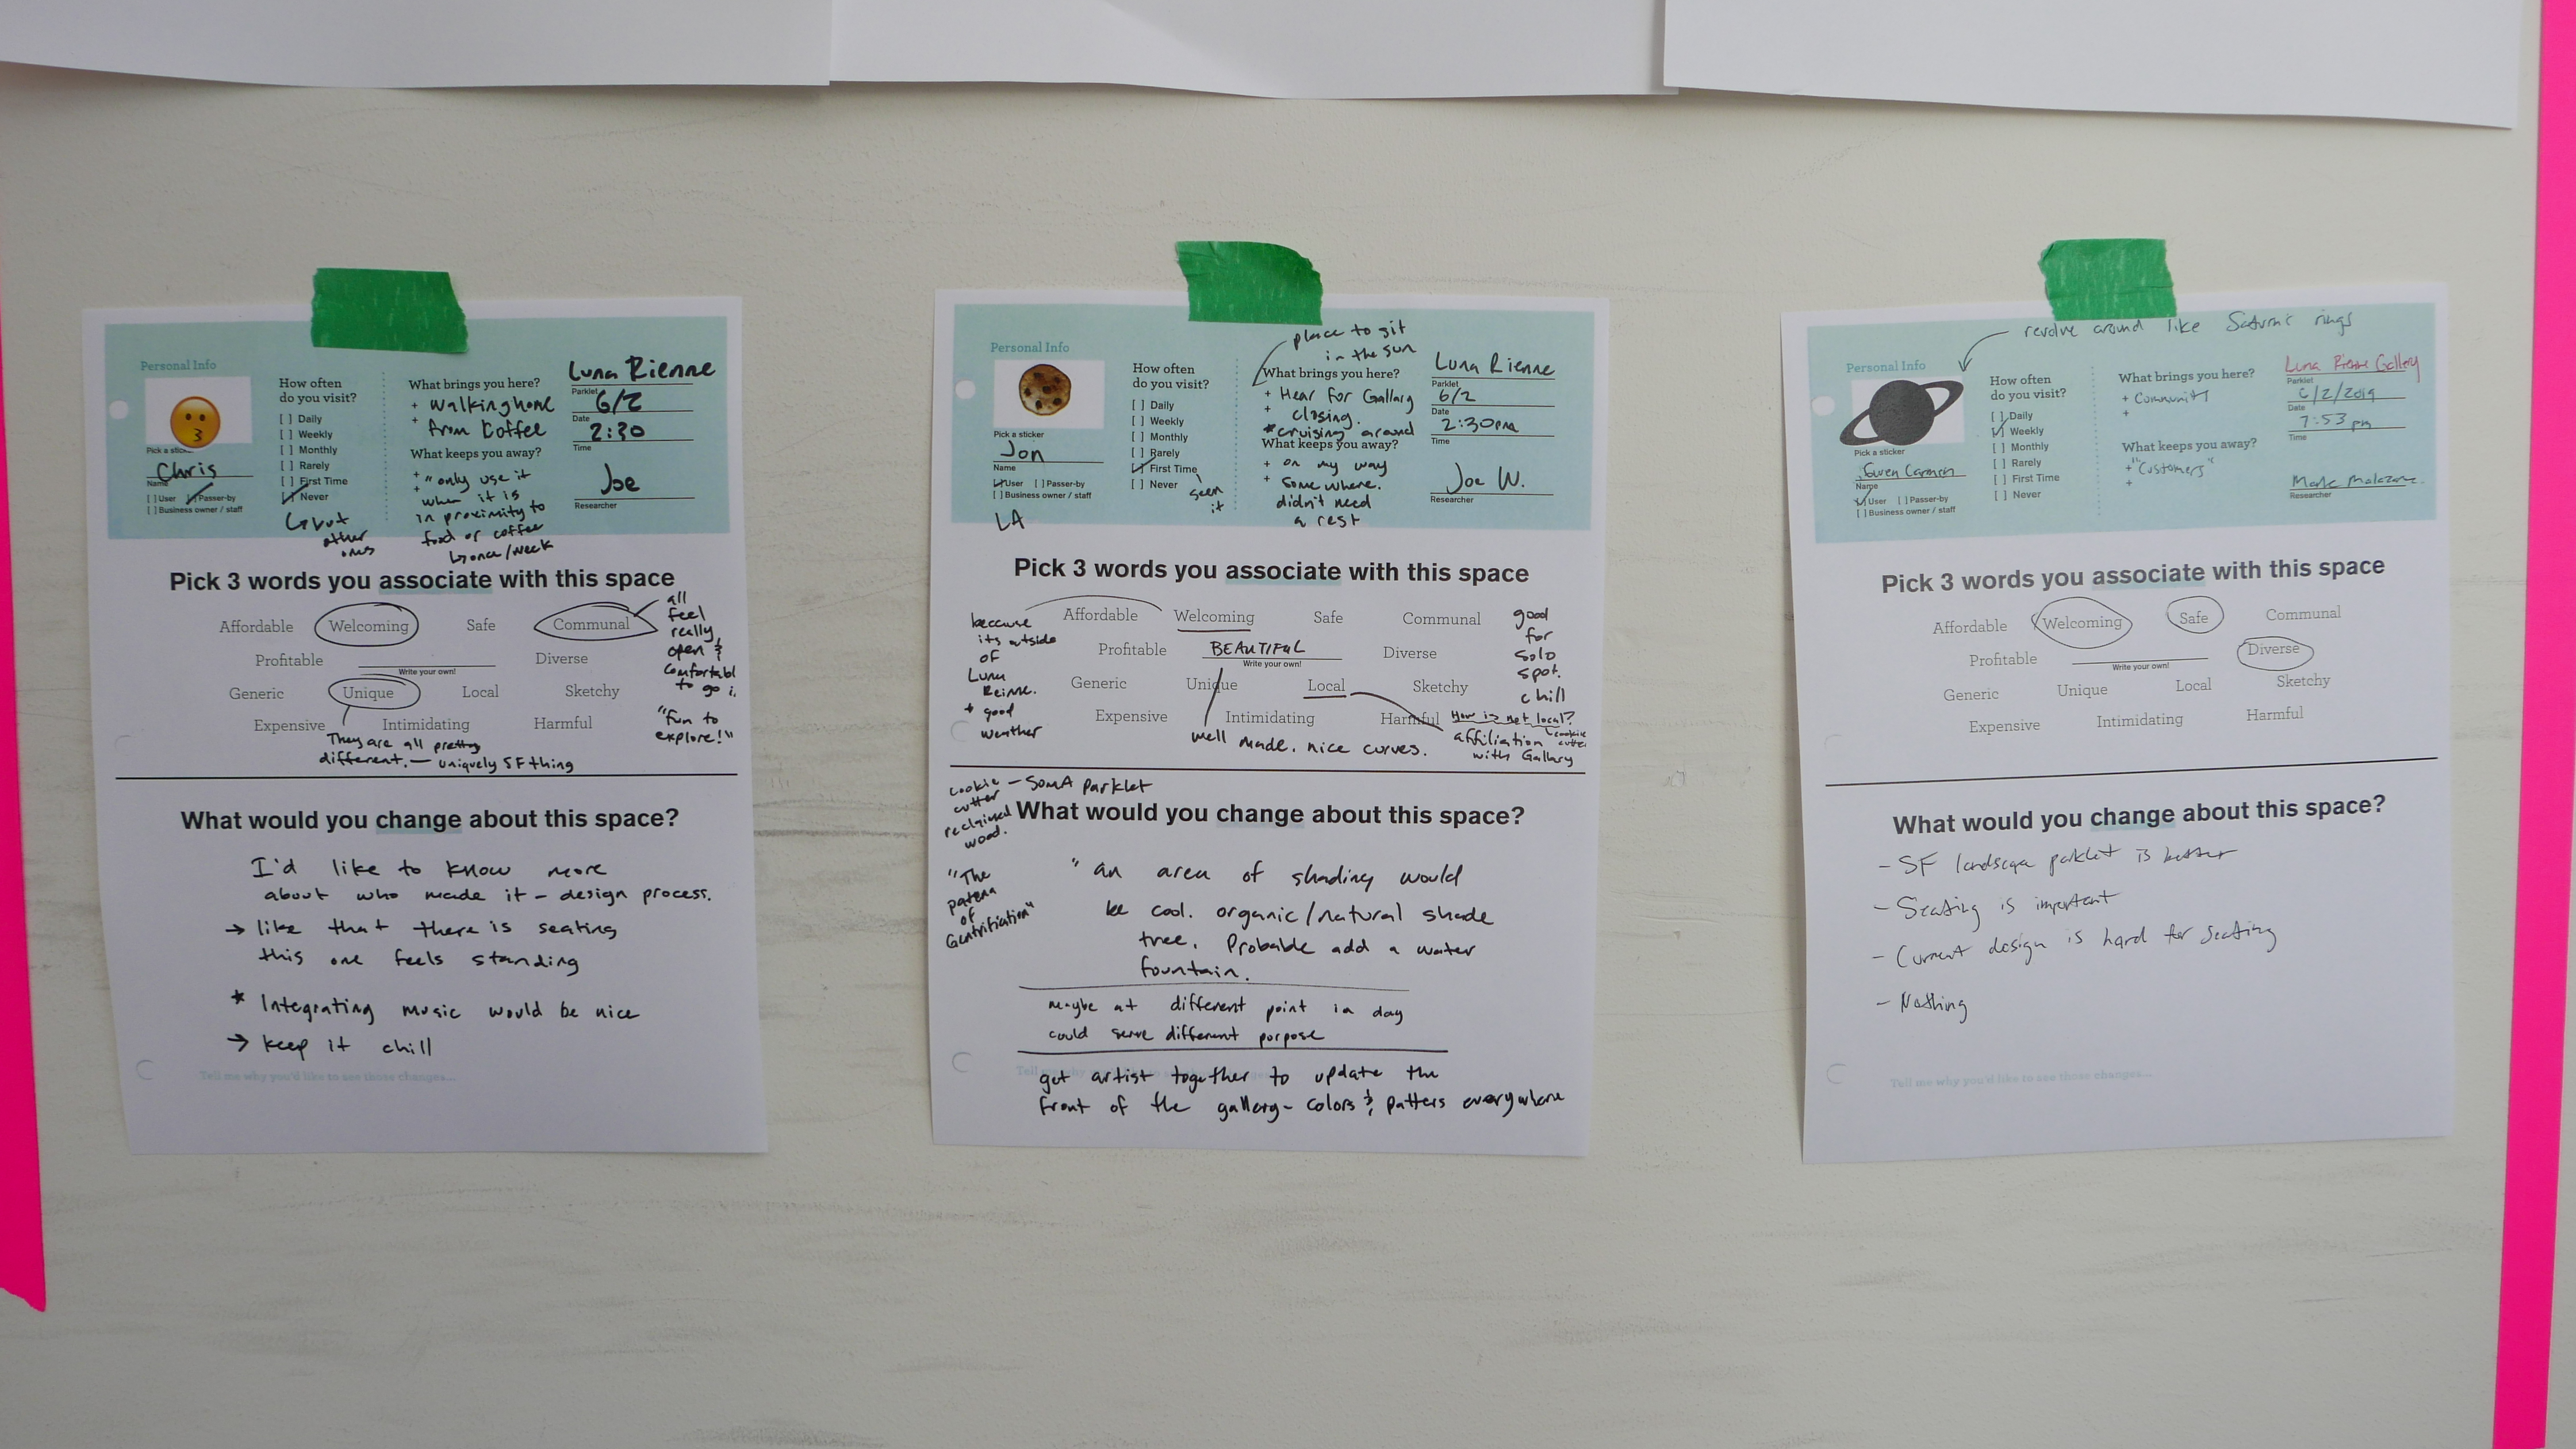
Openbox designed the field research materials and Stae helped in participating in their various ethnographic research methods.
Responsibilities
- Ethnographic Research
- Interviews
- Photography
- Video
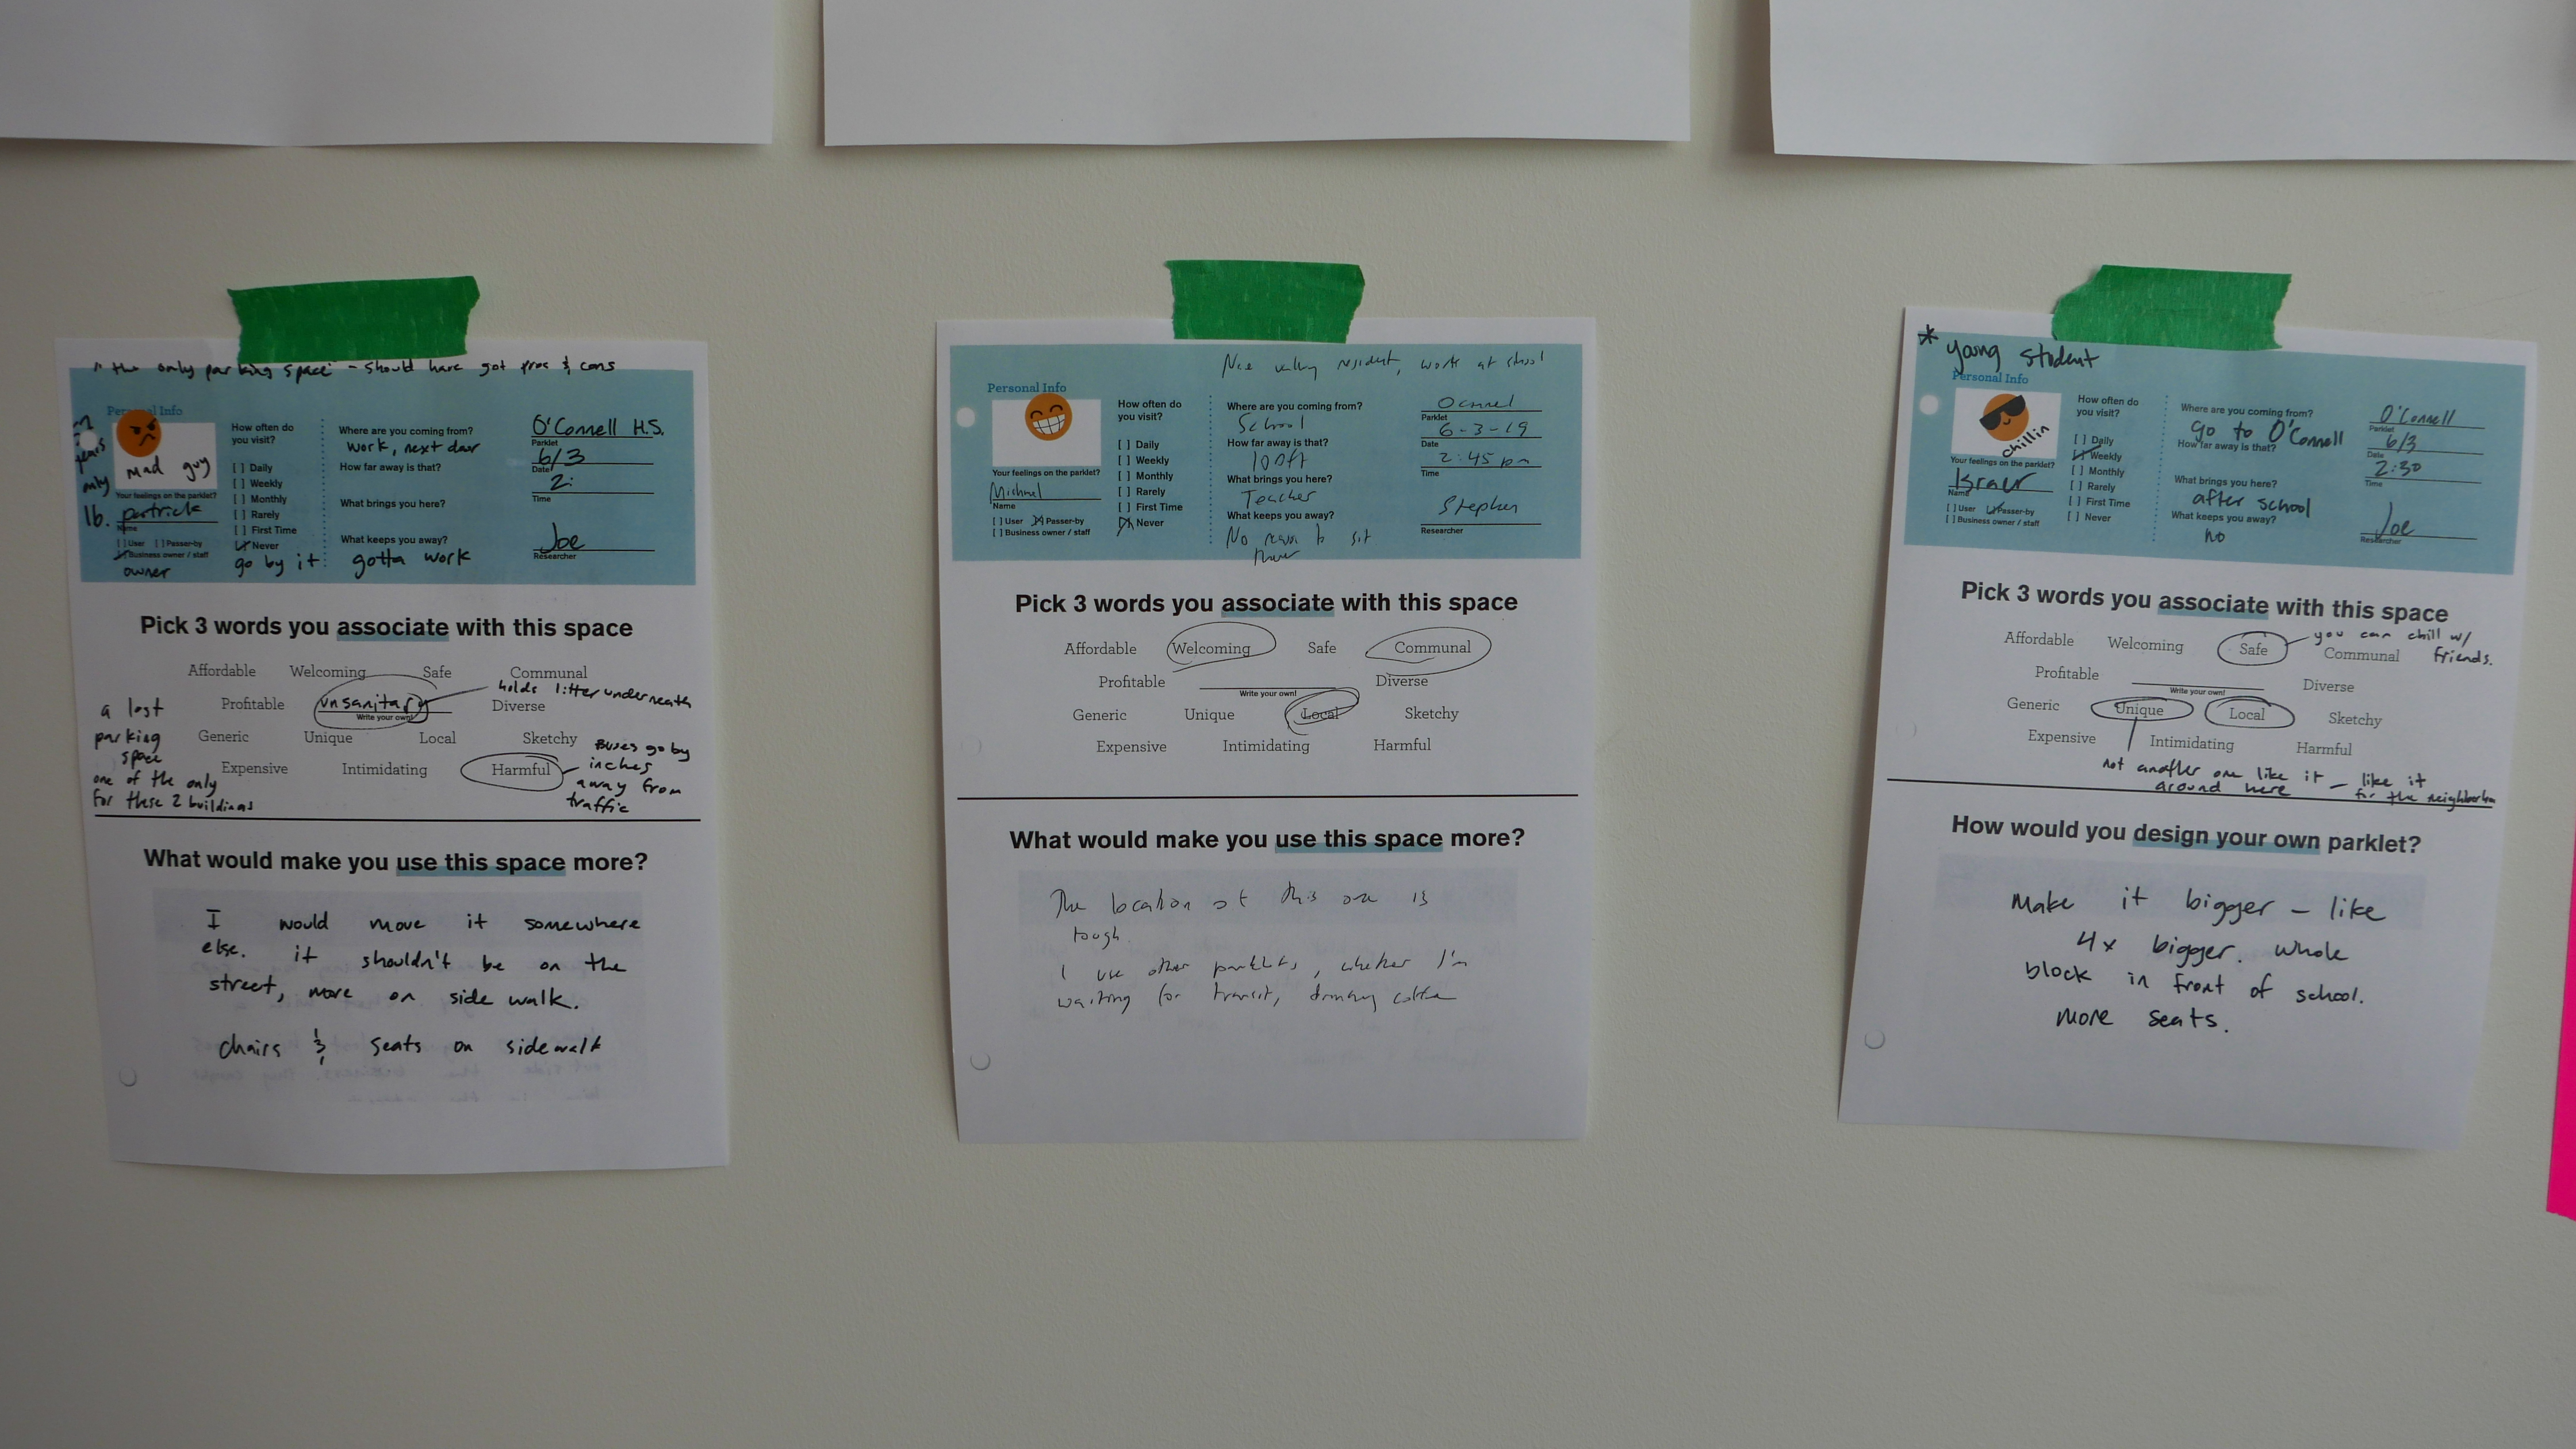
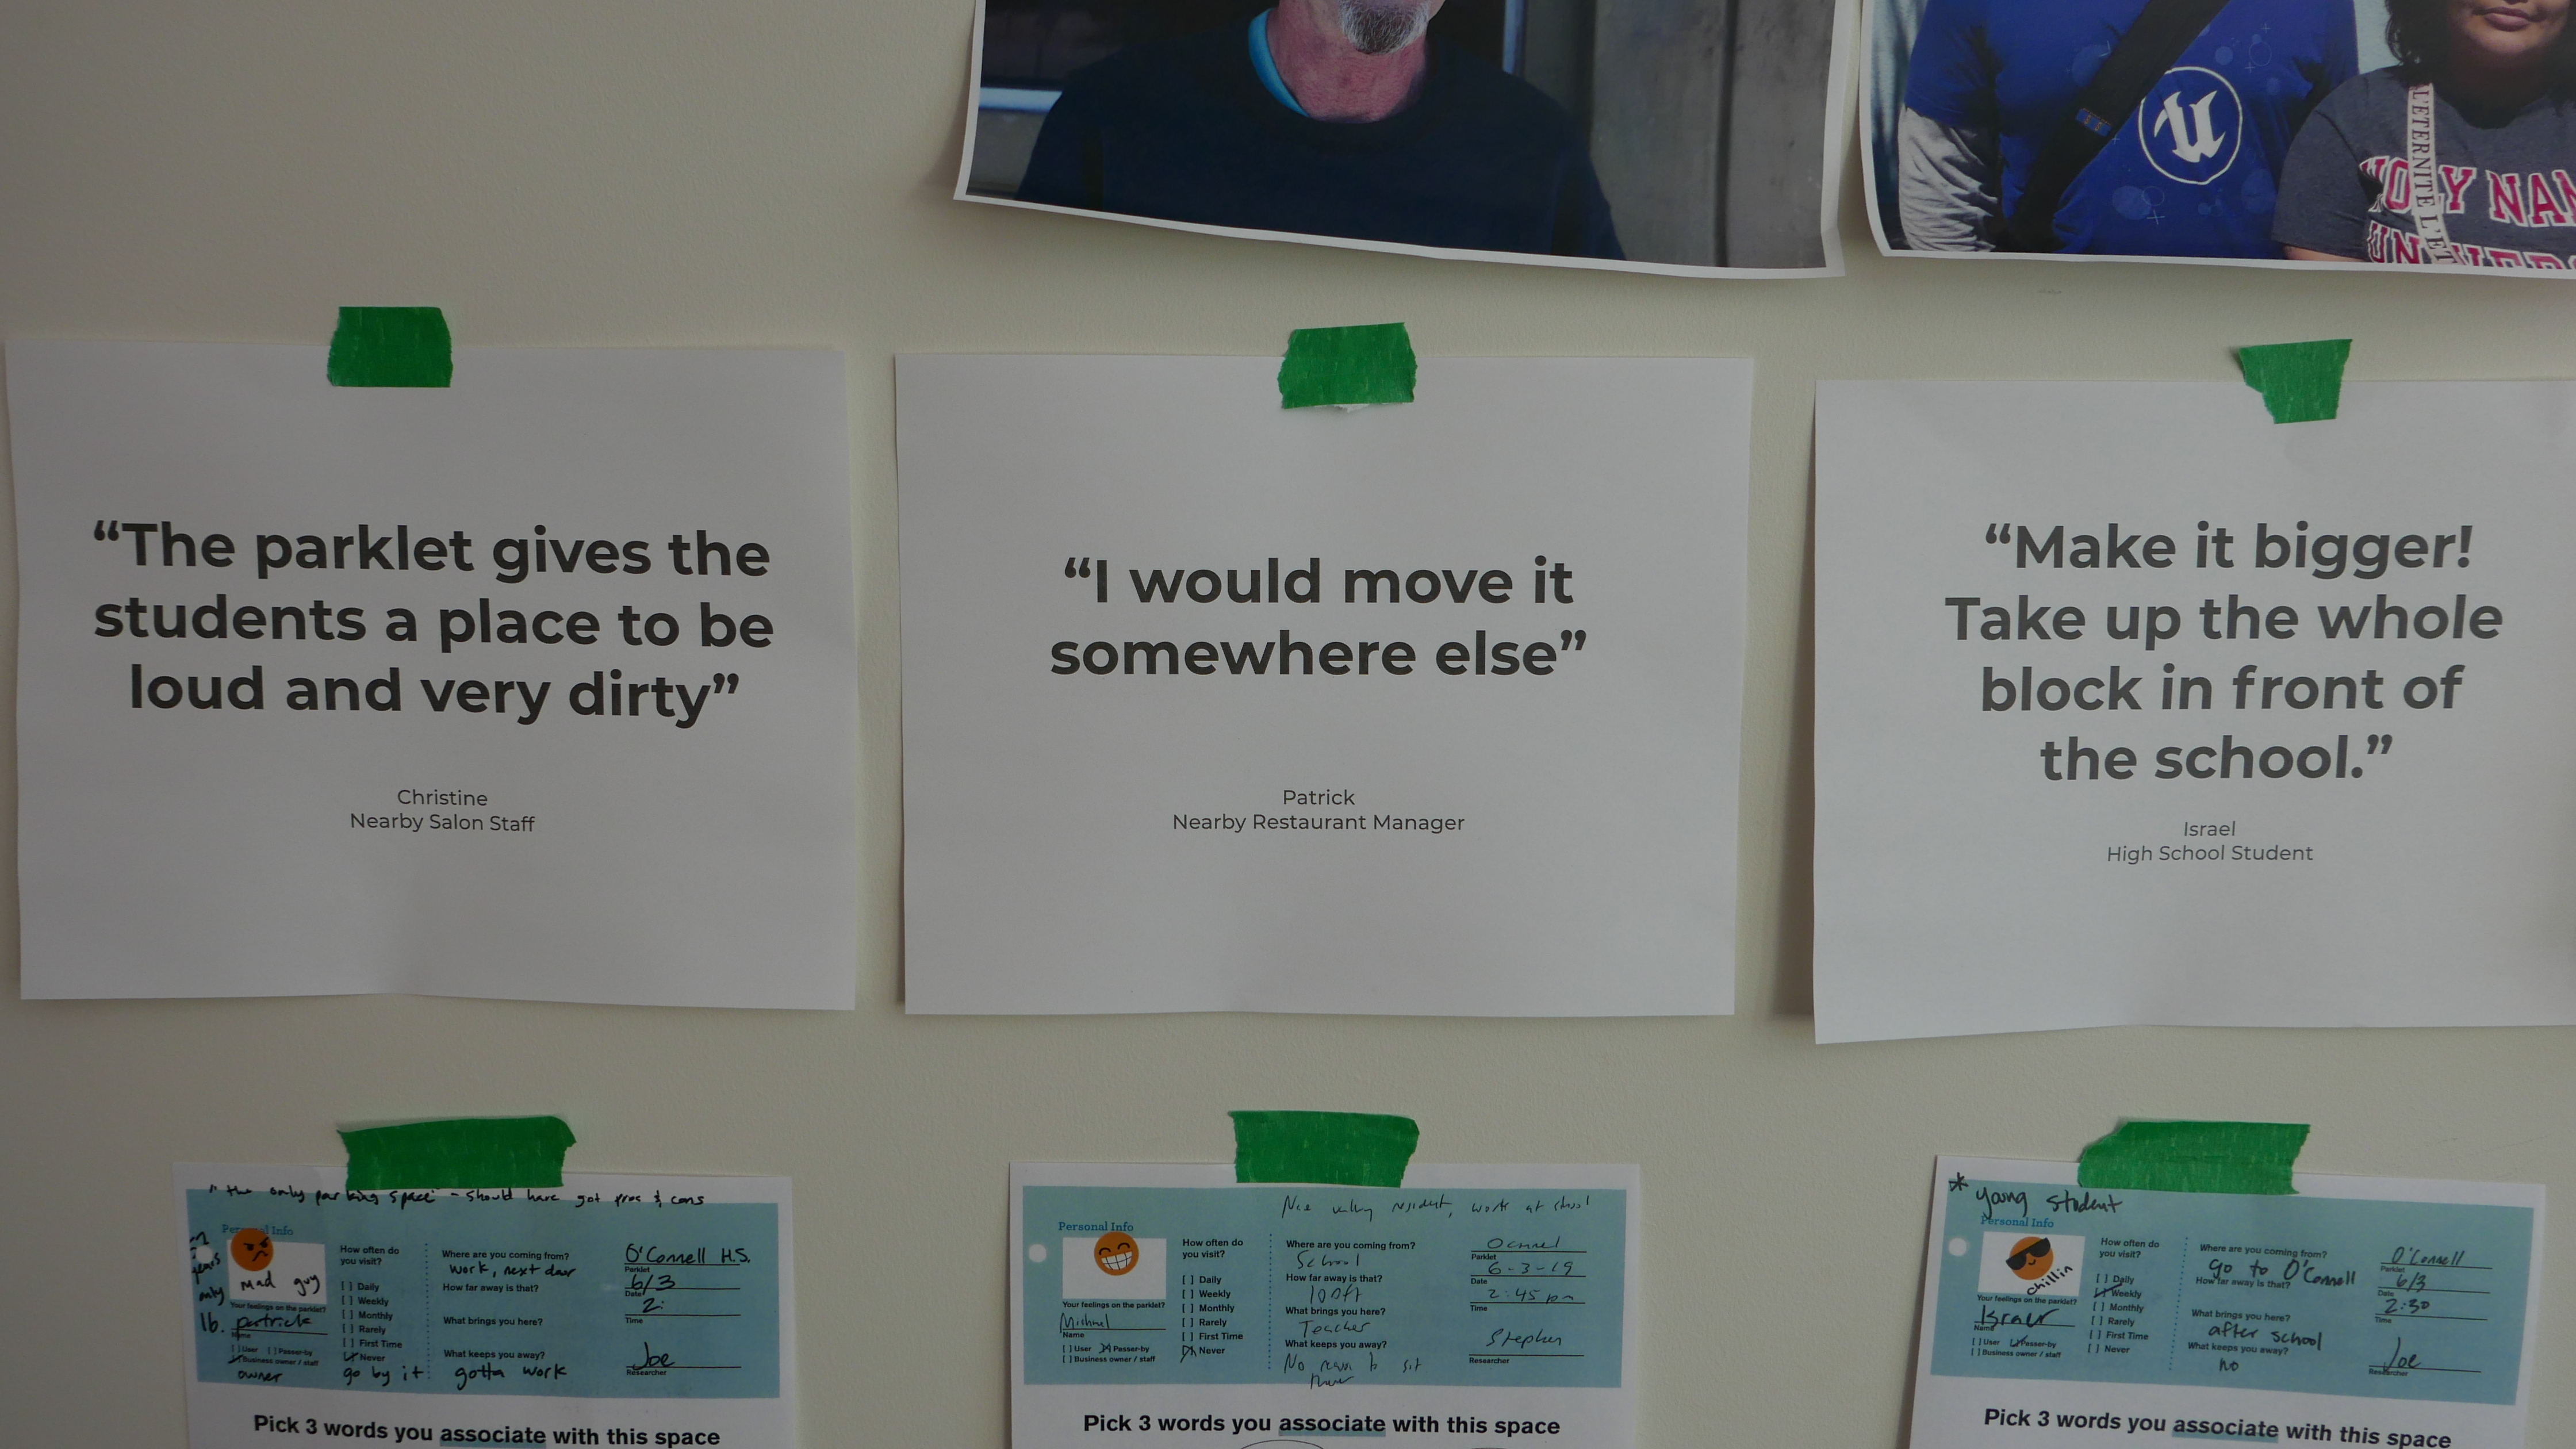
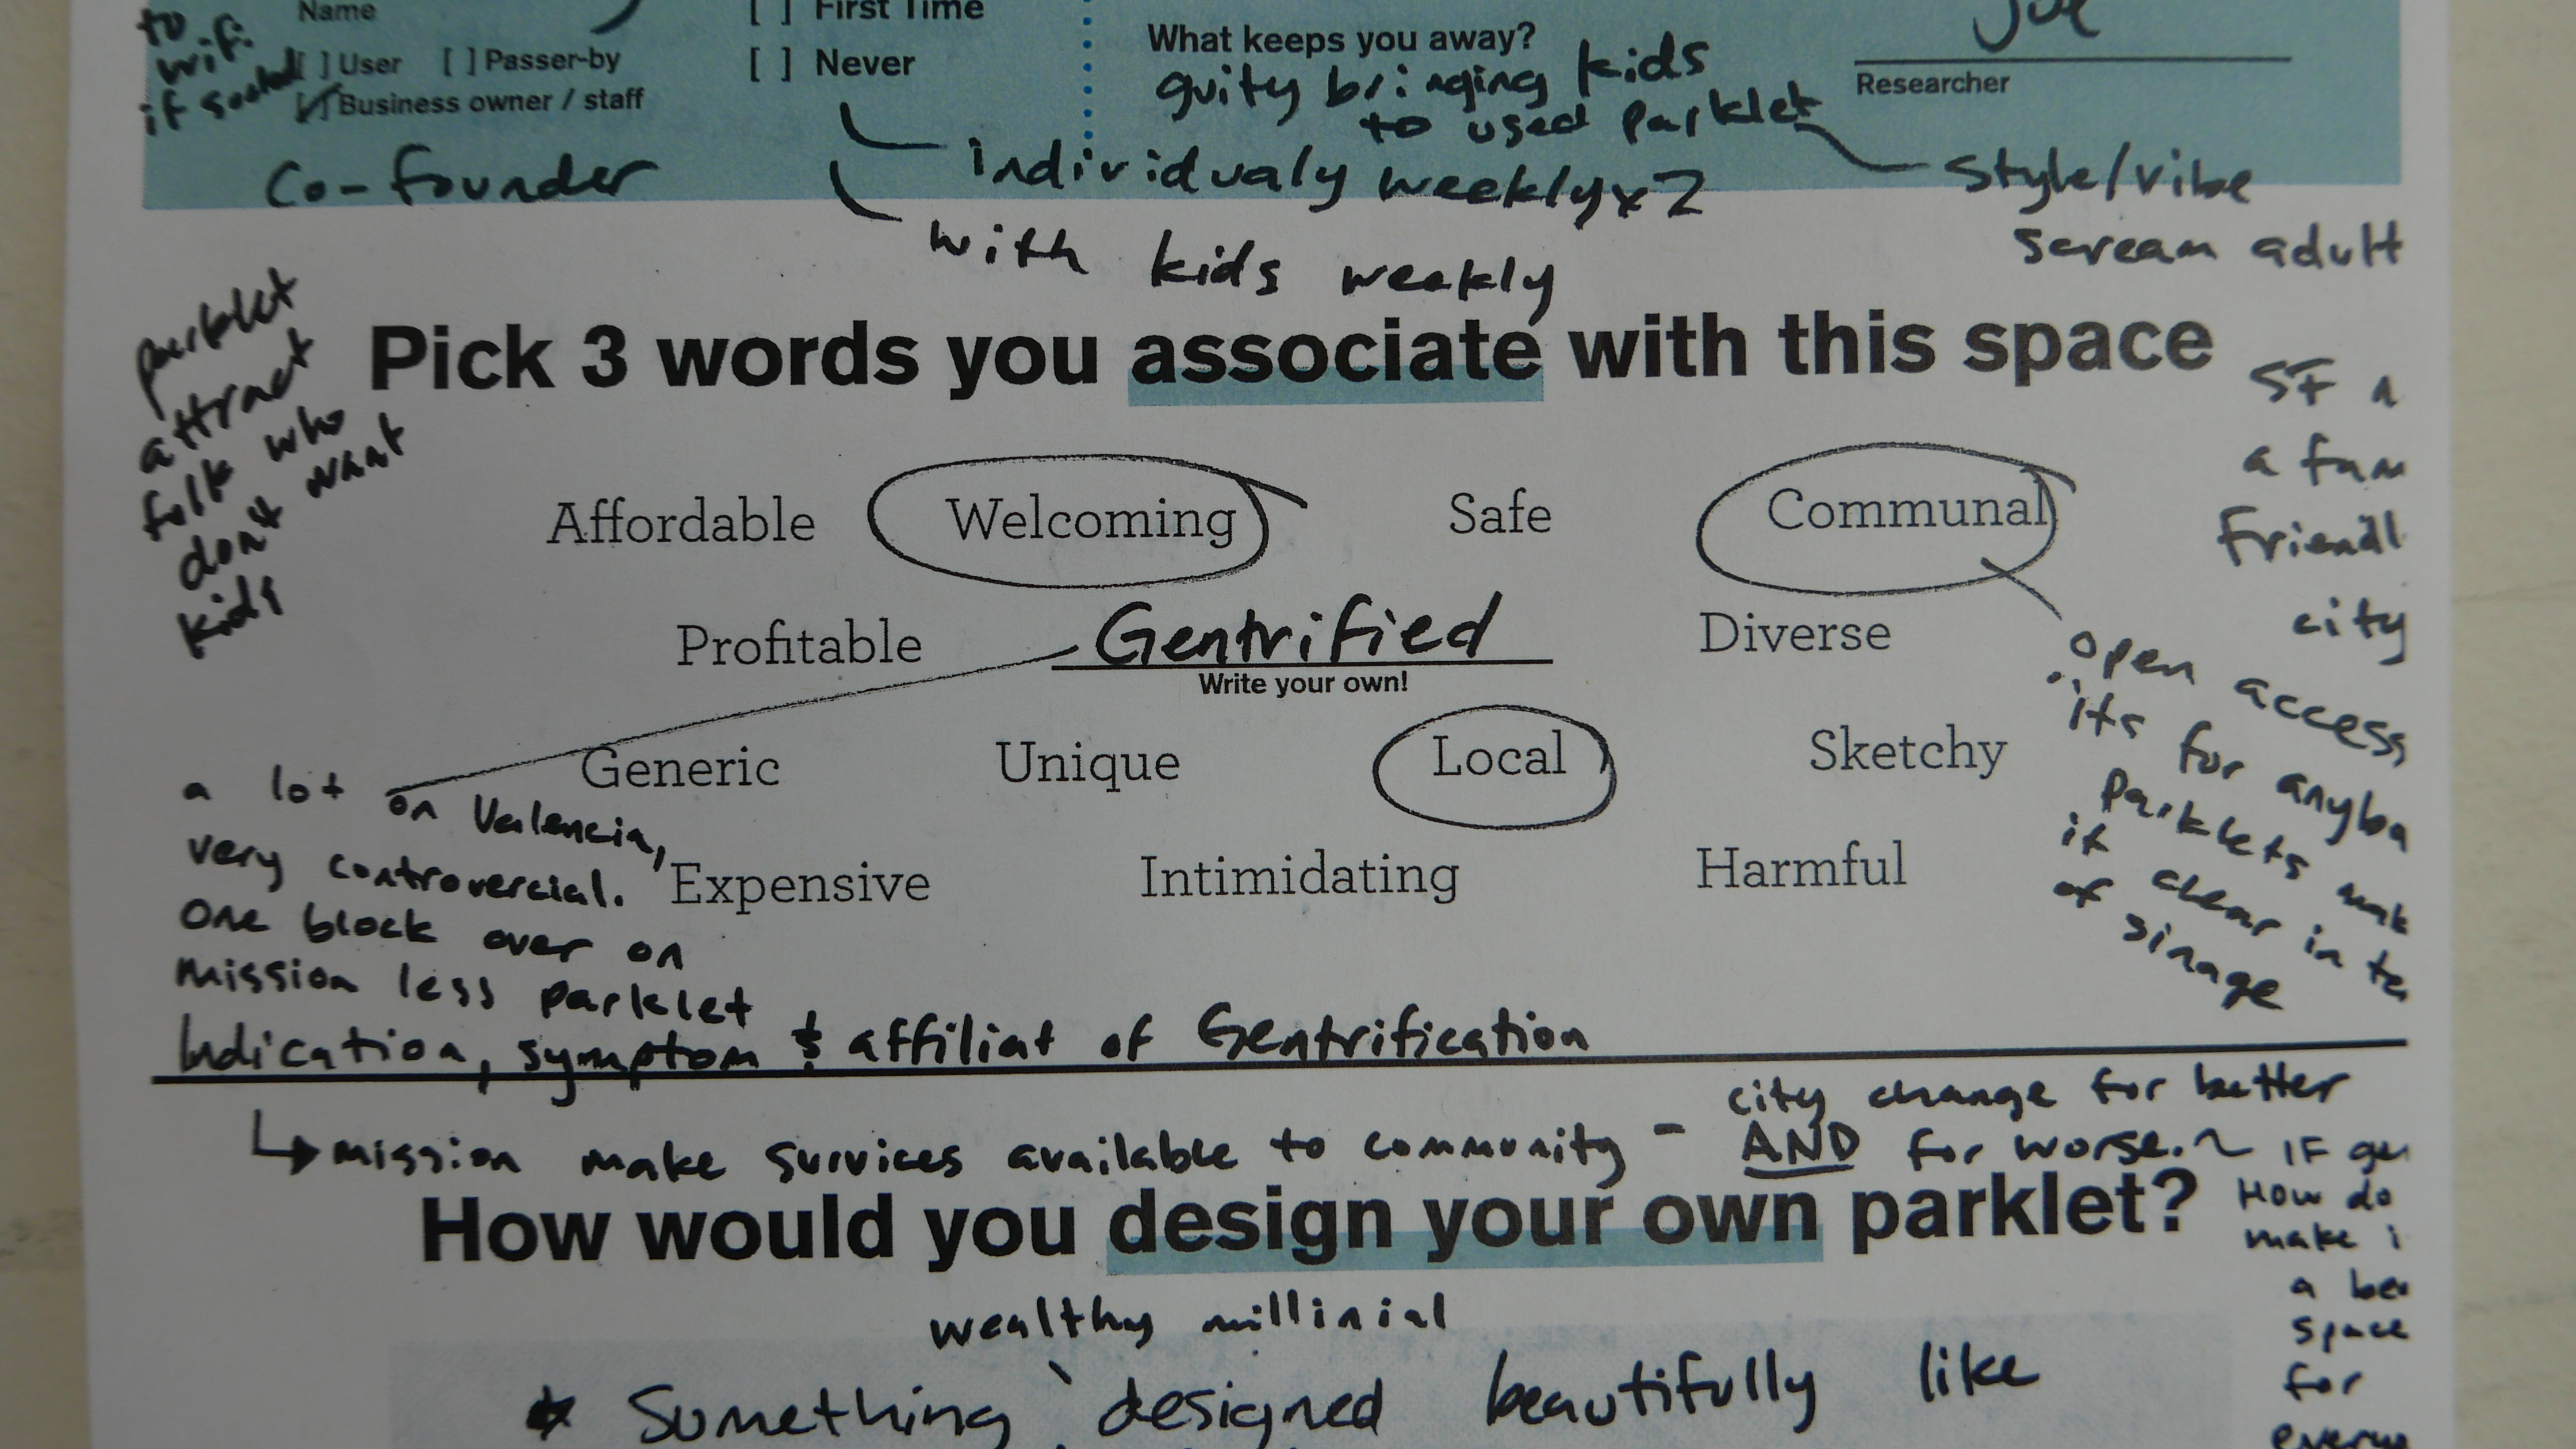
- Intercept Surveys
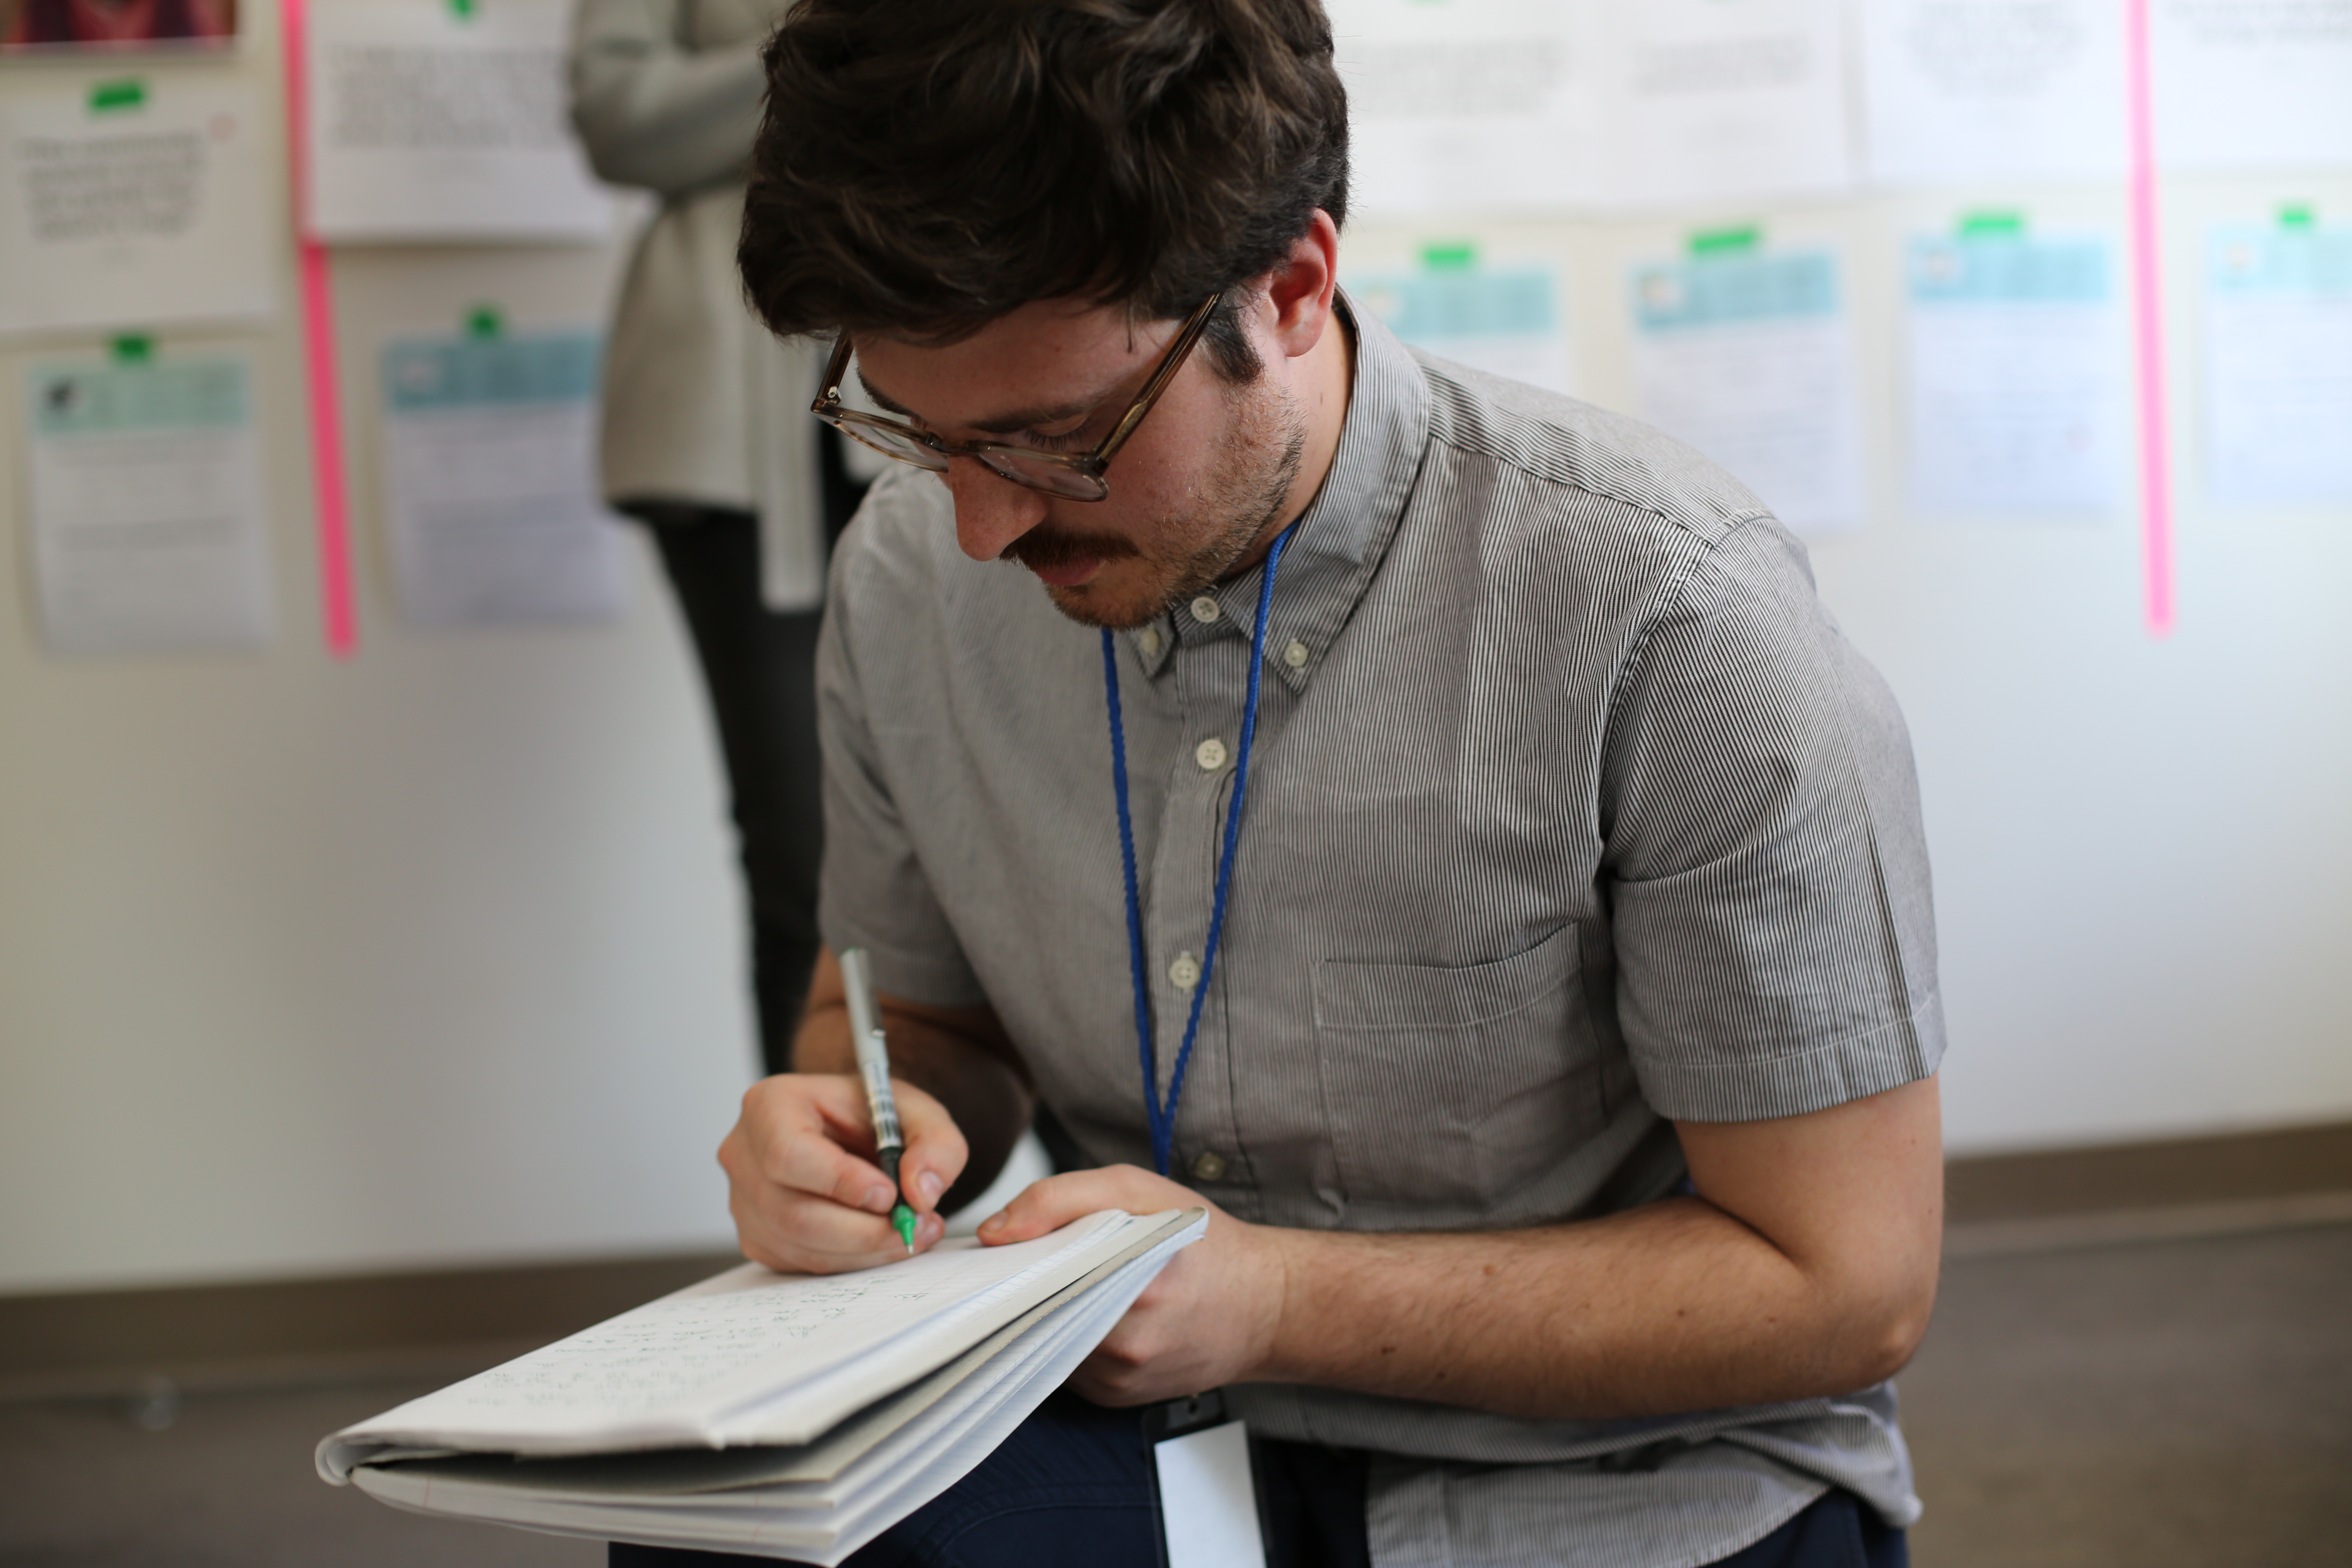
- Observation & Notes
Test


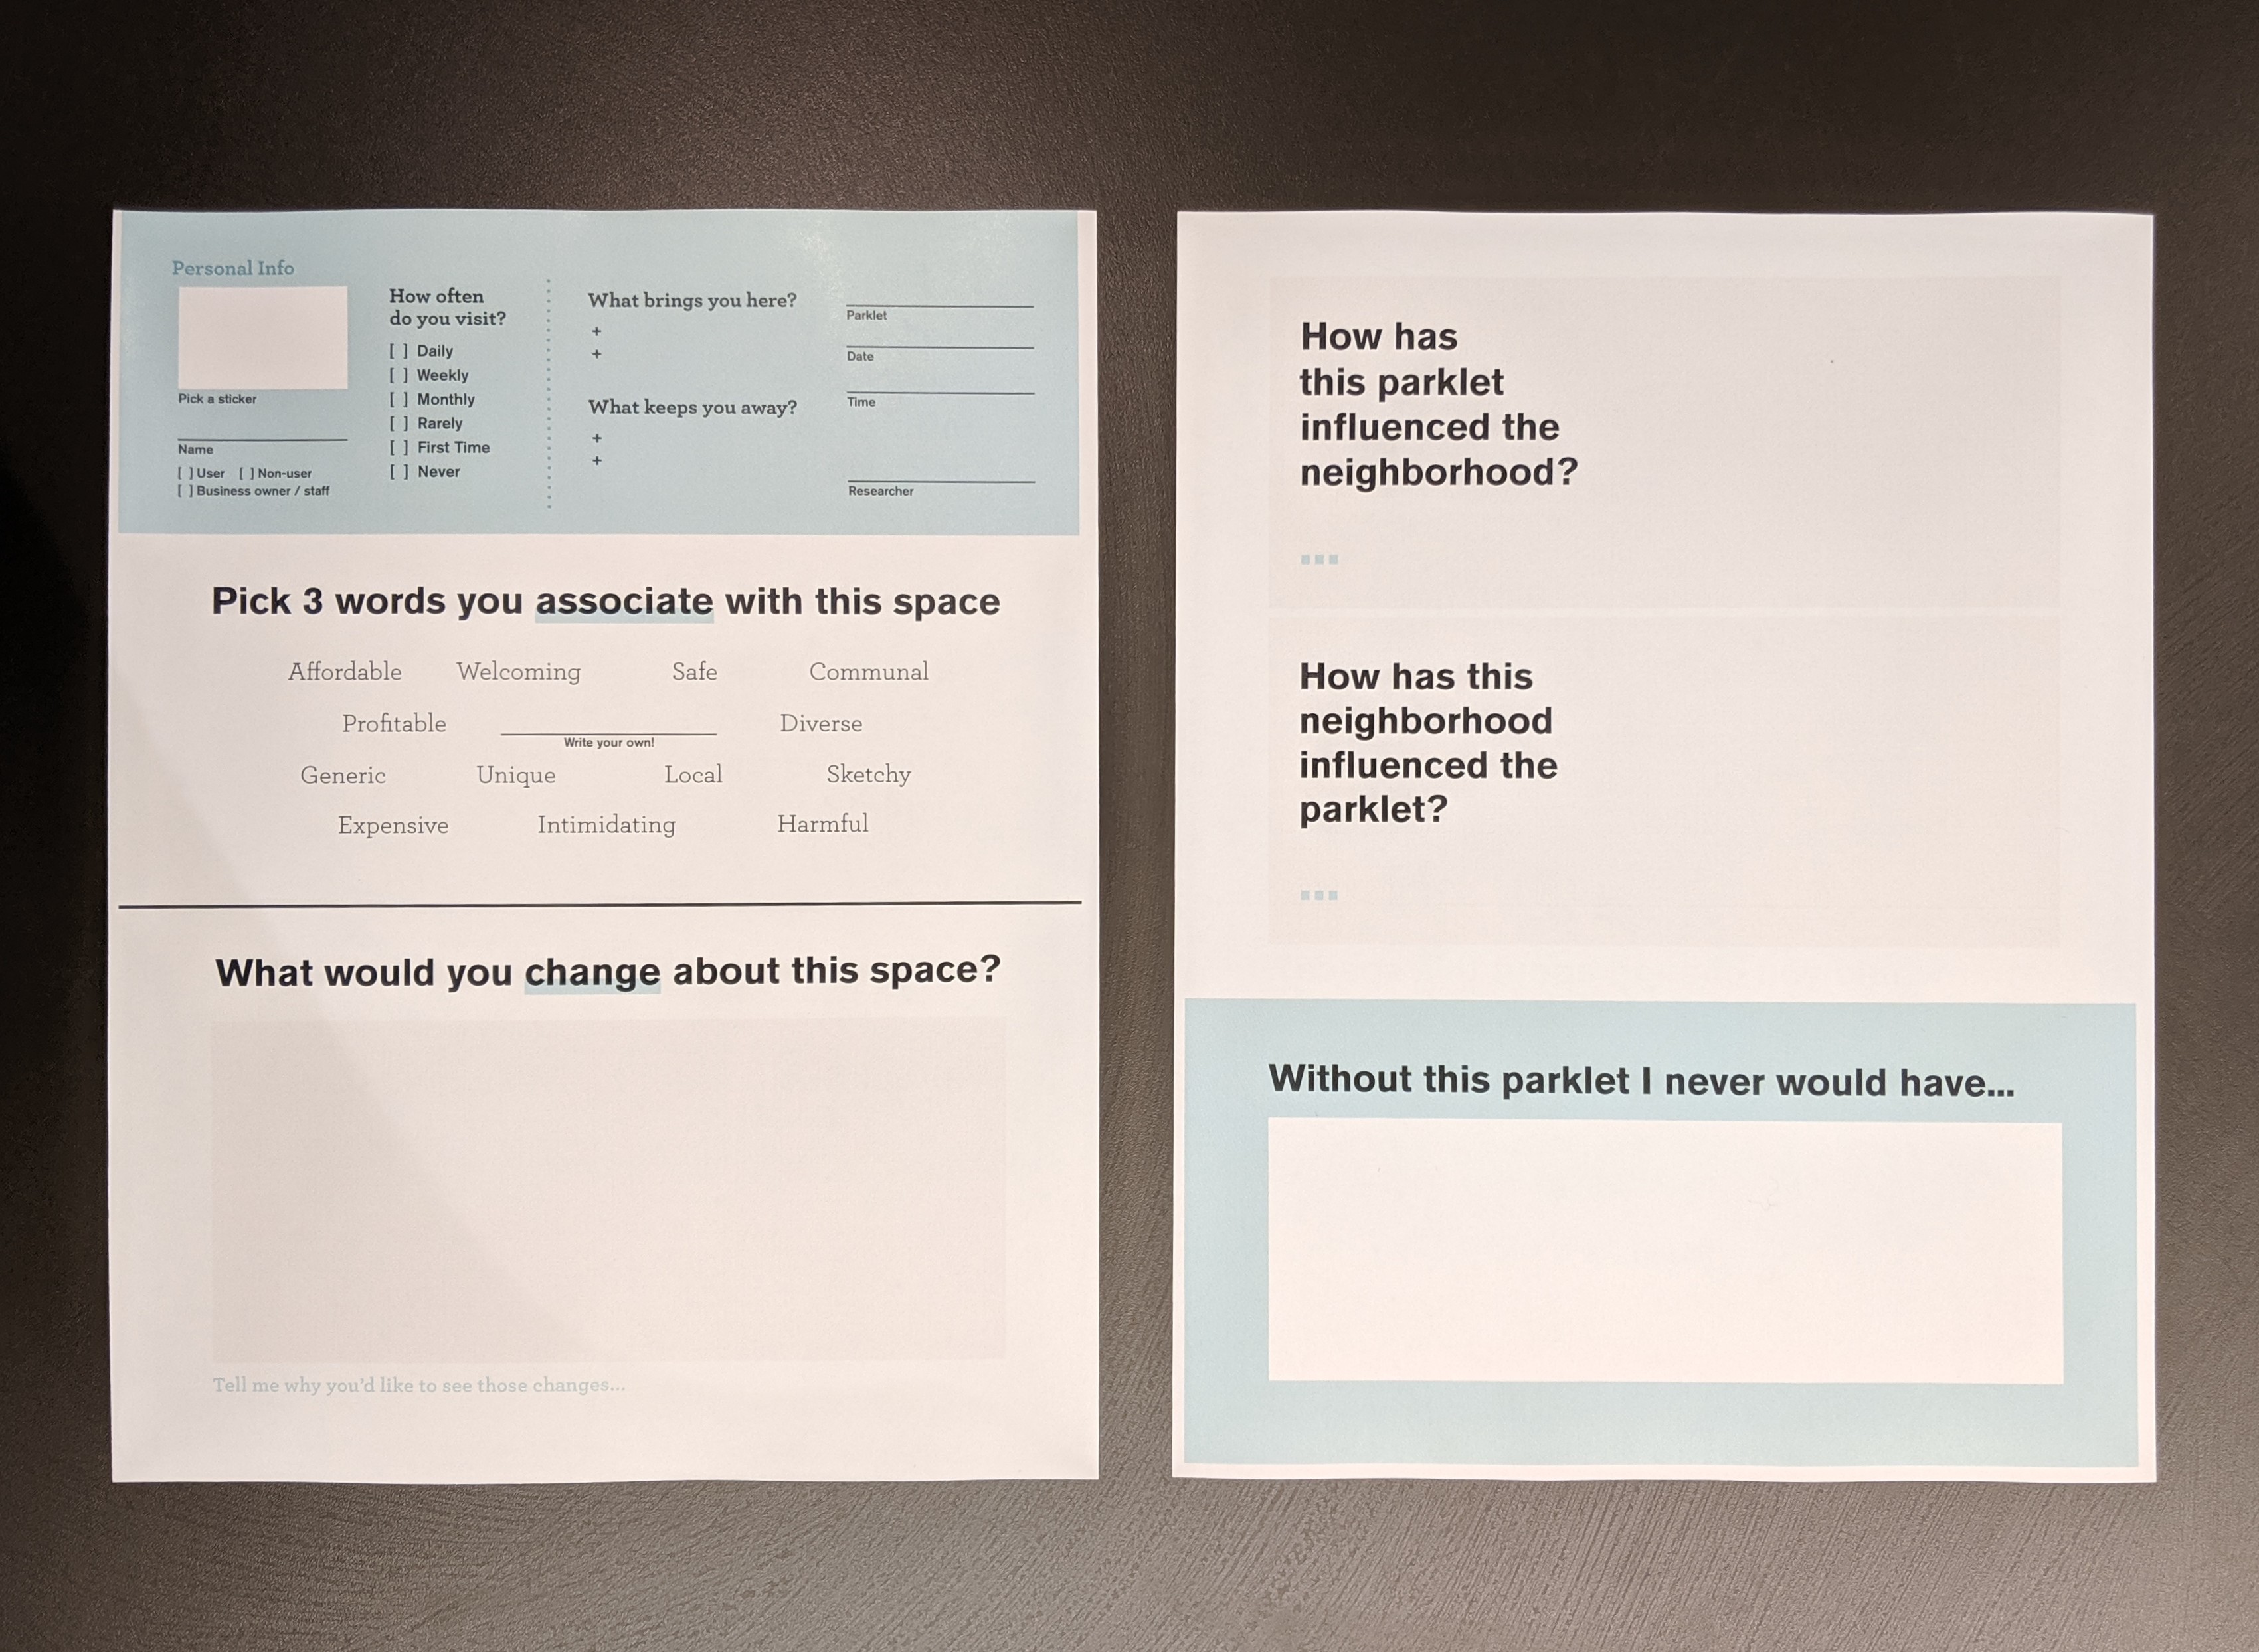



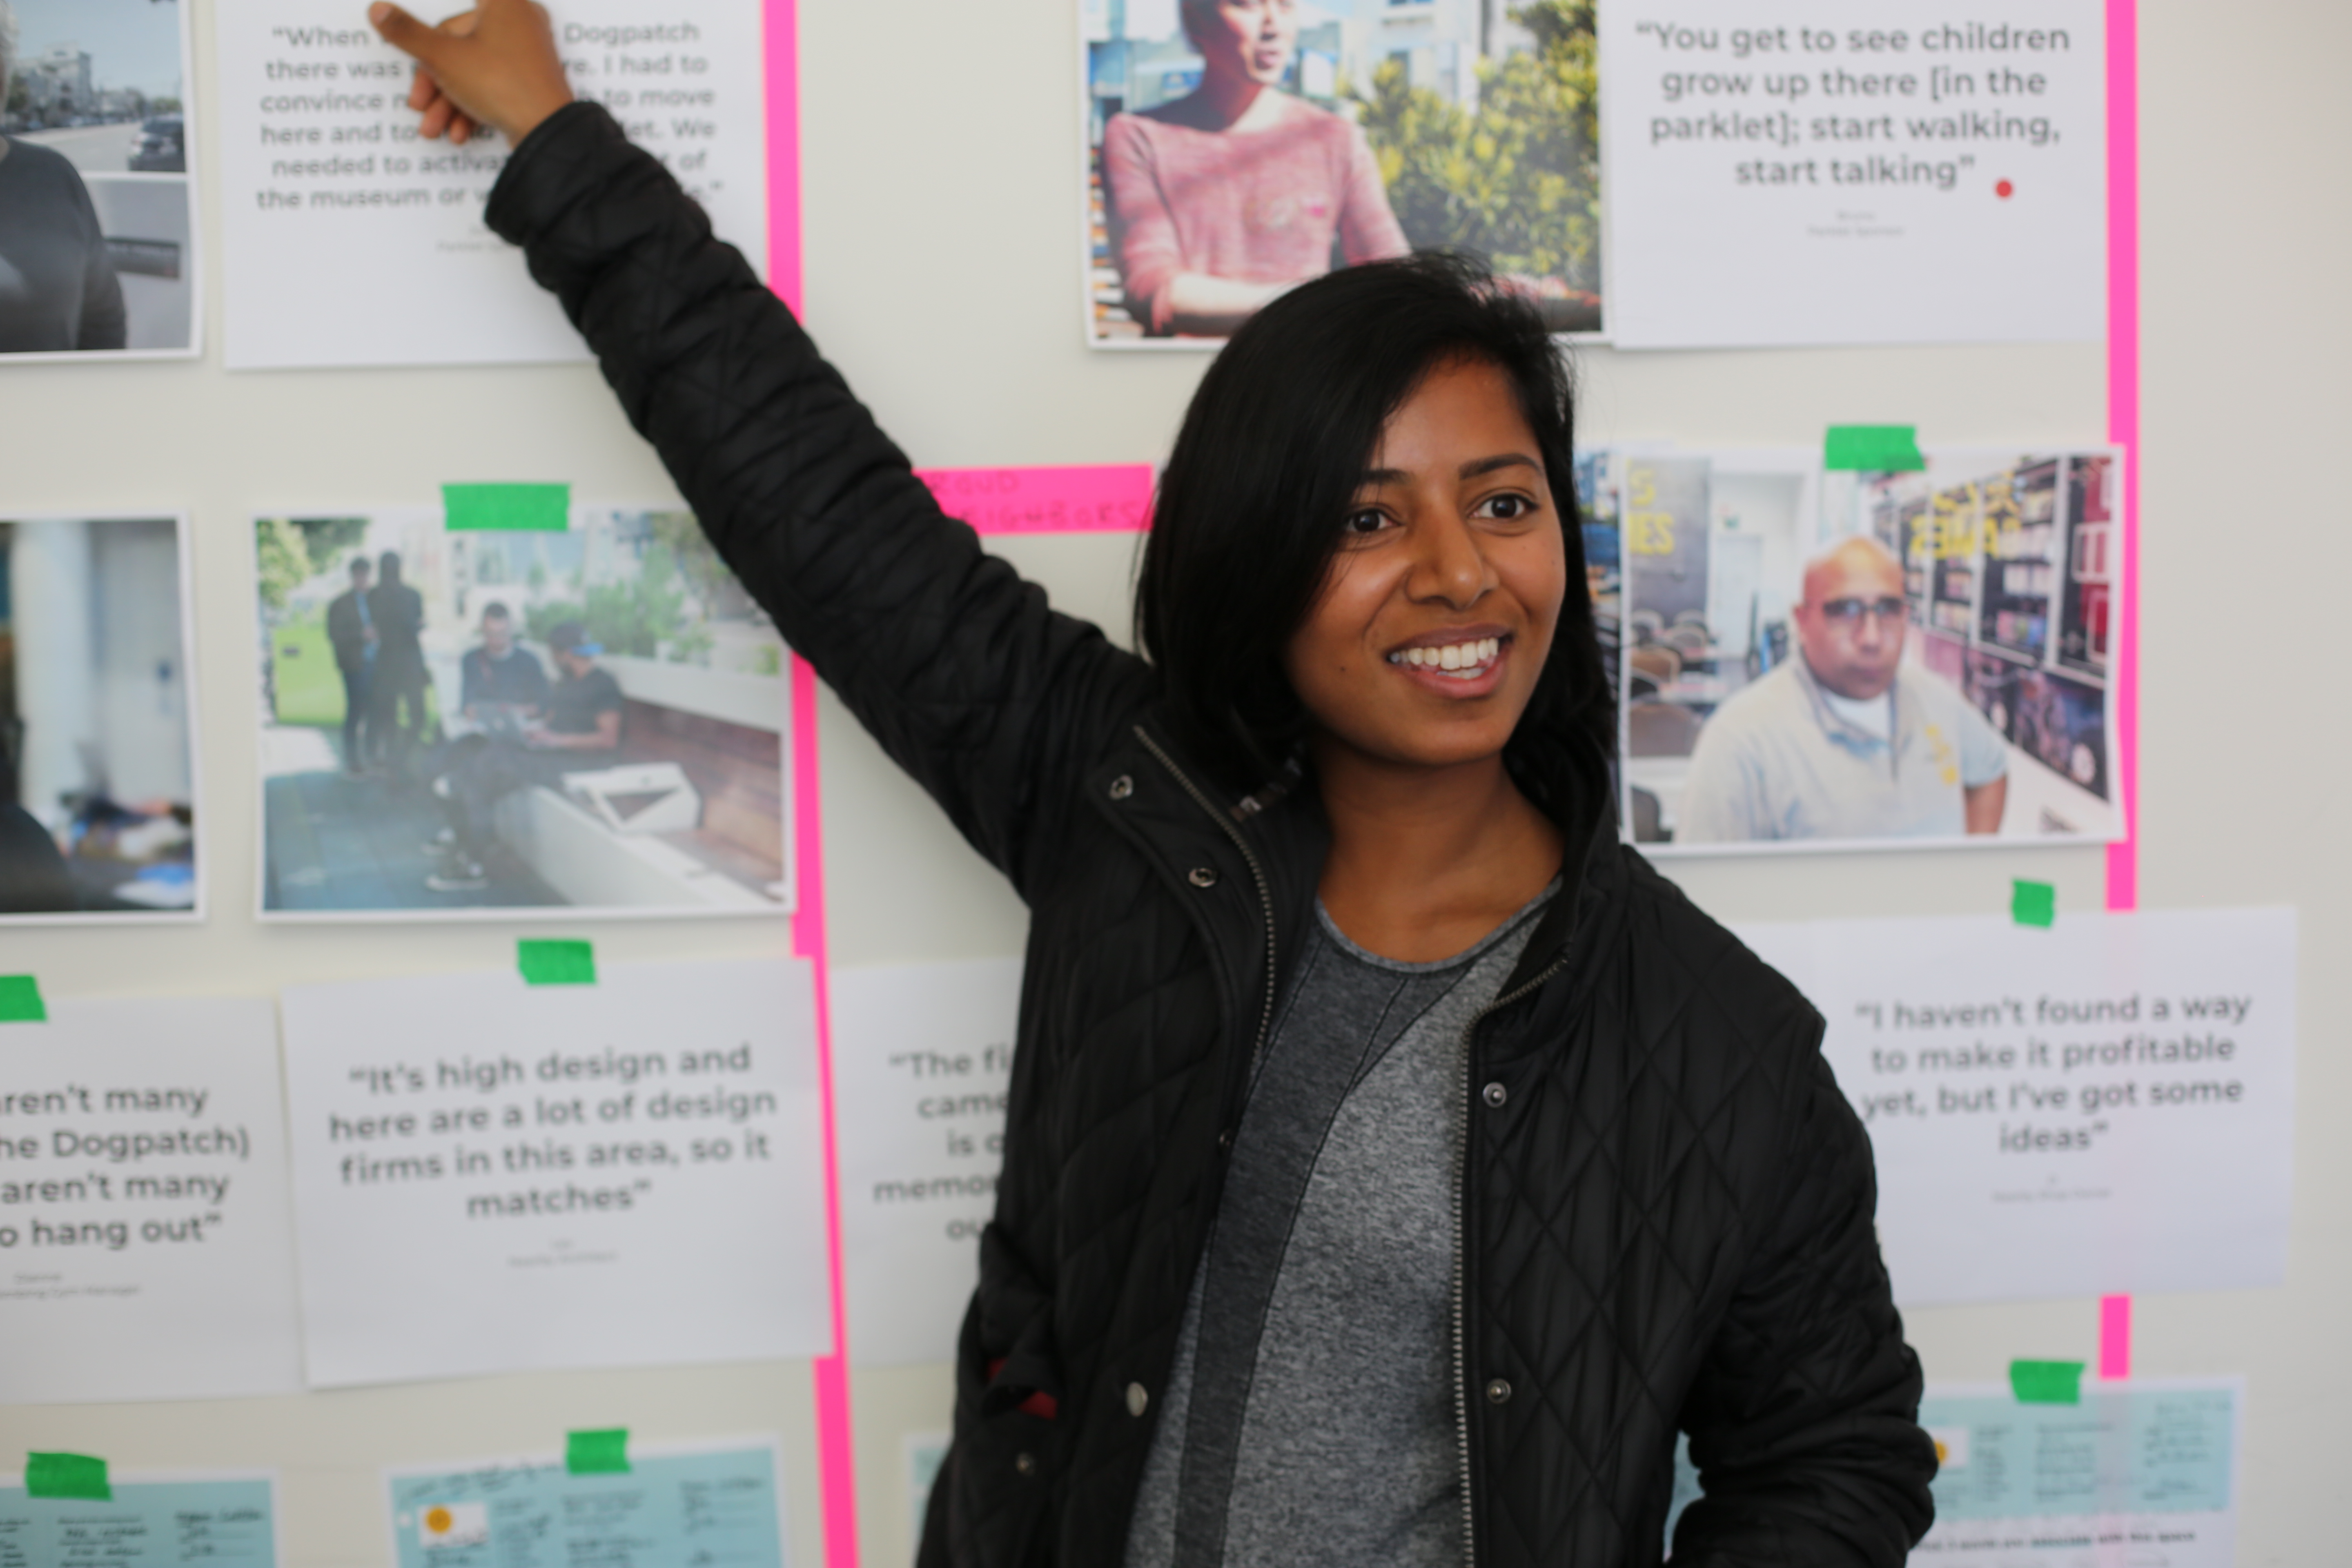
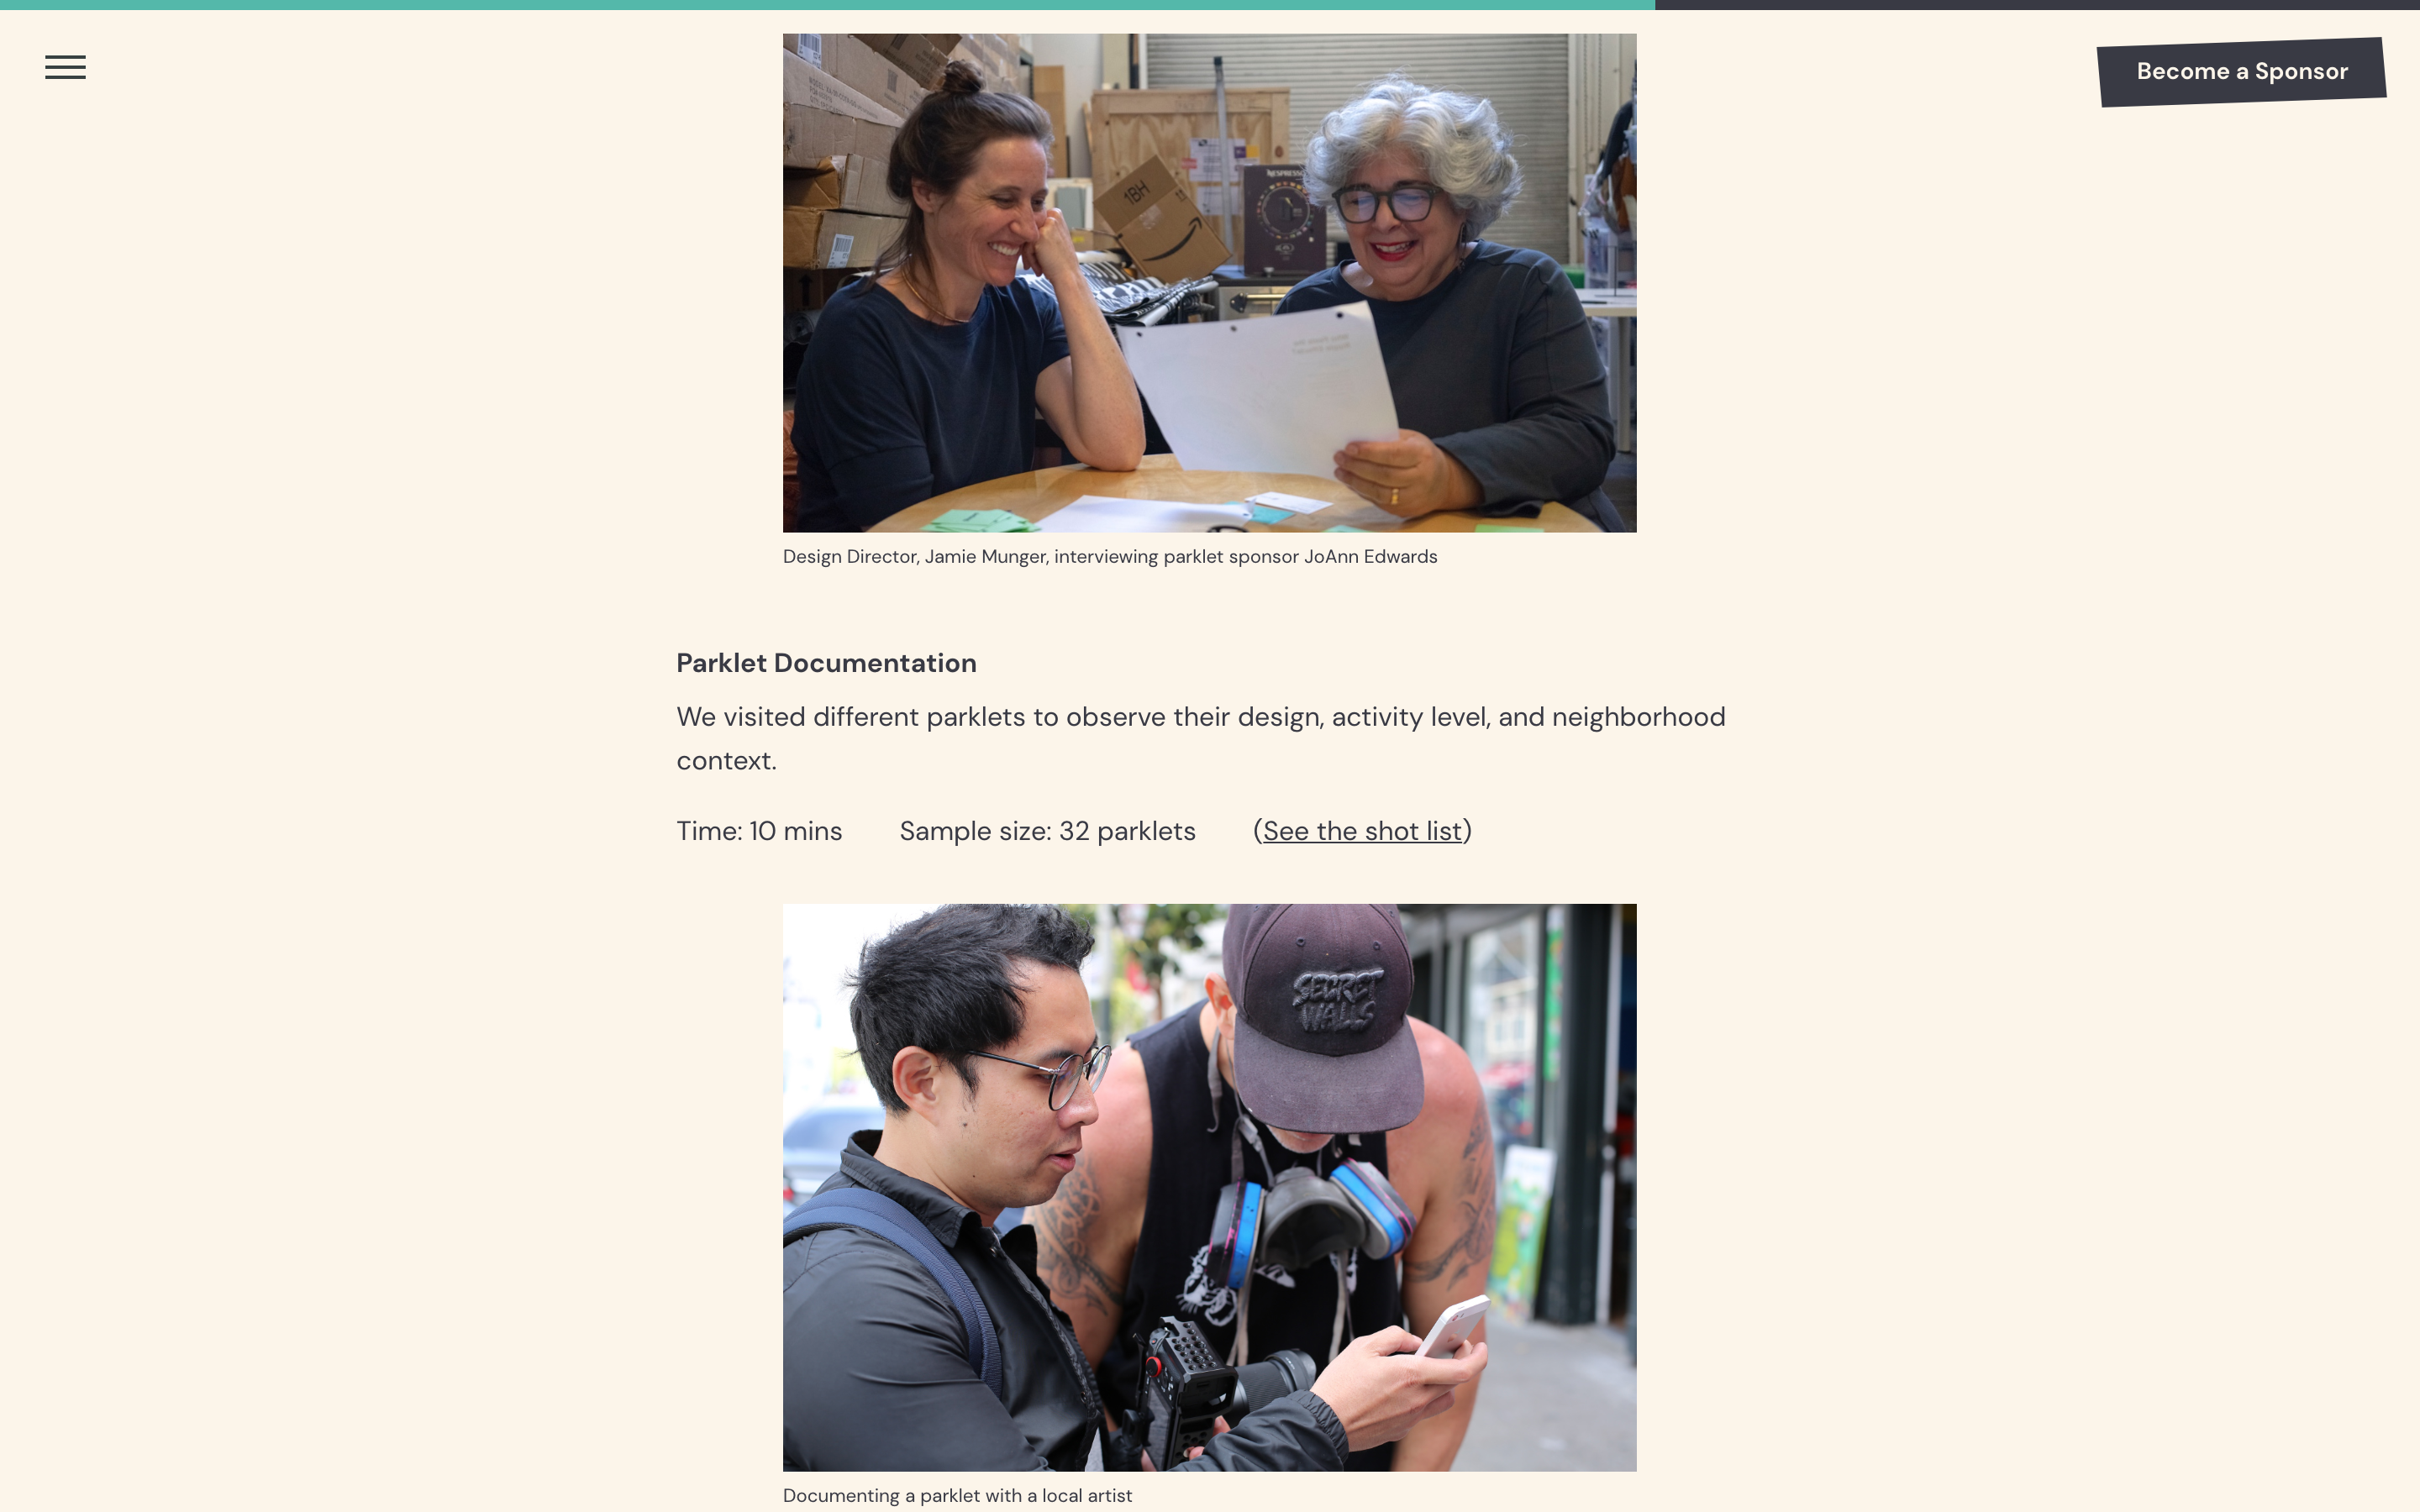
Sponsor & Expert Interviews



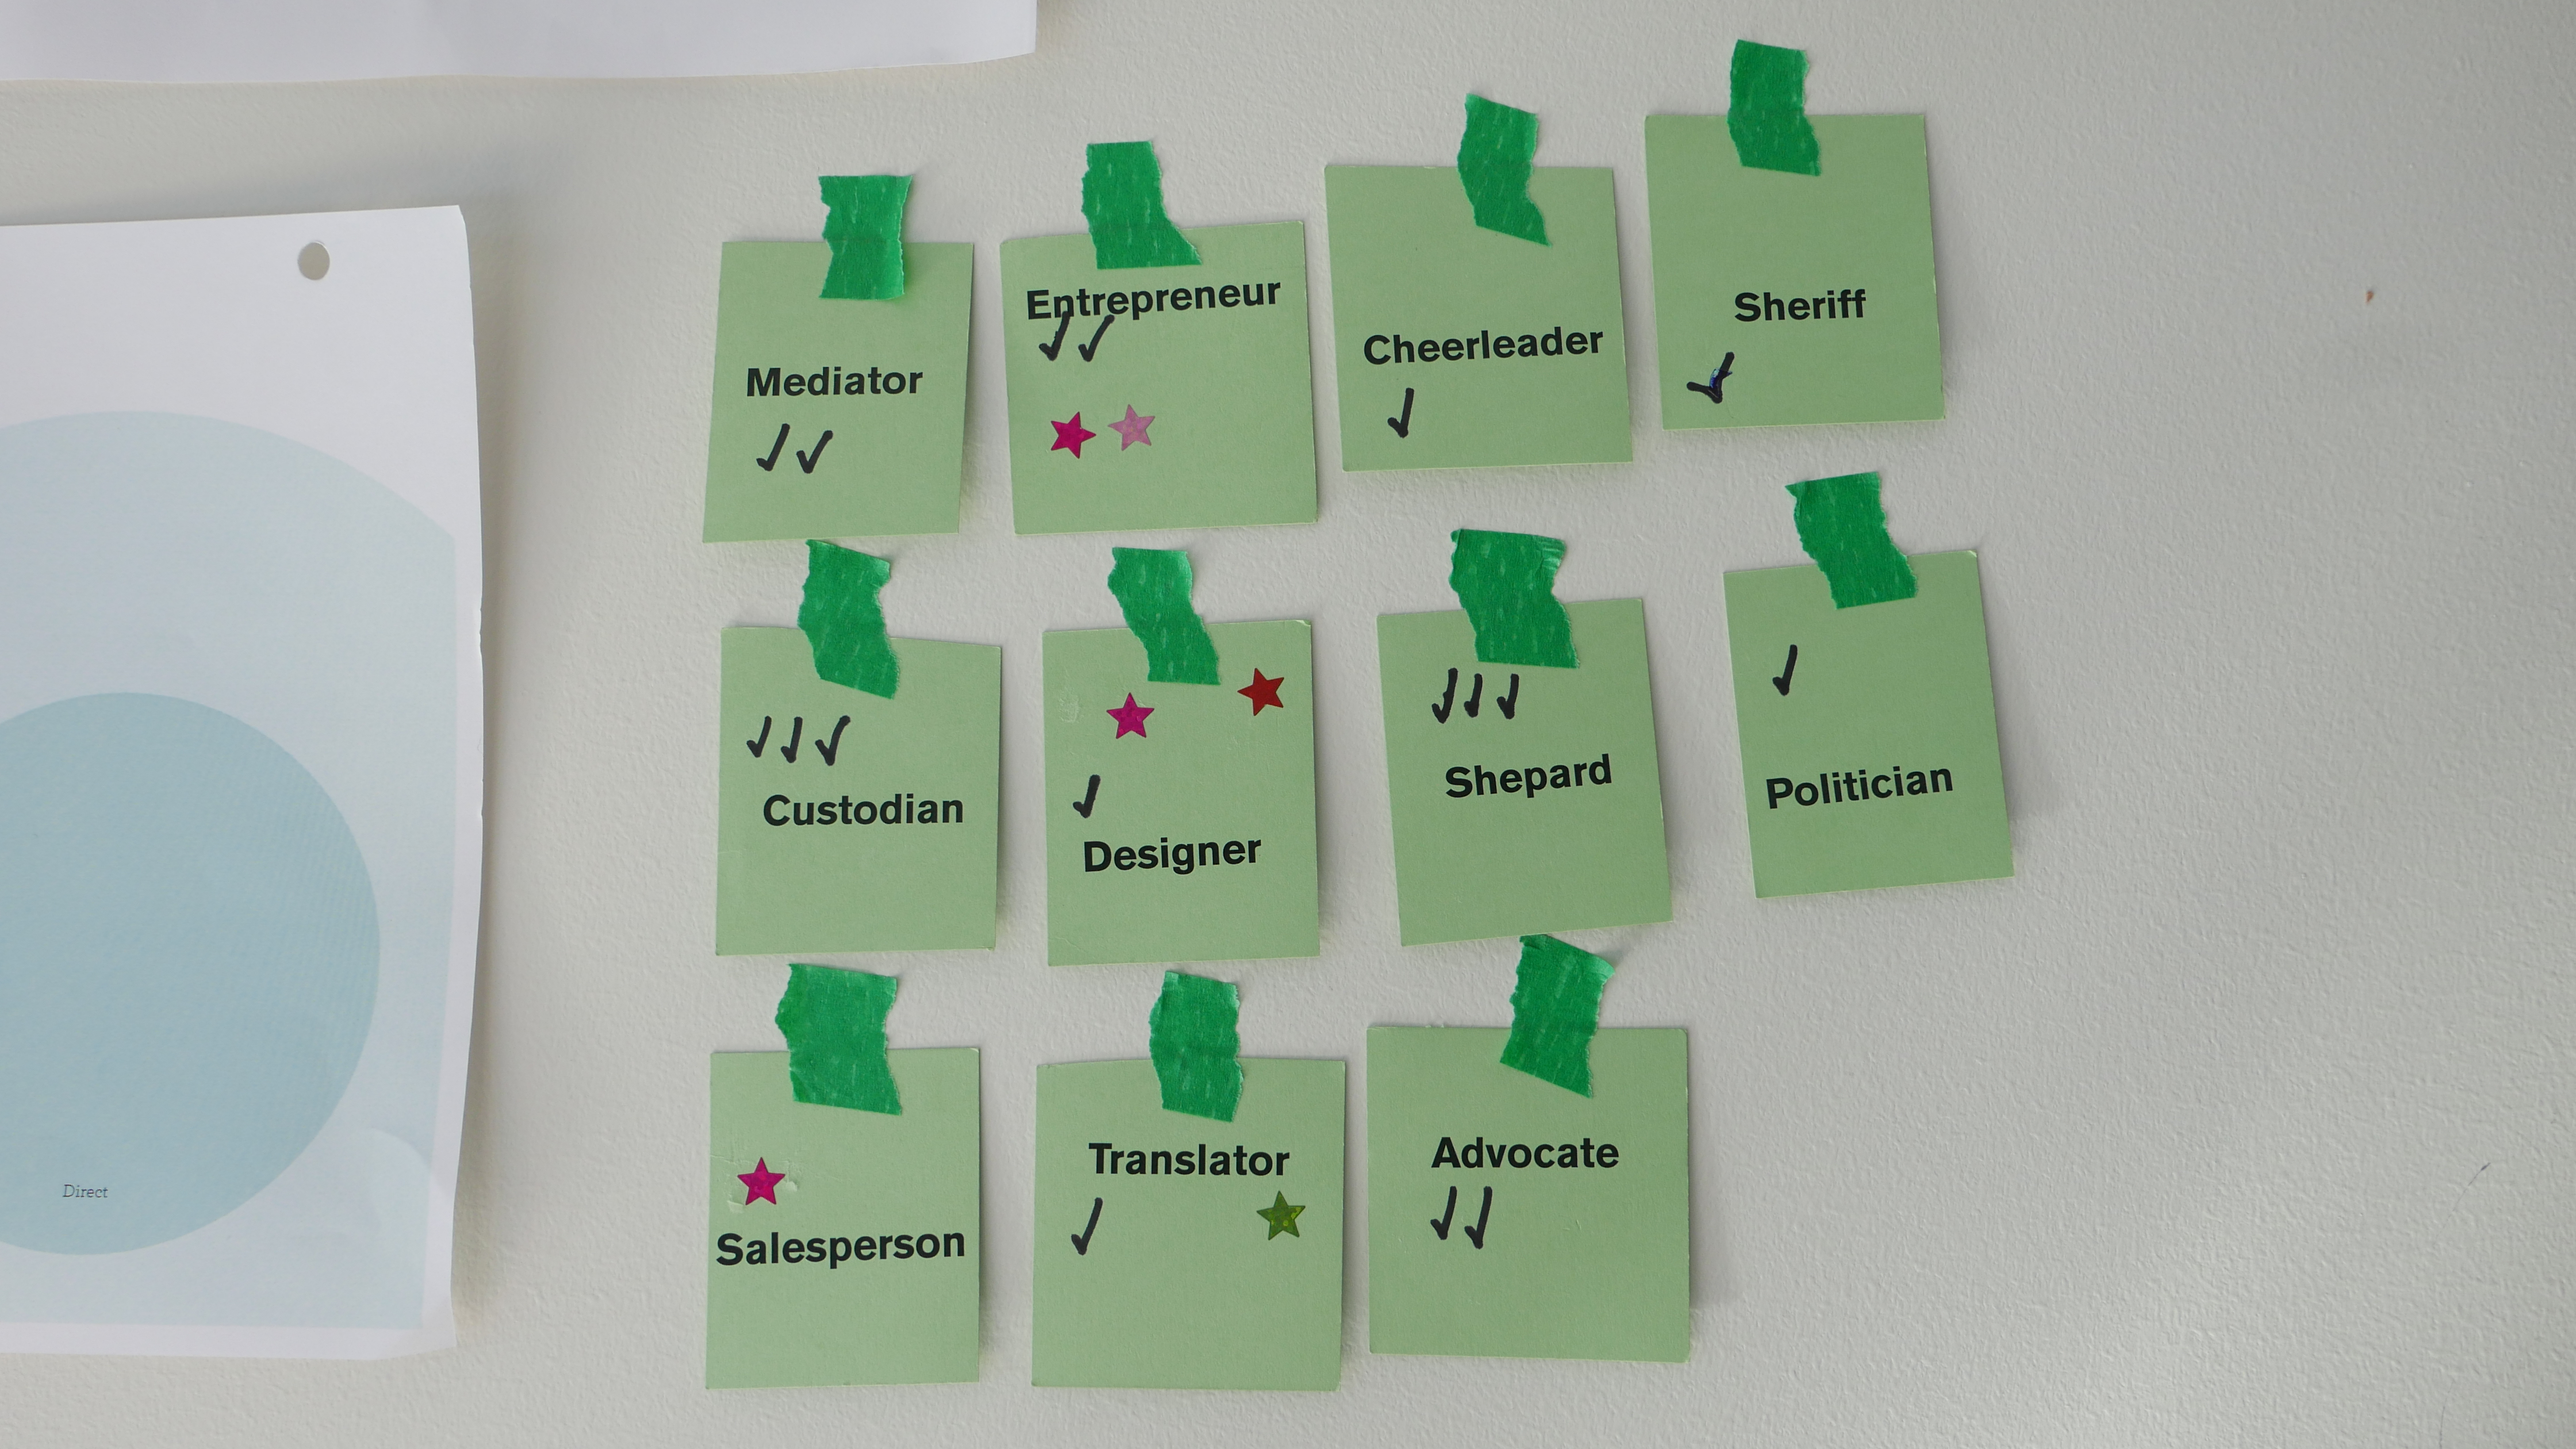


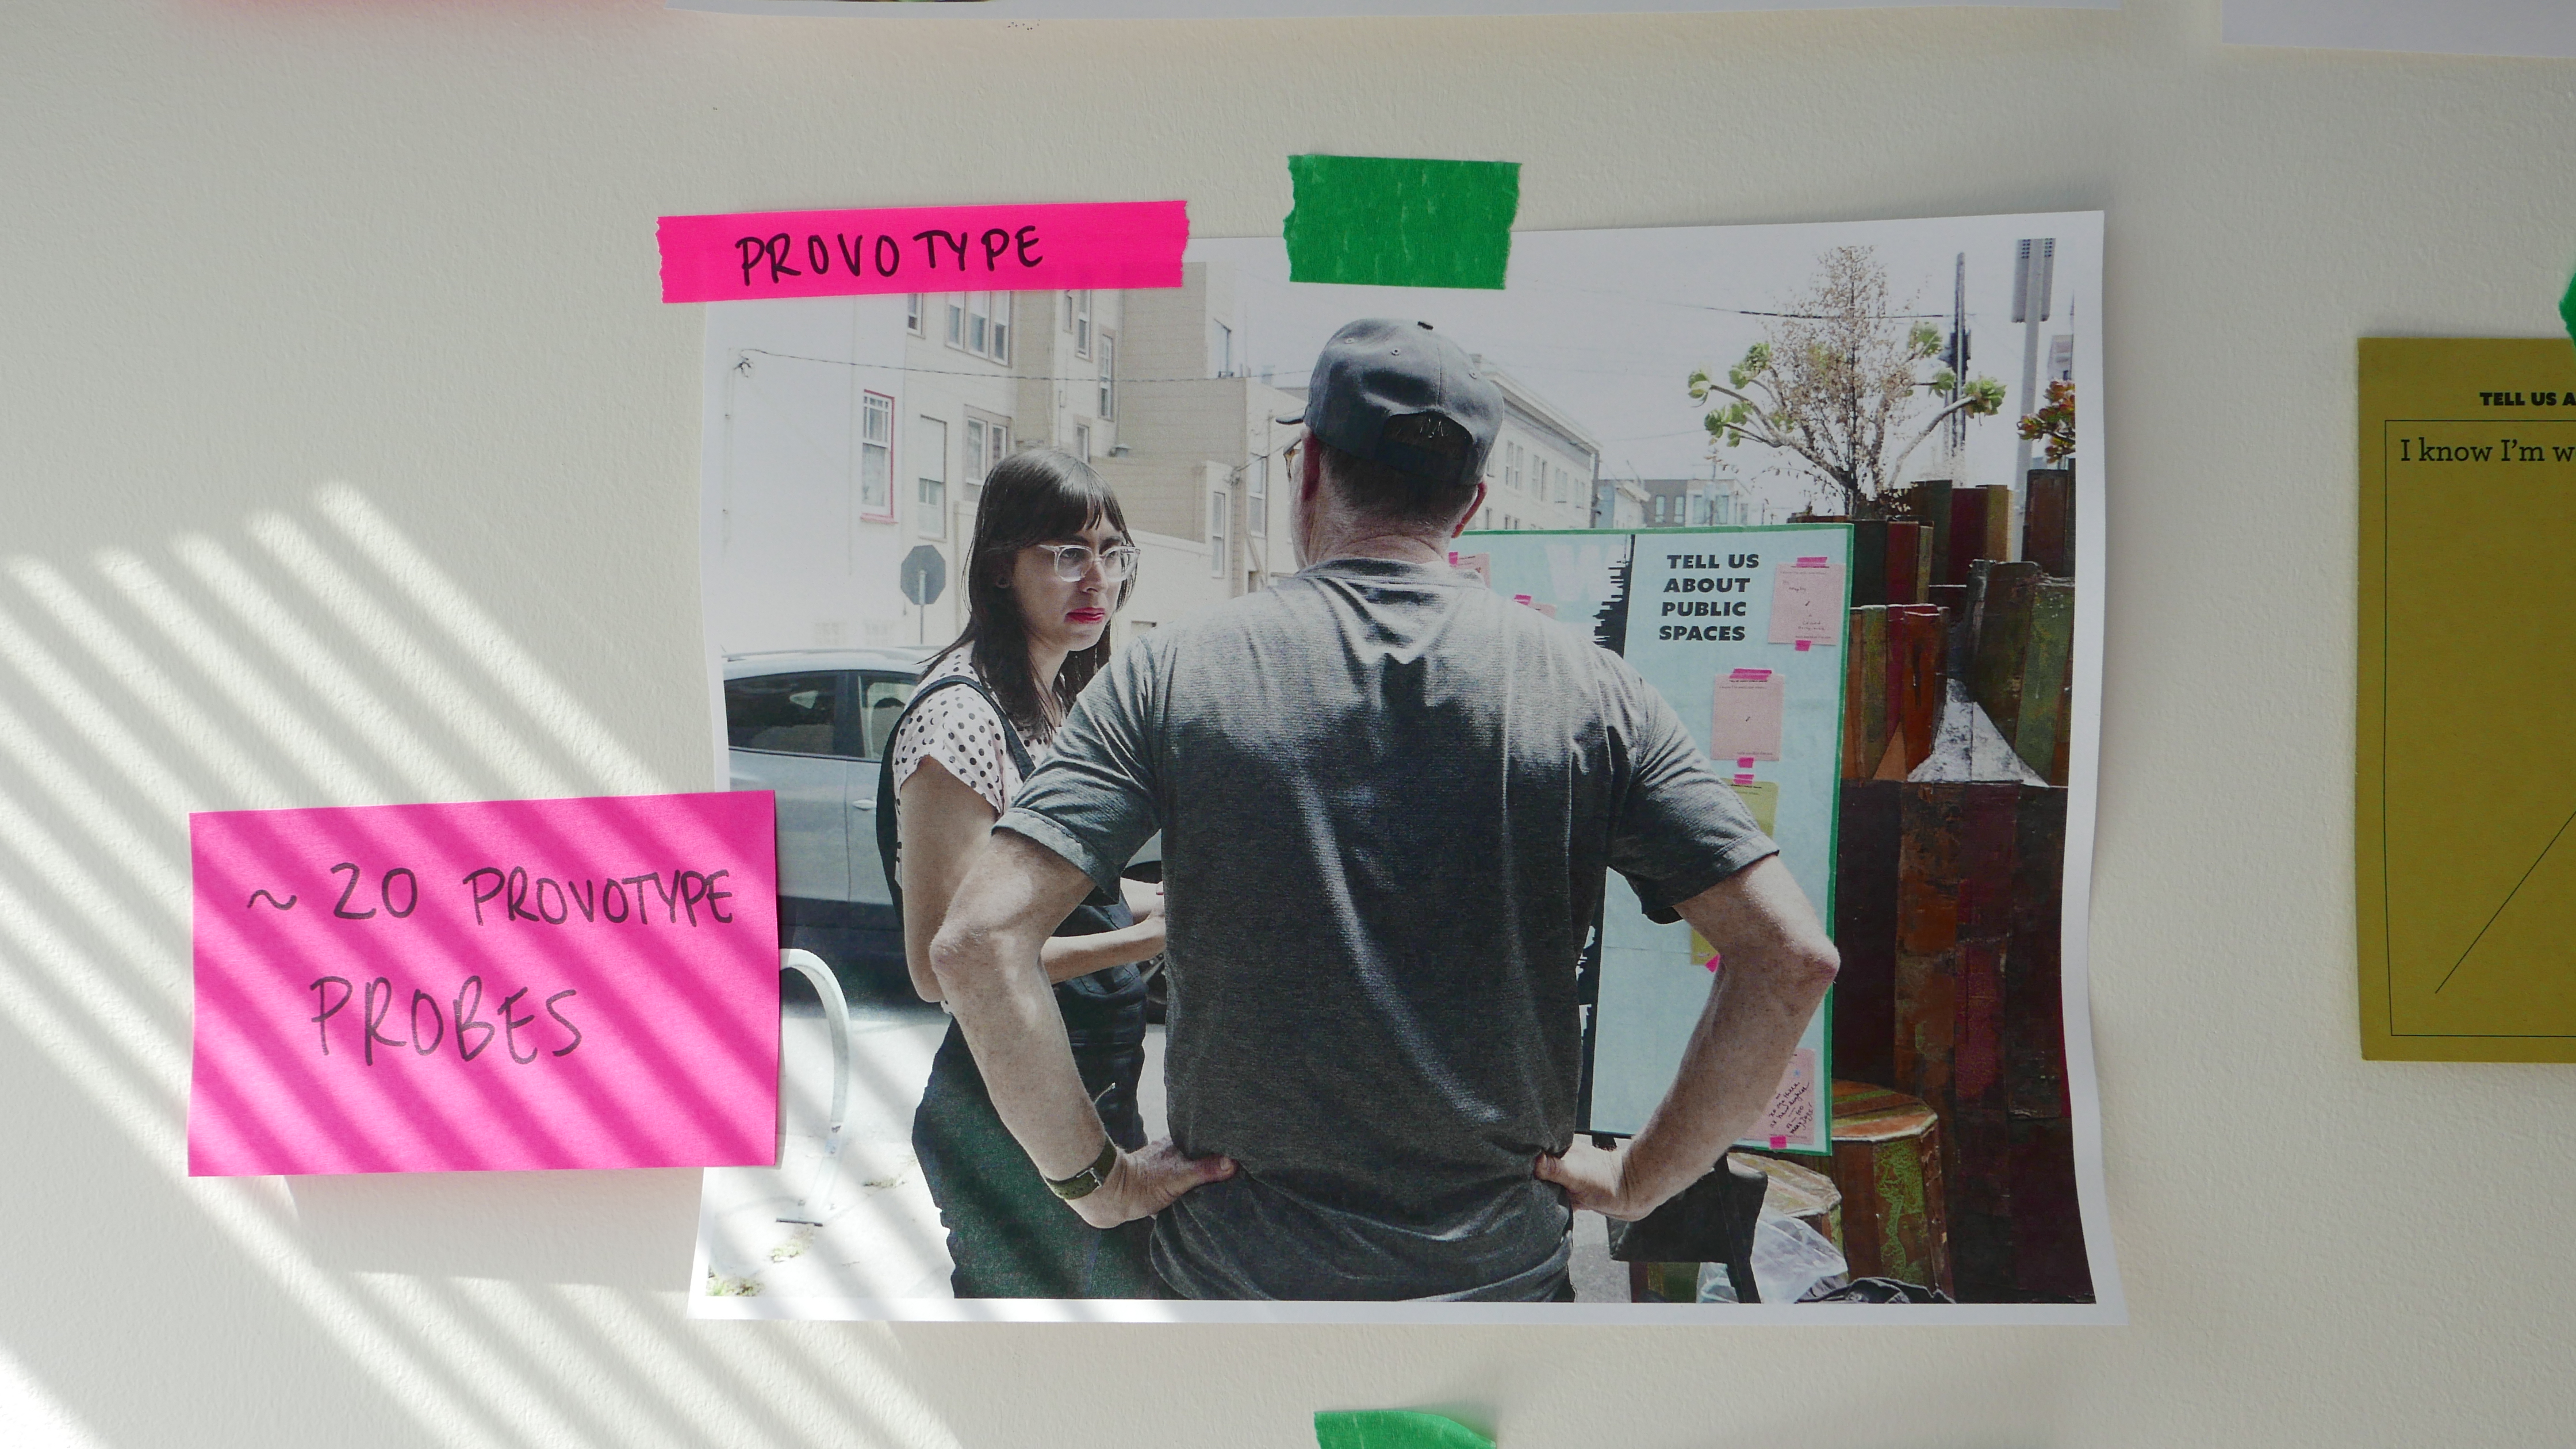
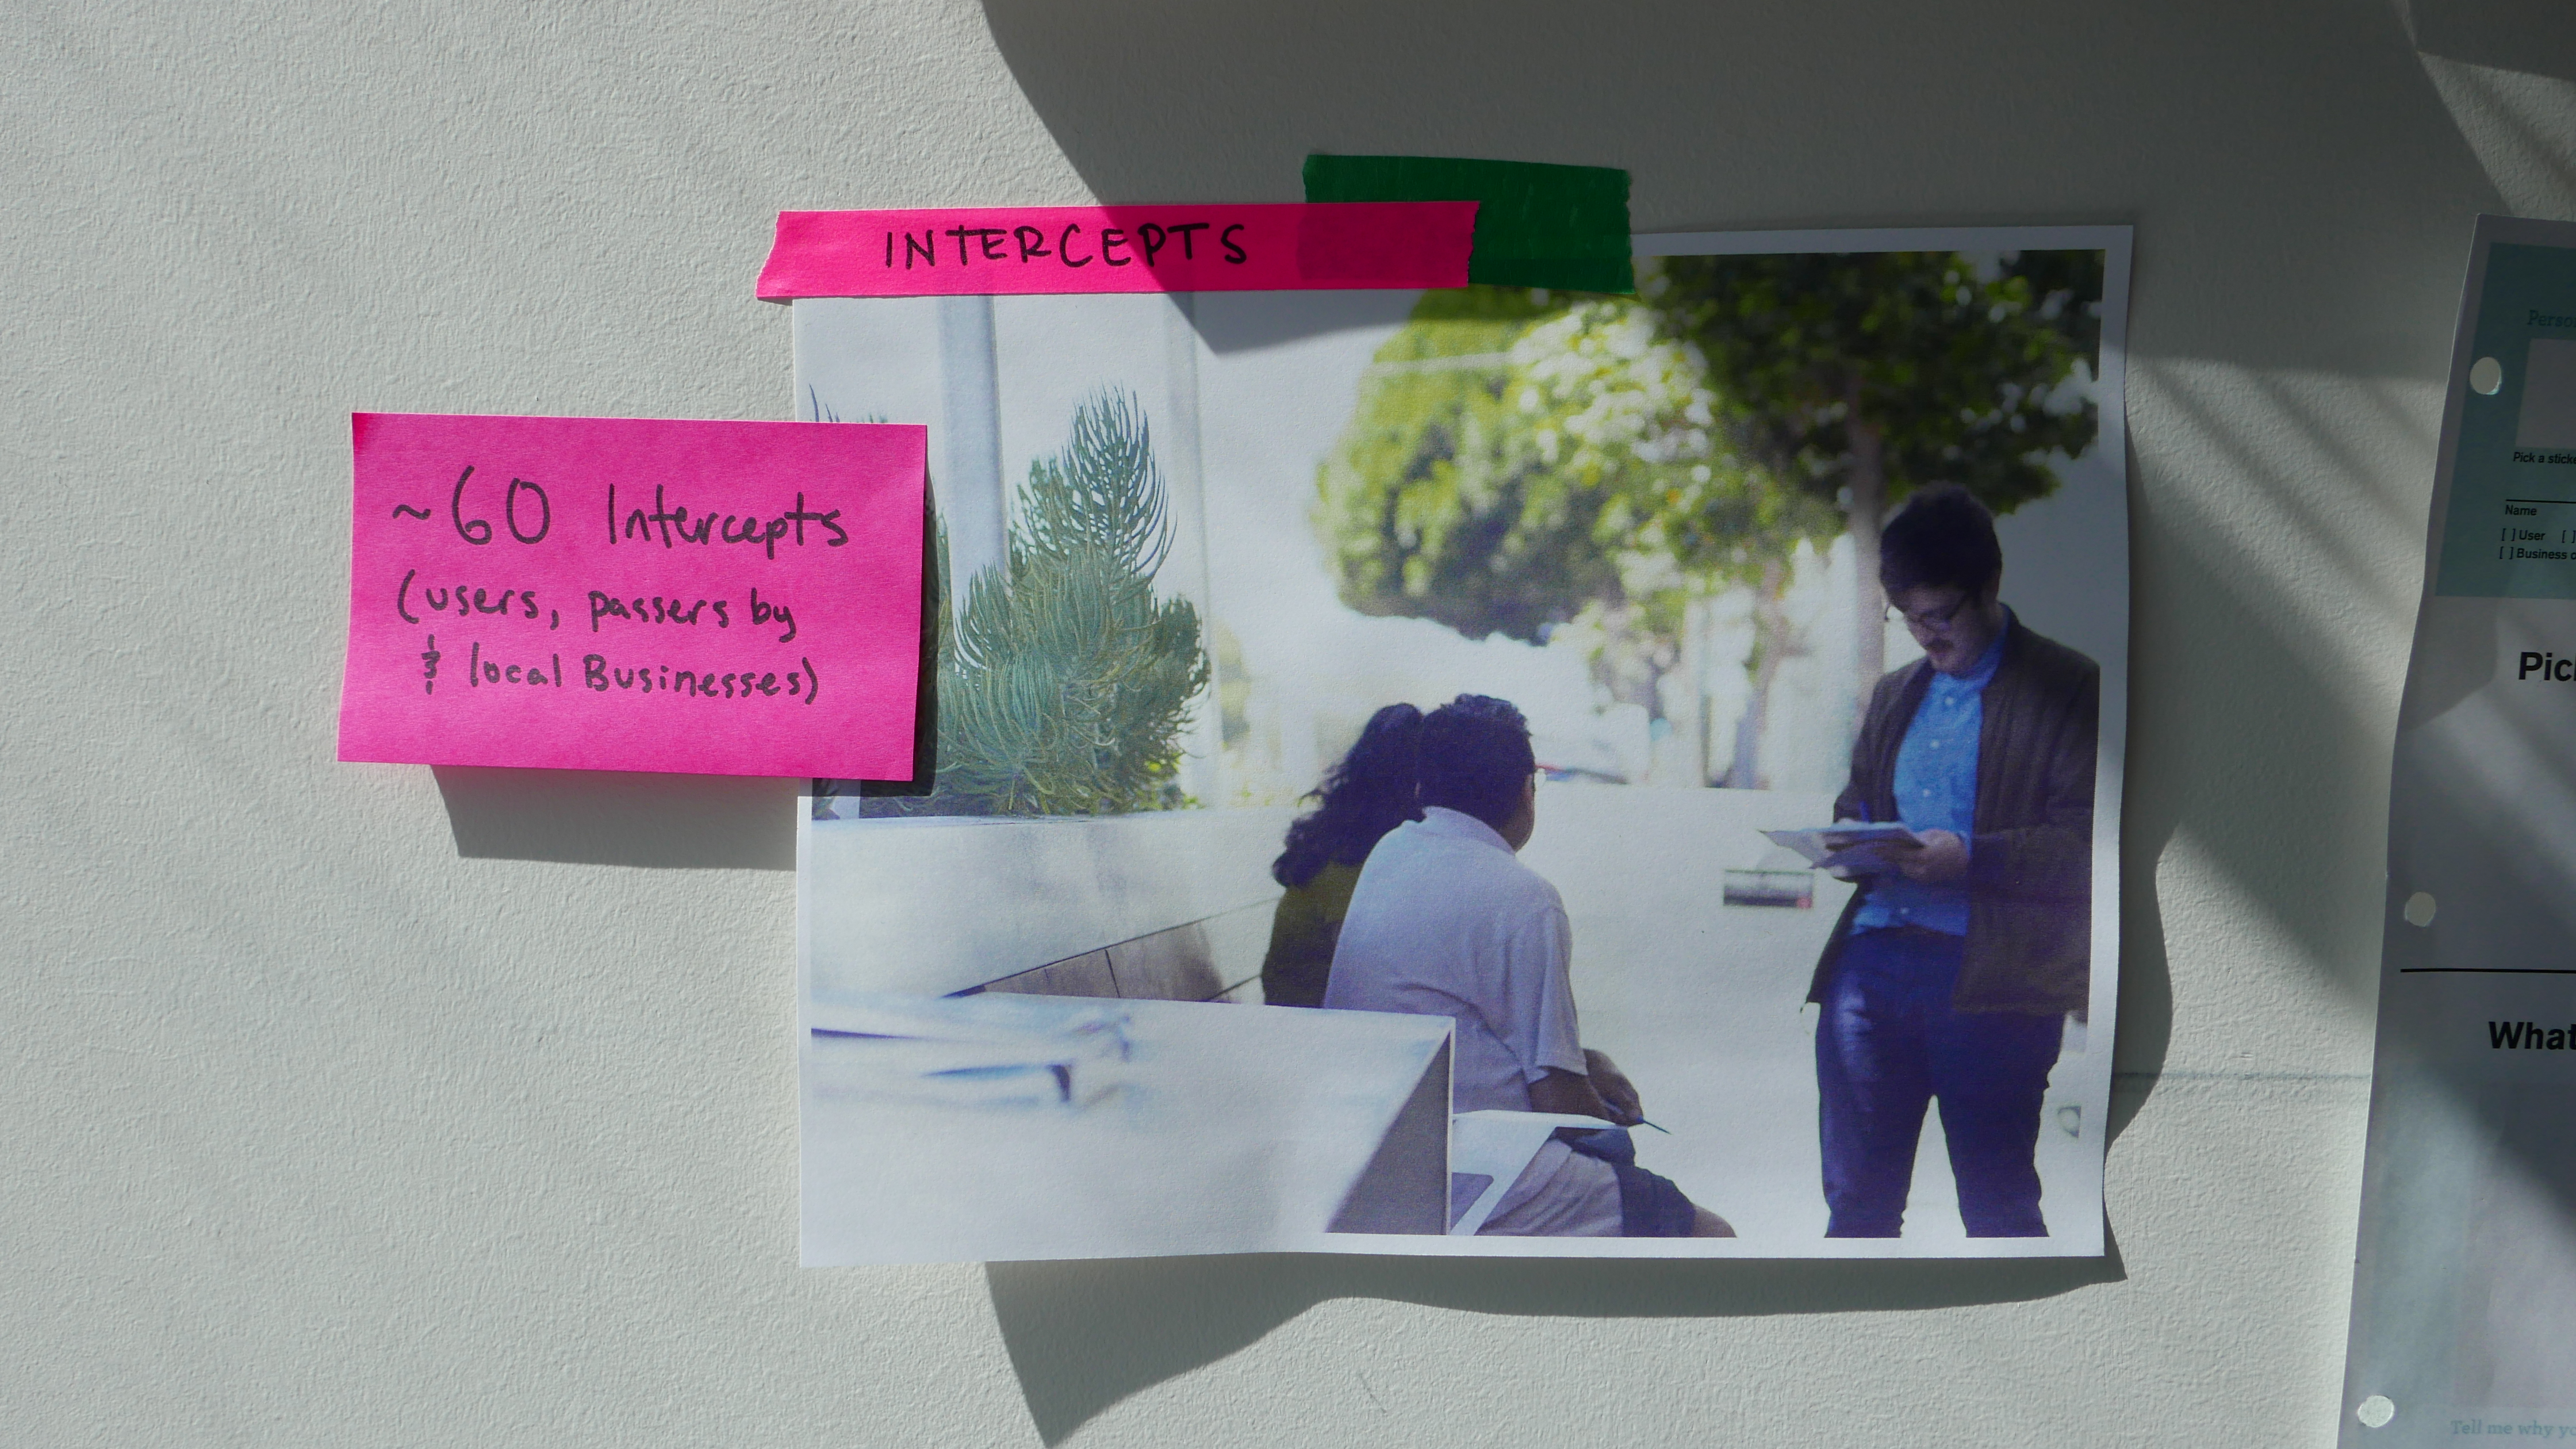
Intercept Surveys & Provotype


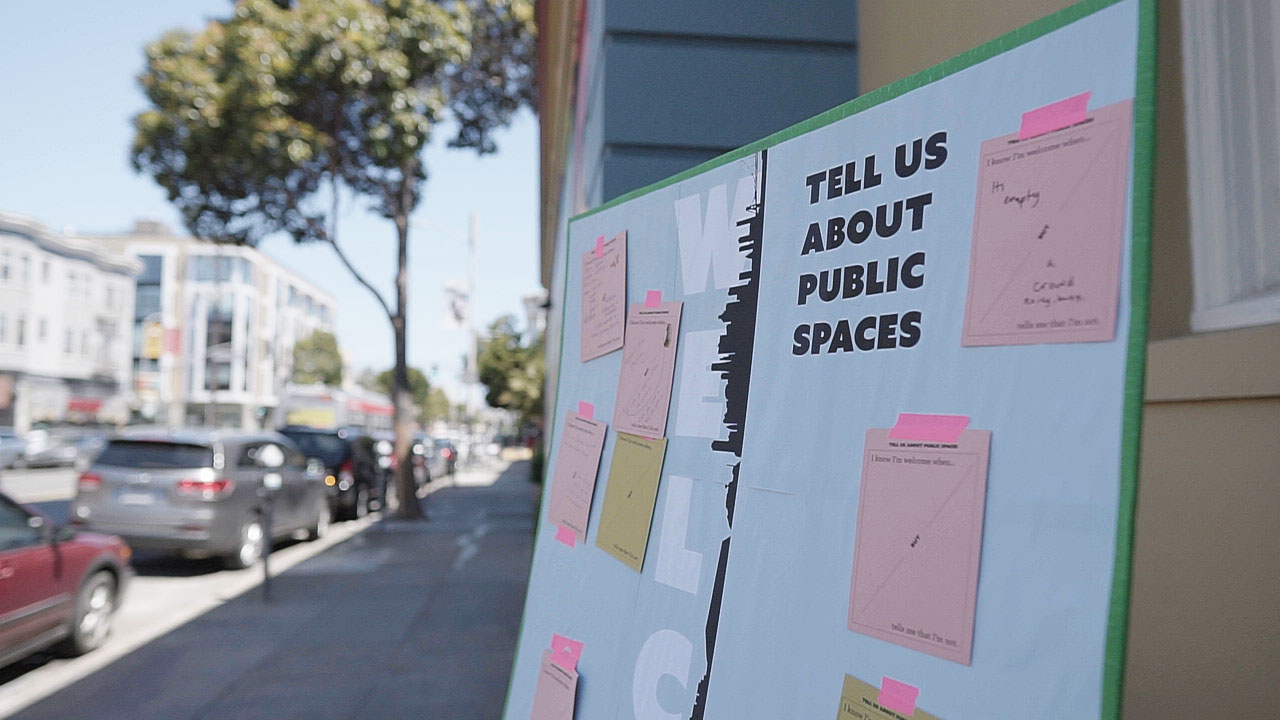

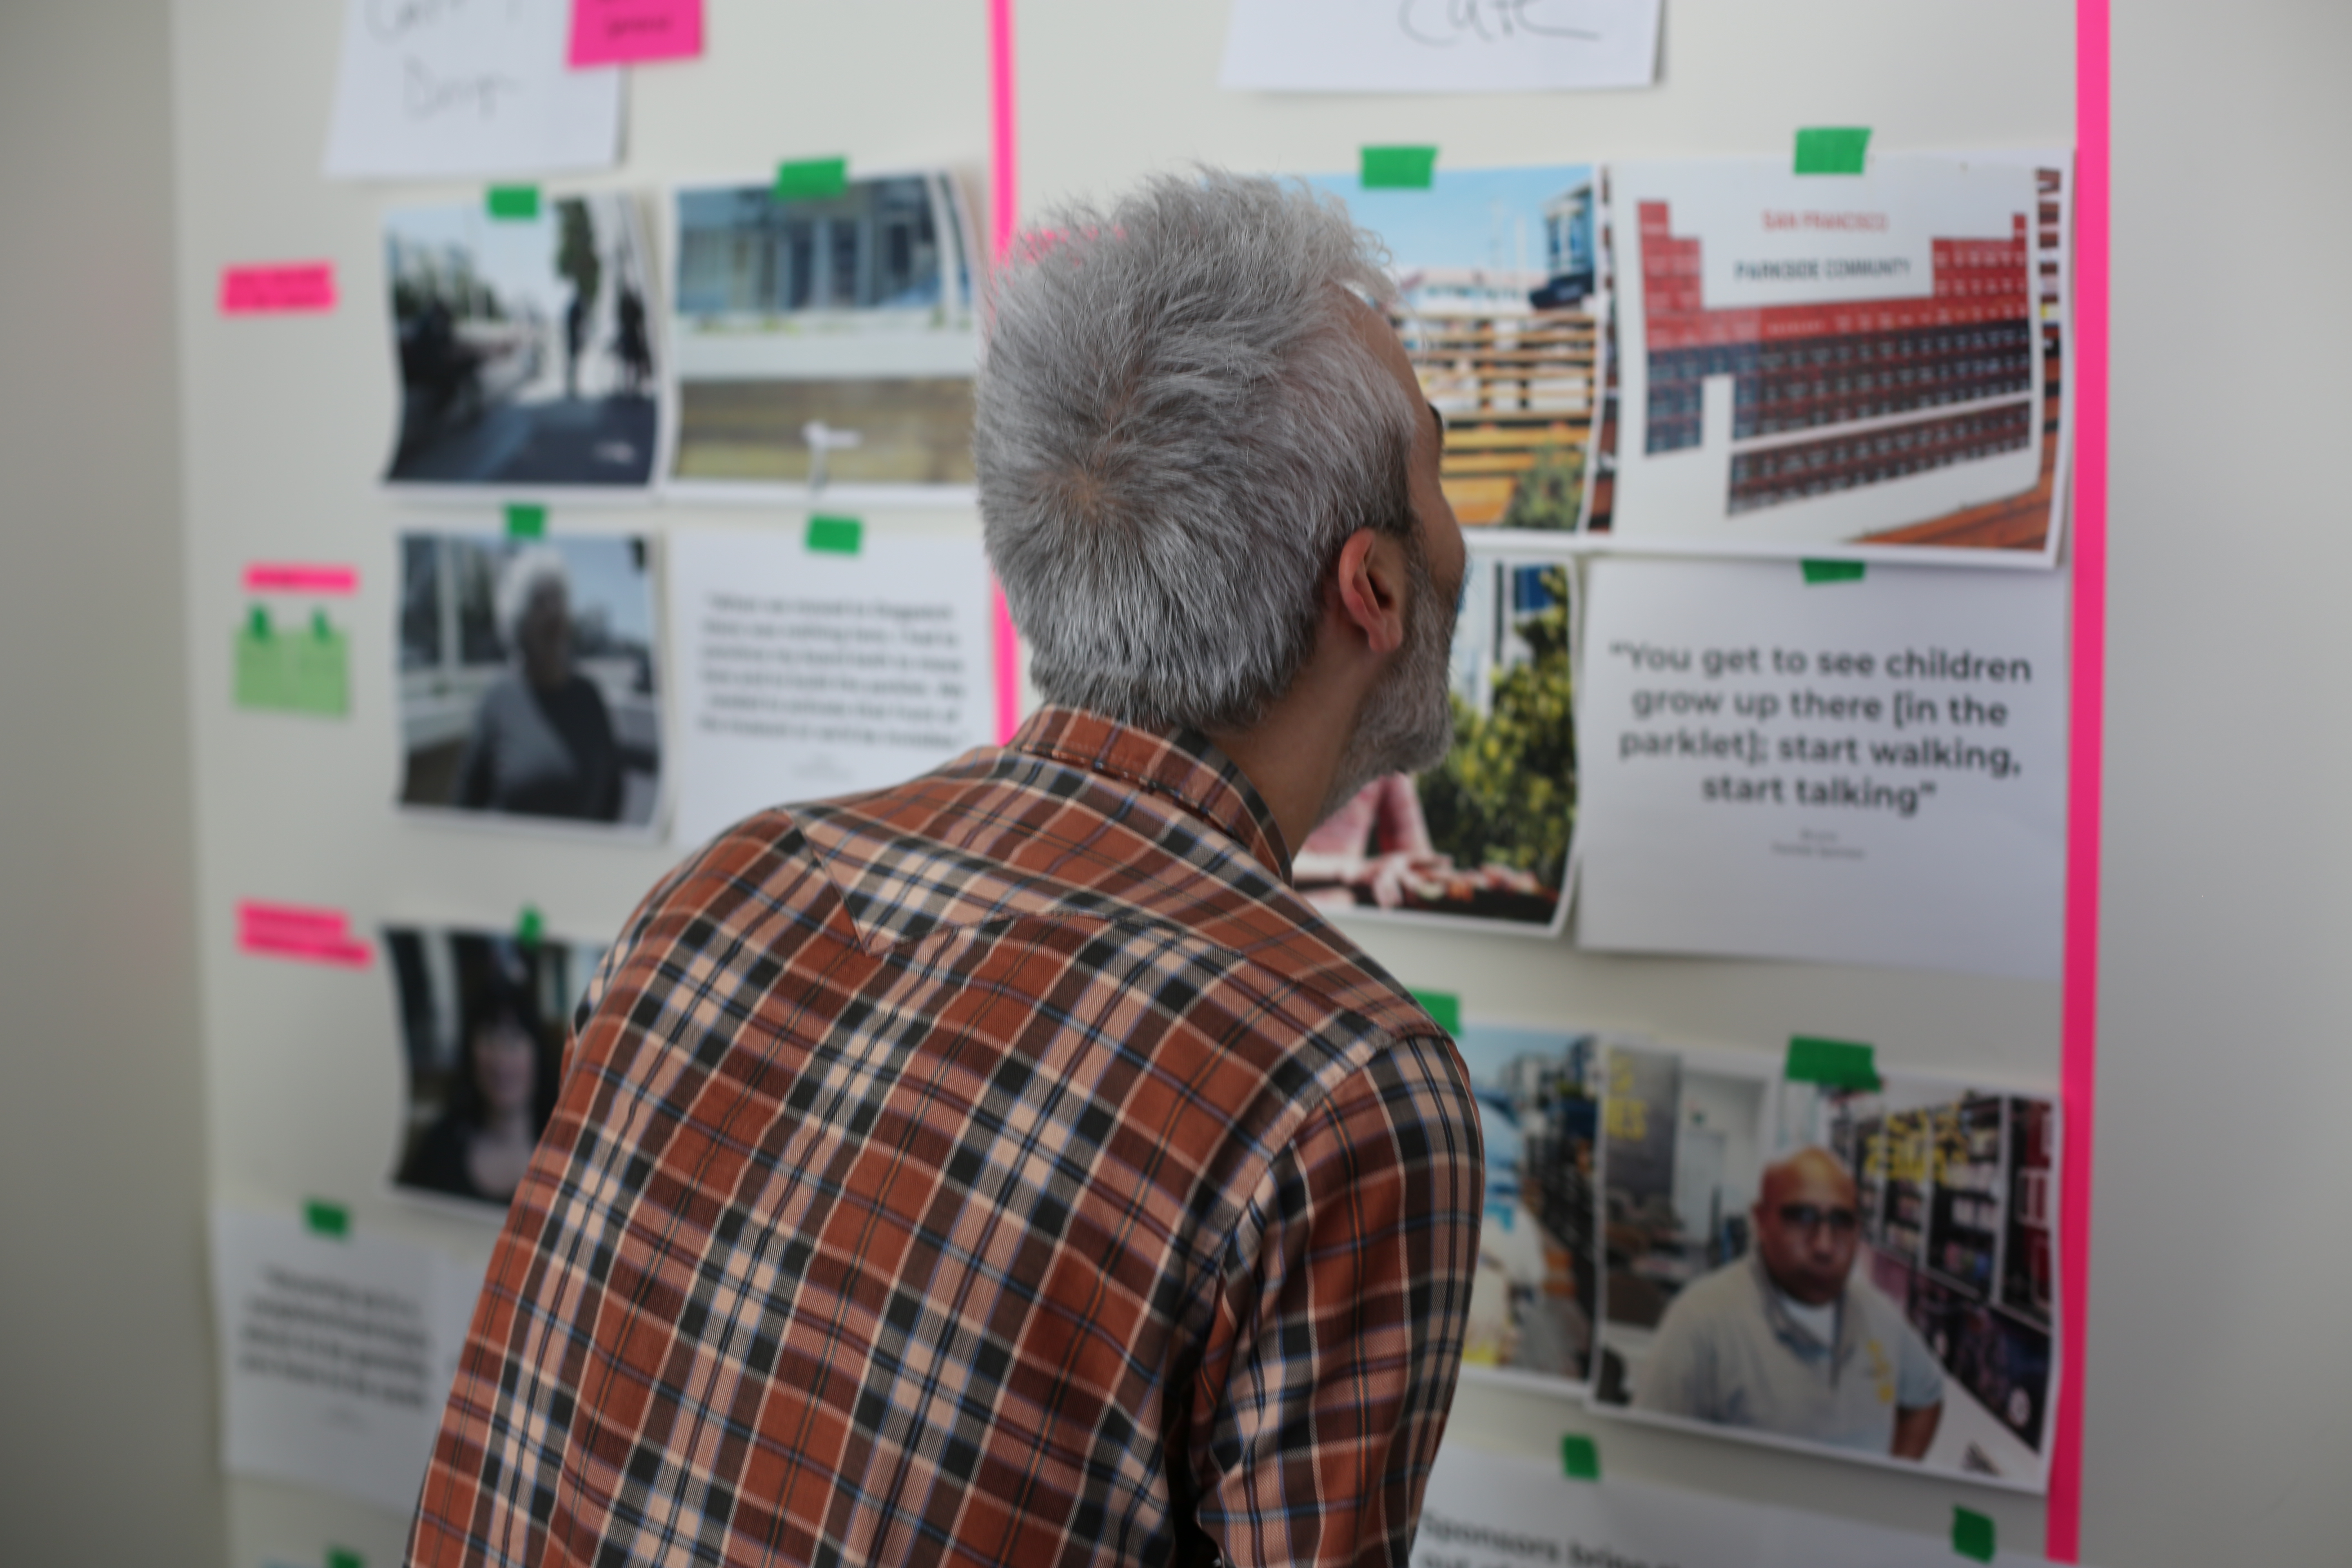
Parklet Observations


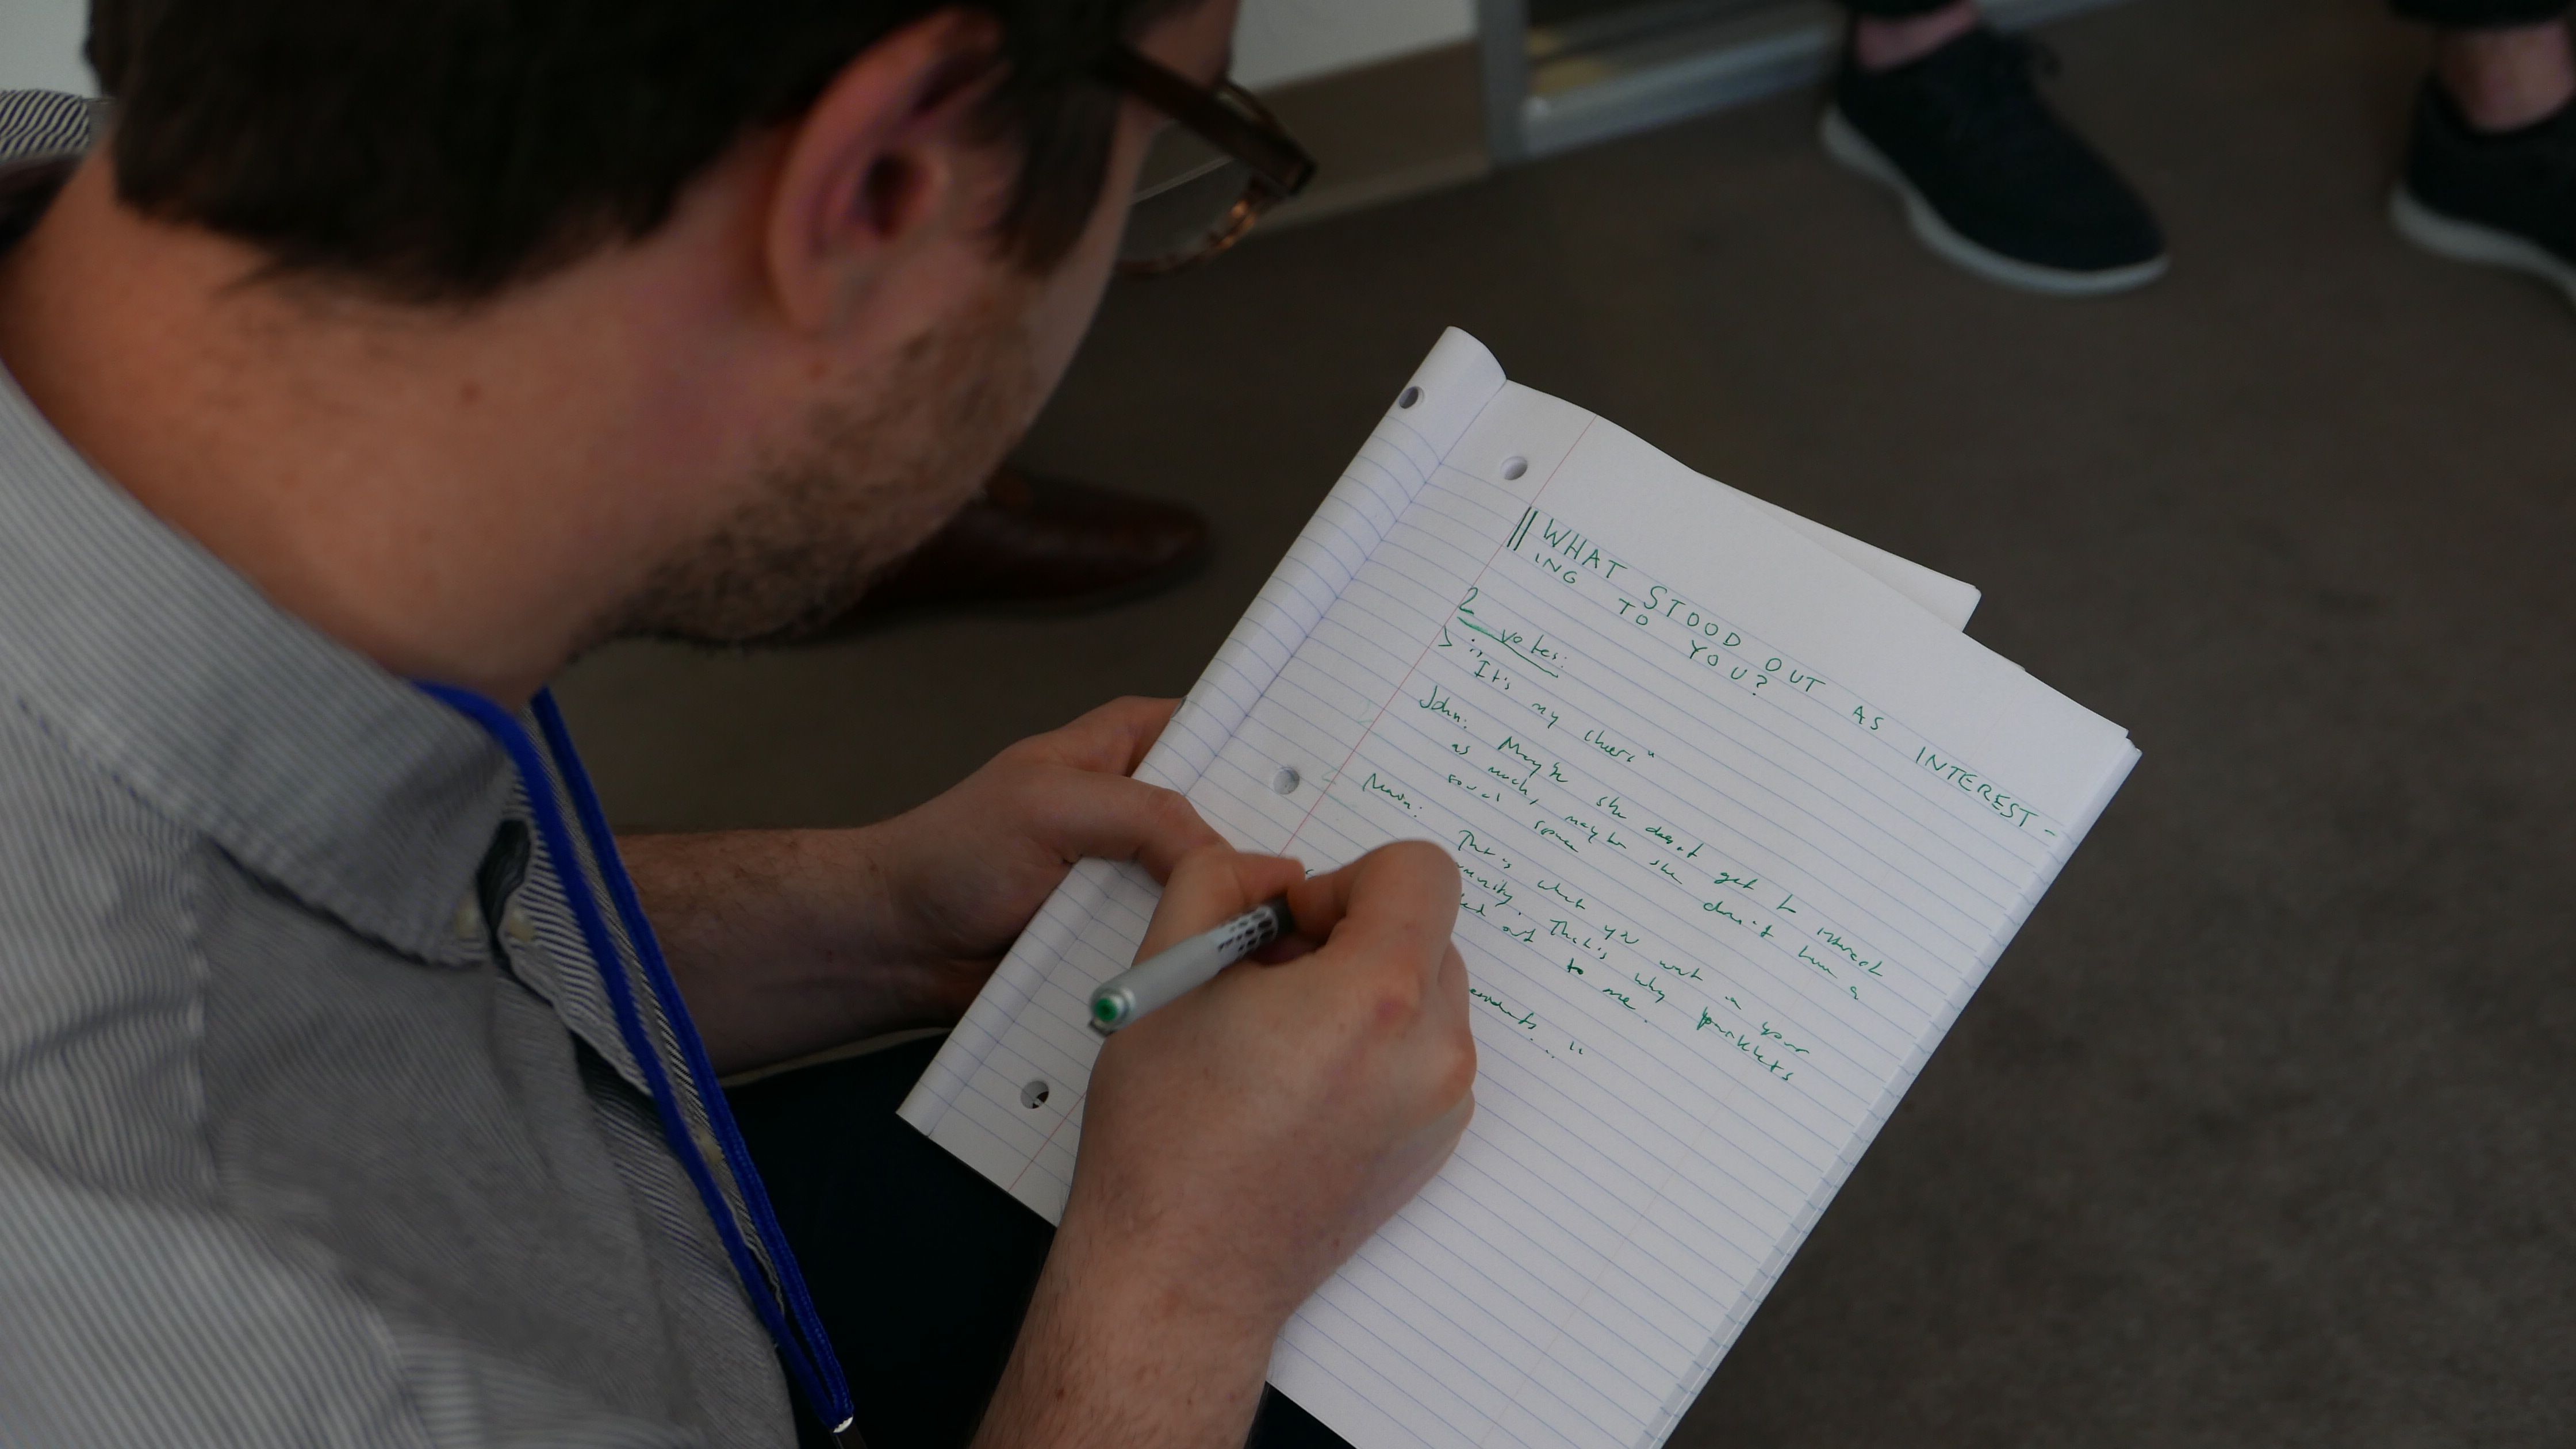
Field Research Notes






Design
Description
After concluding our weekly stay in San Francisco, the Stae and Openbox team continued to collaborate on what the final output of all our research and data gathering should be.
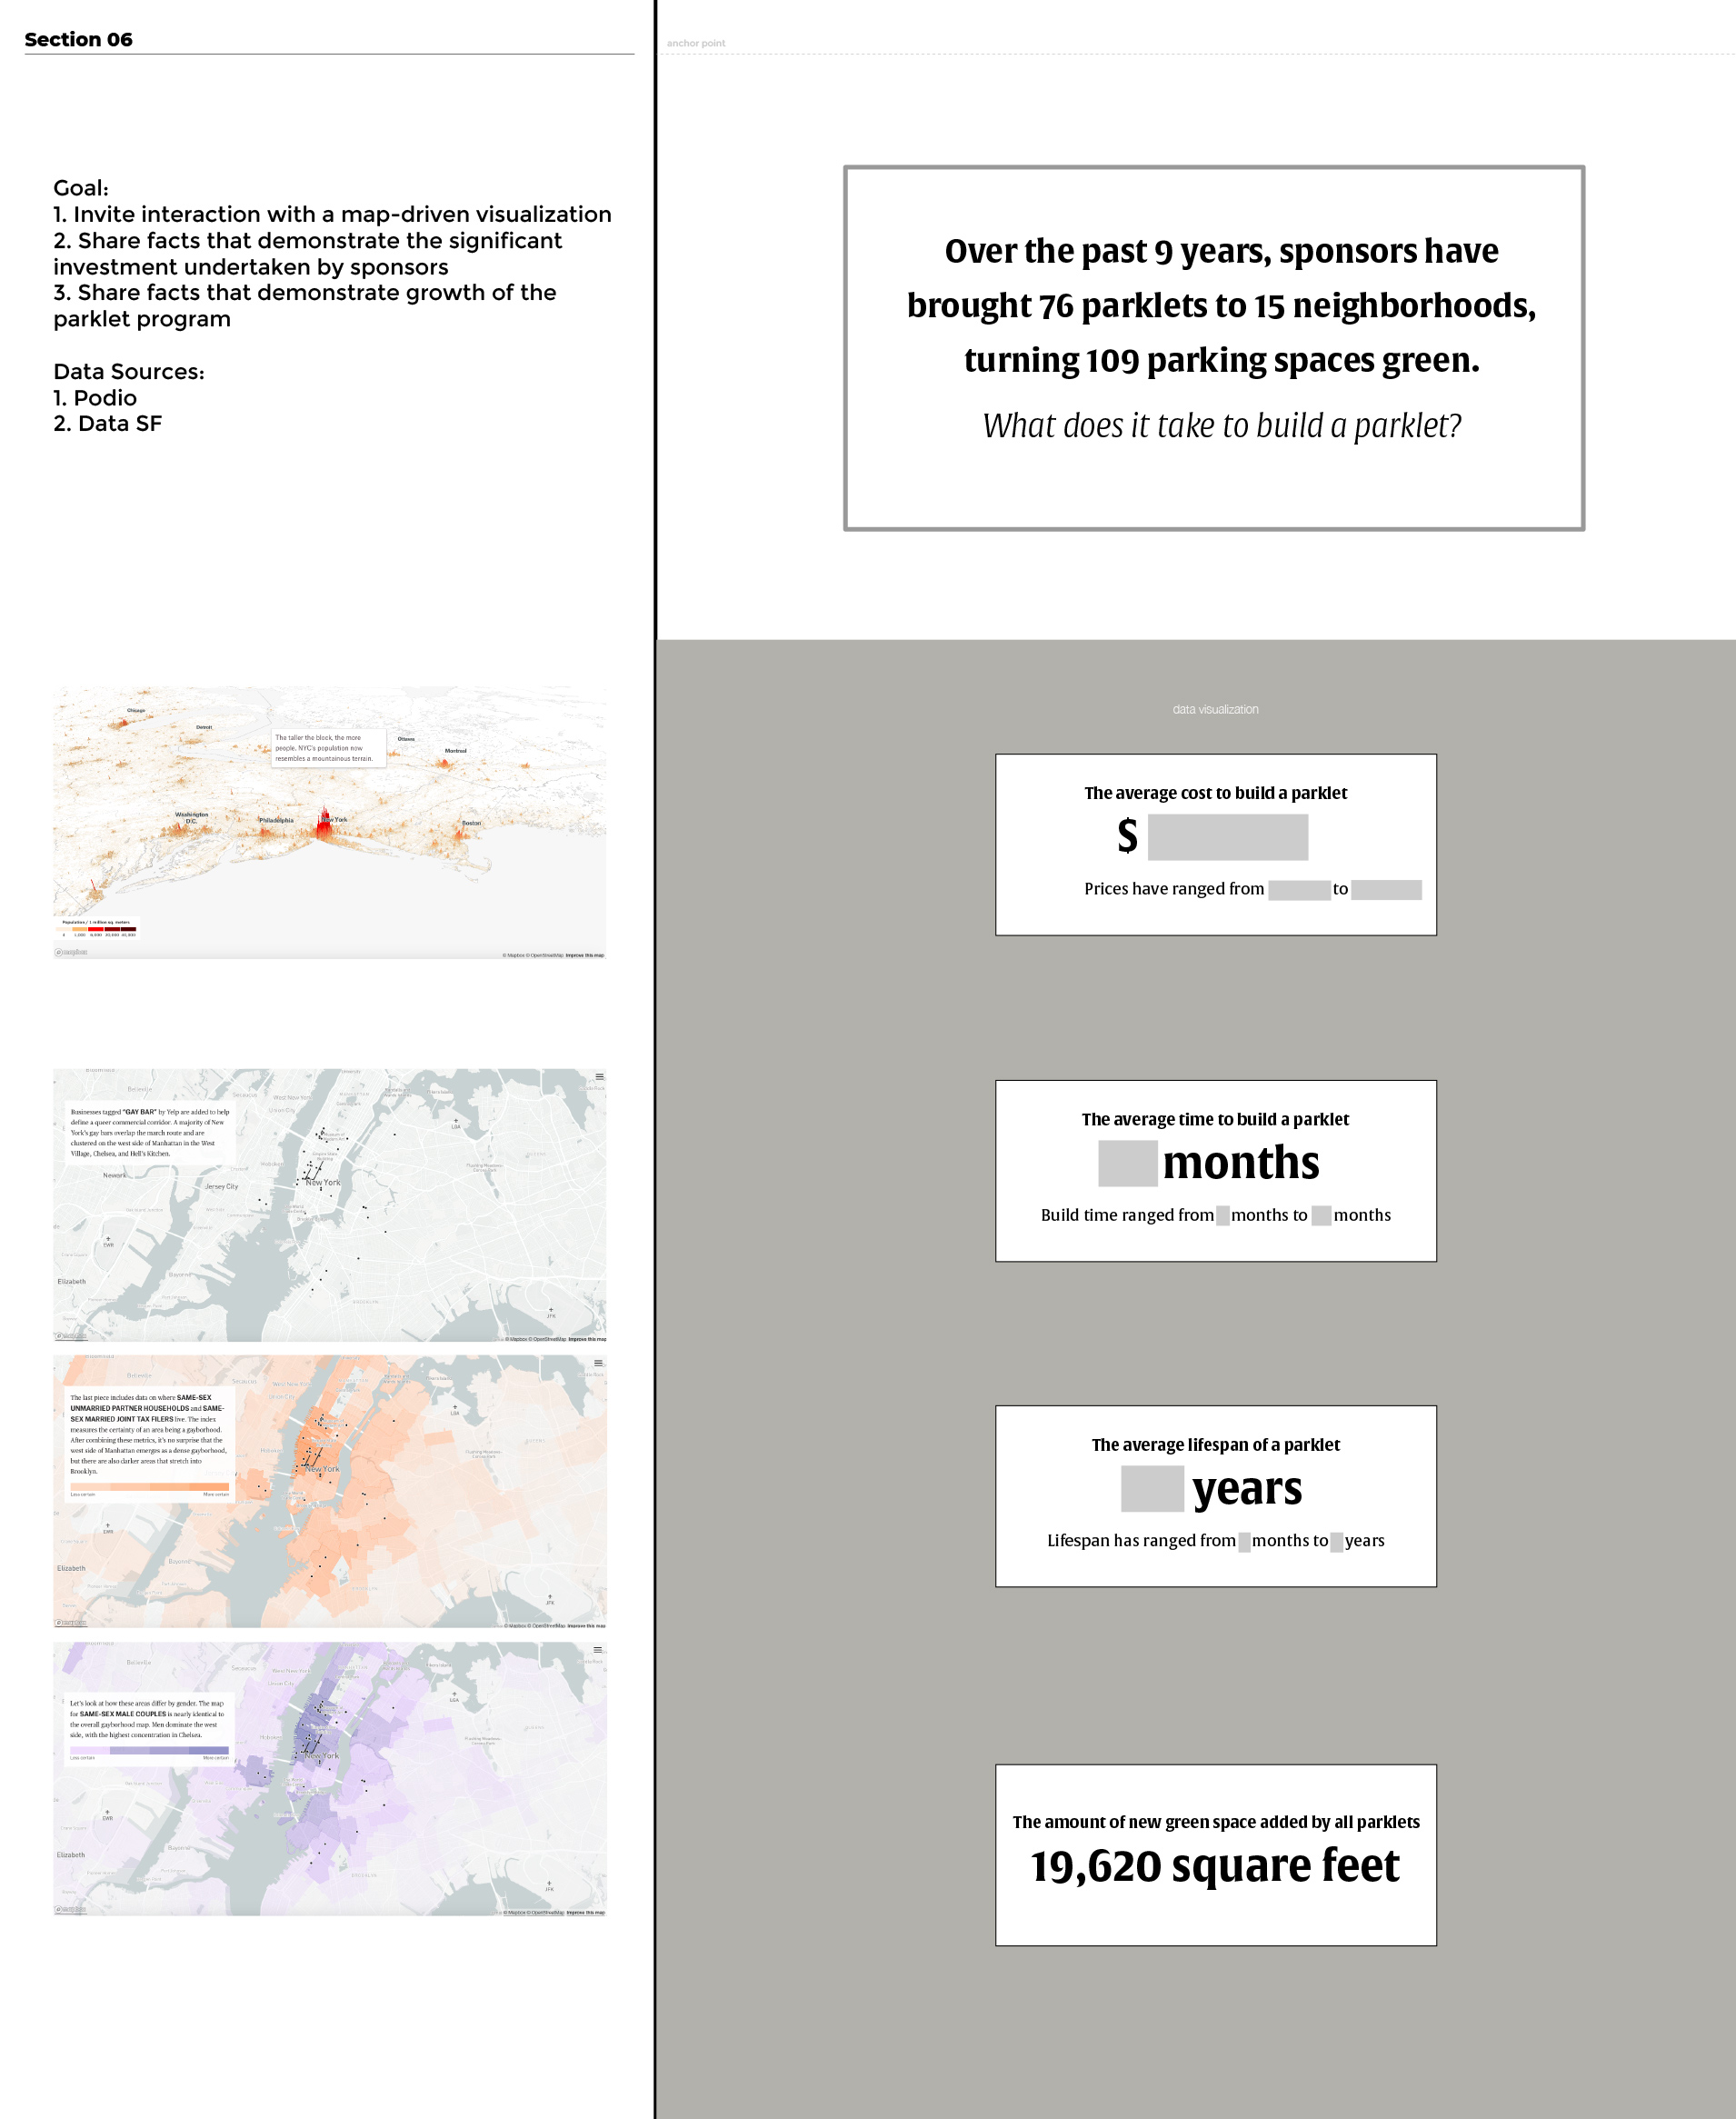
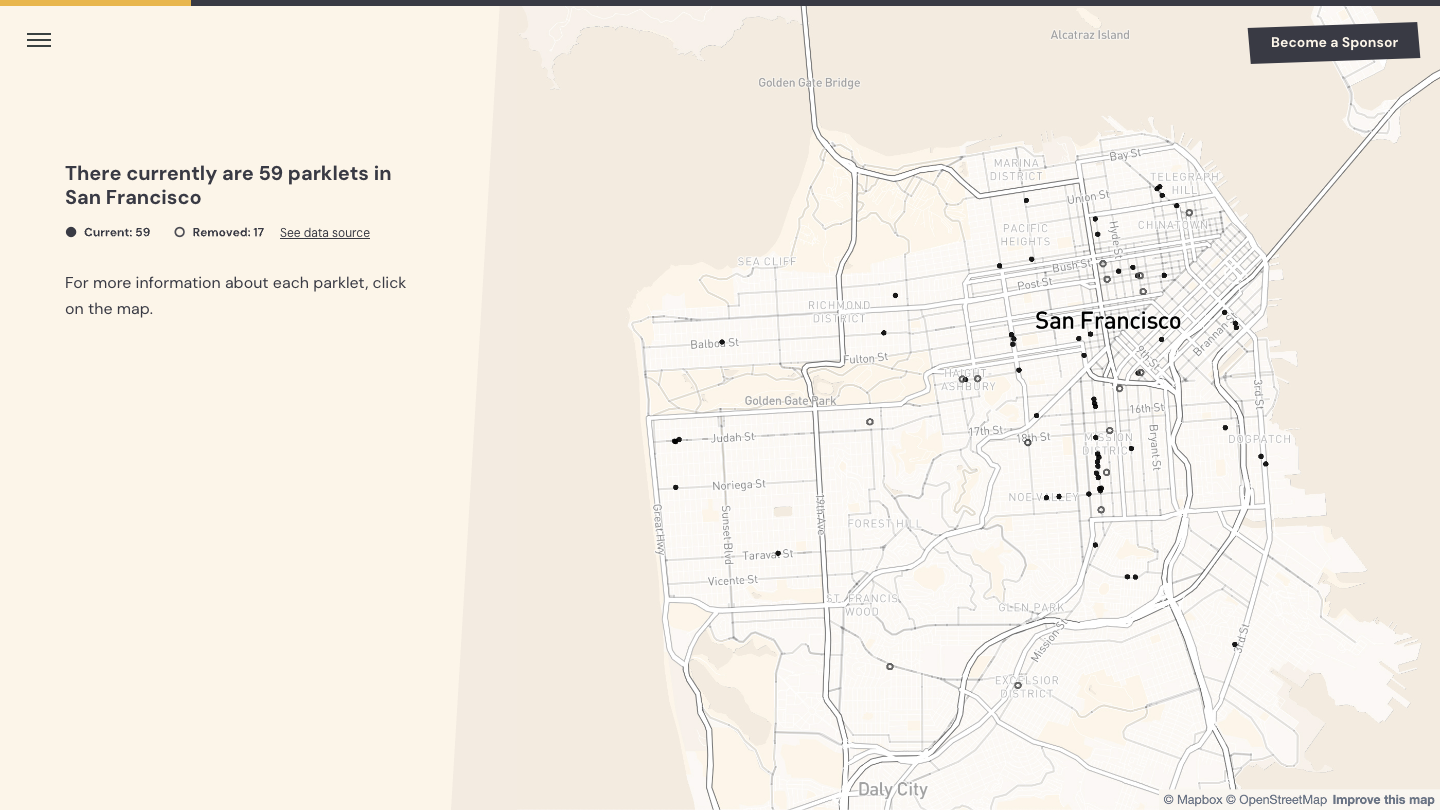
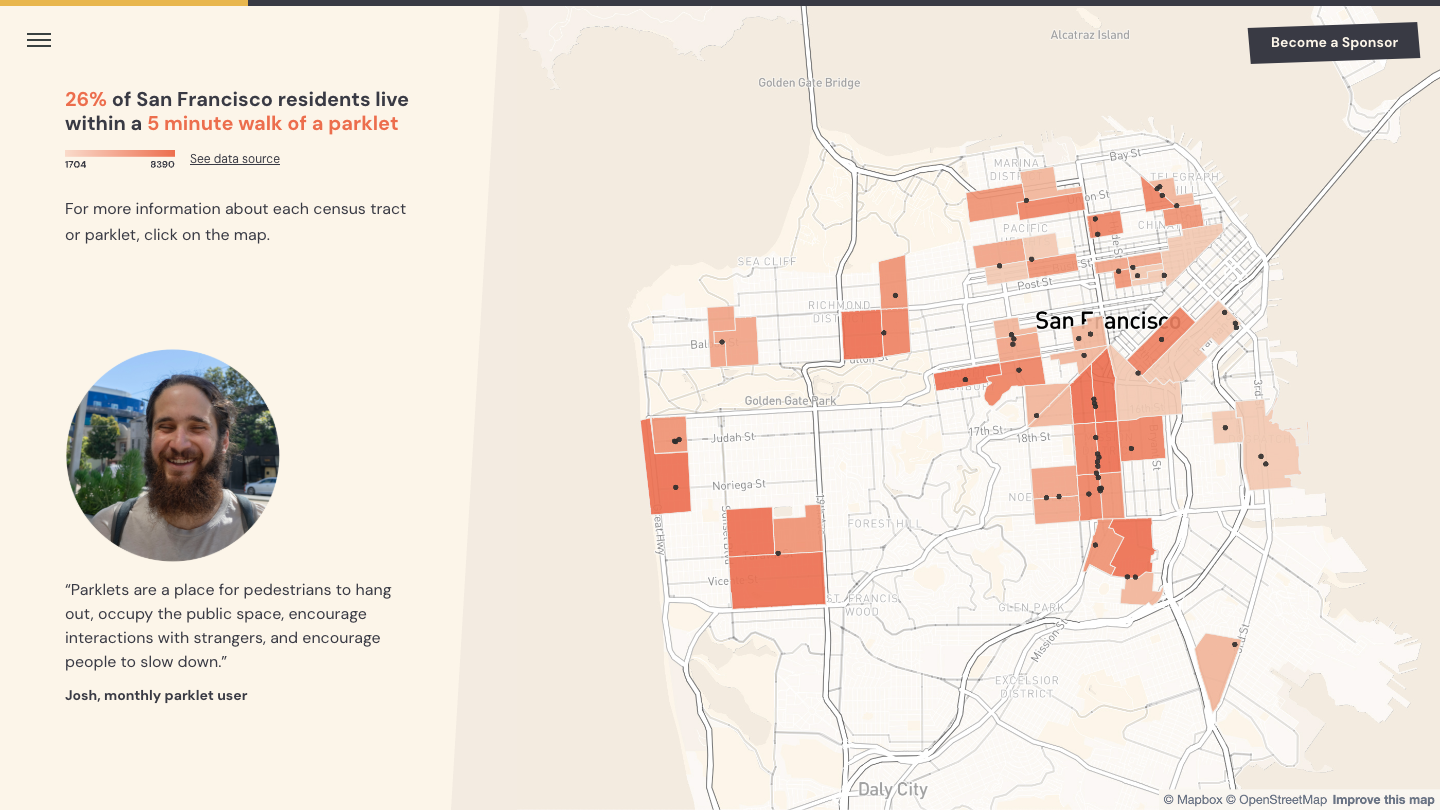
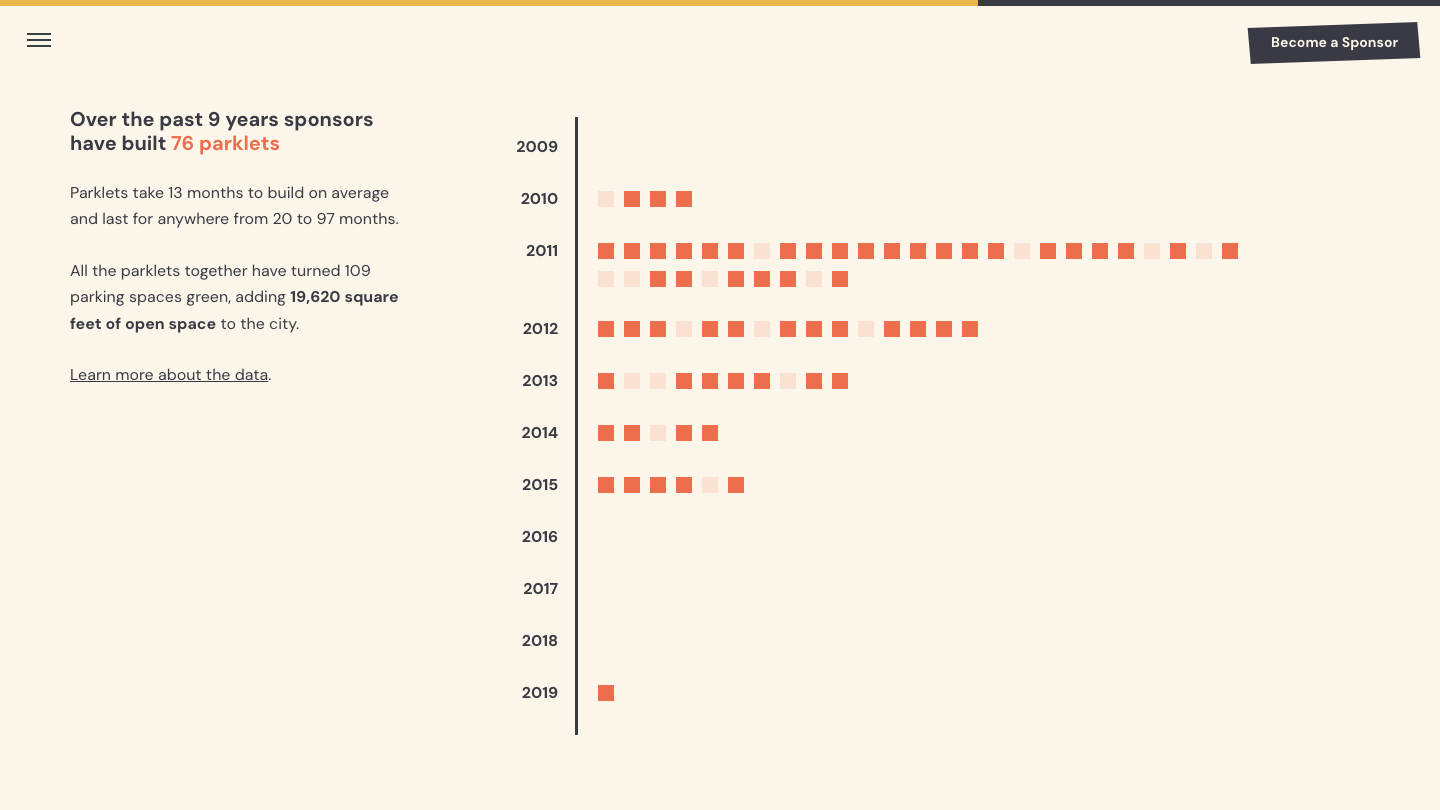
Openbox synthesized all our notes and research into a narrative story structure while Stae analyzed and plotted the data using the open-source map platform Mapbox.
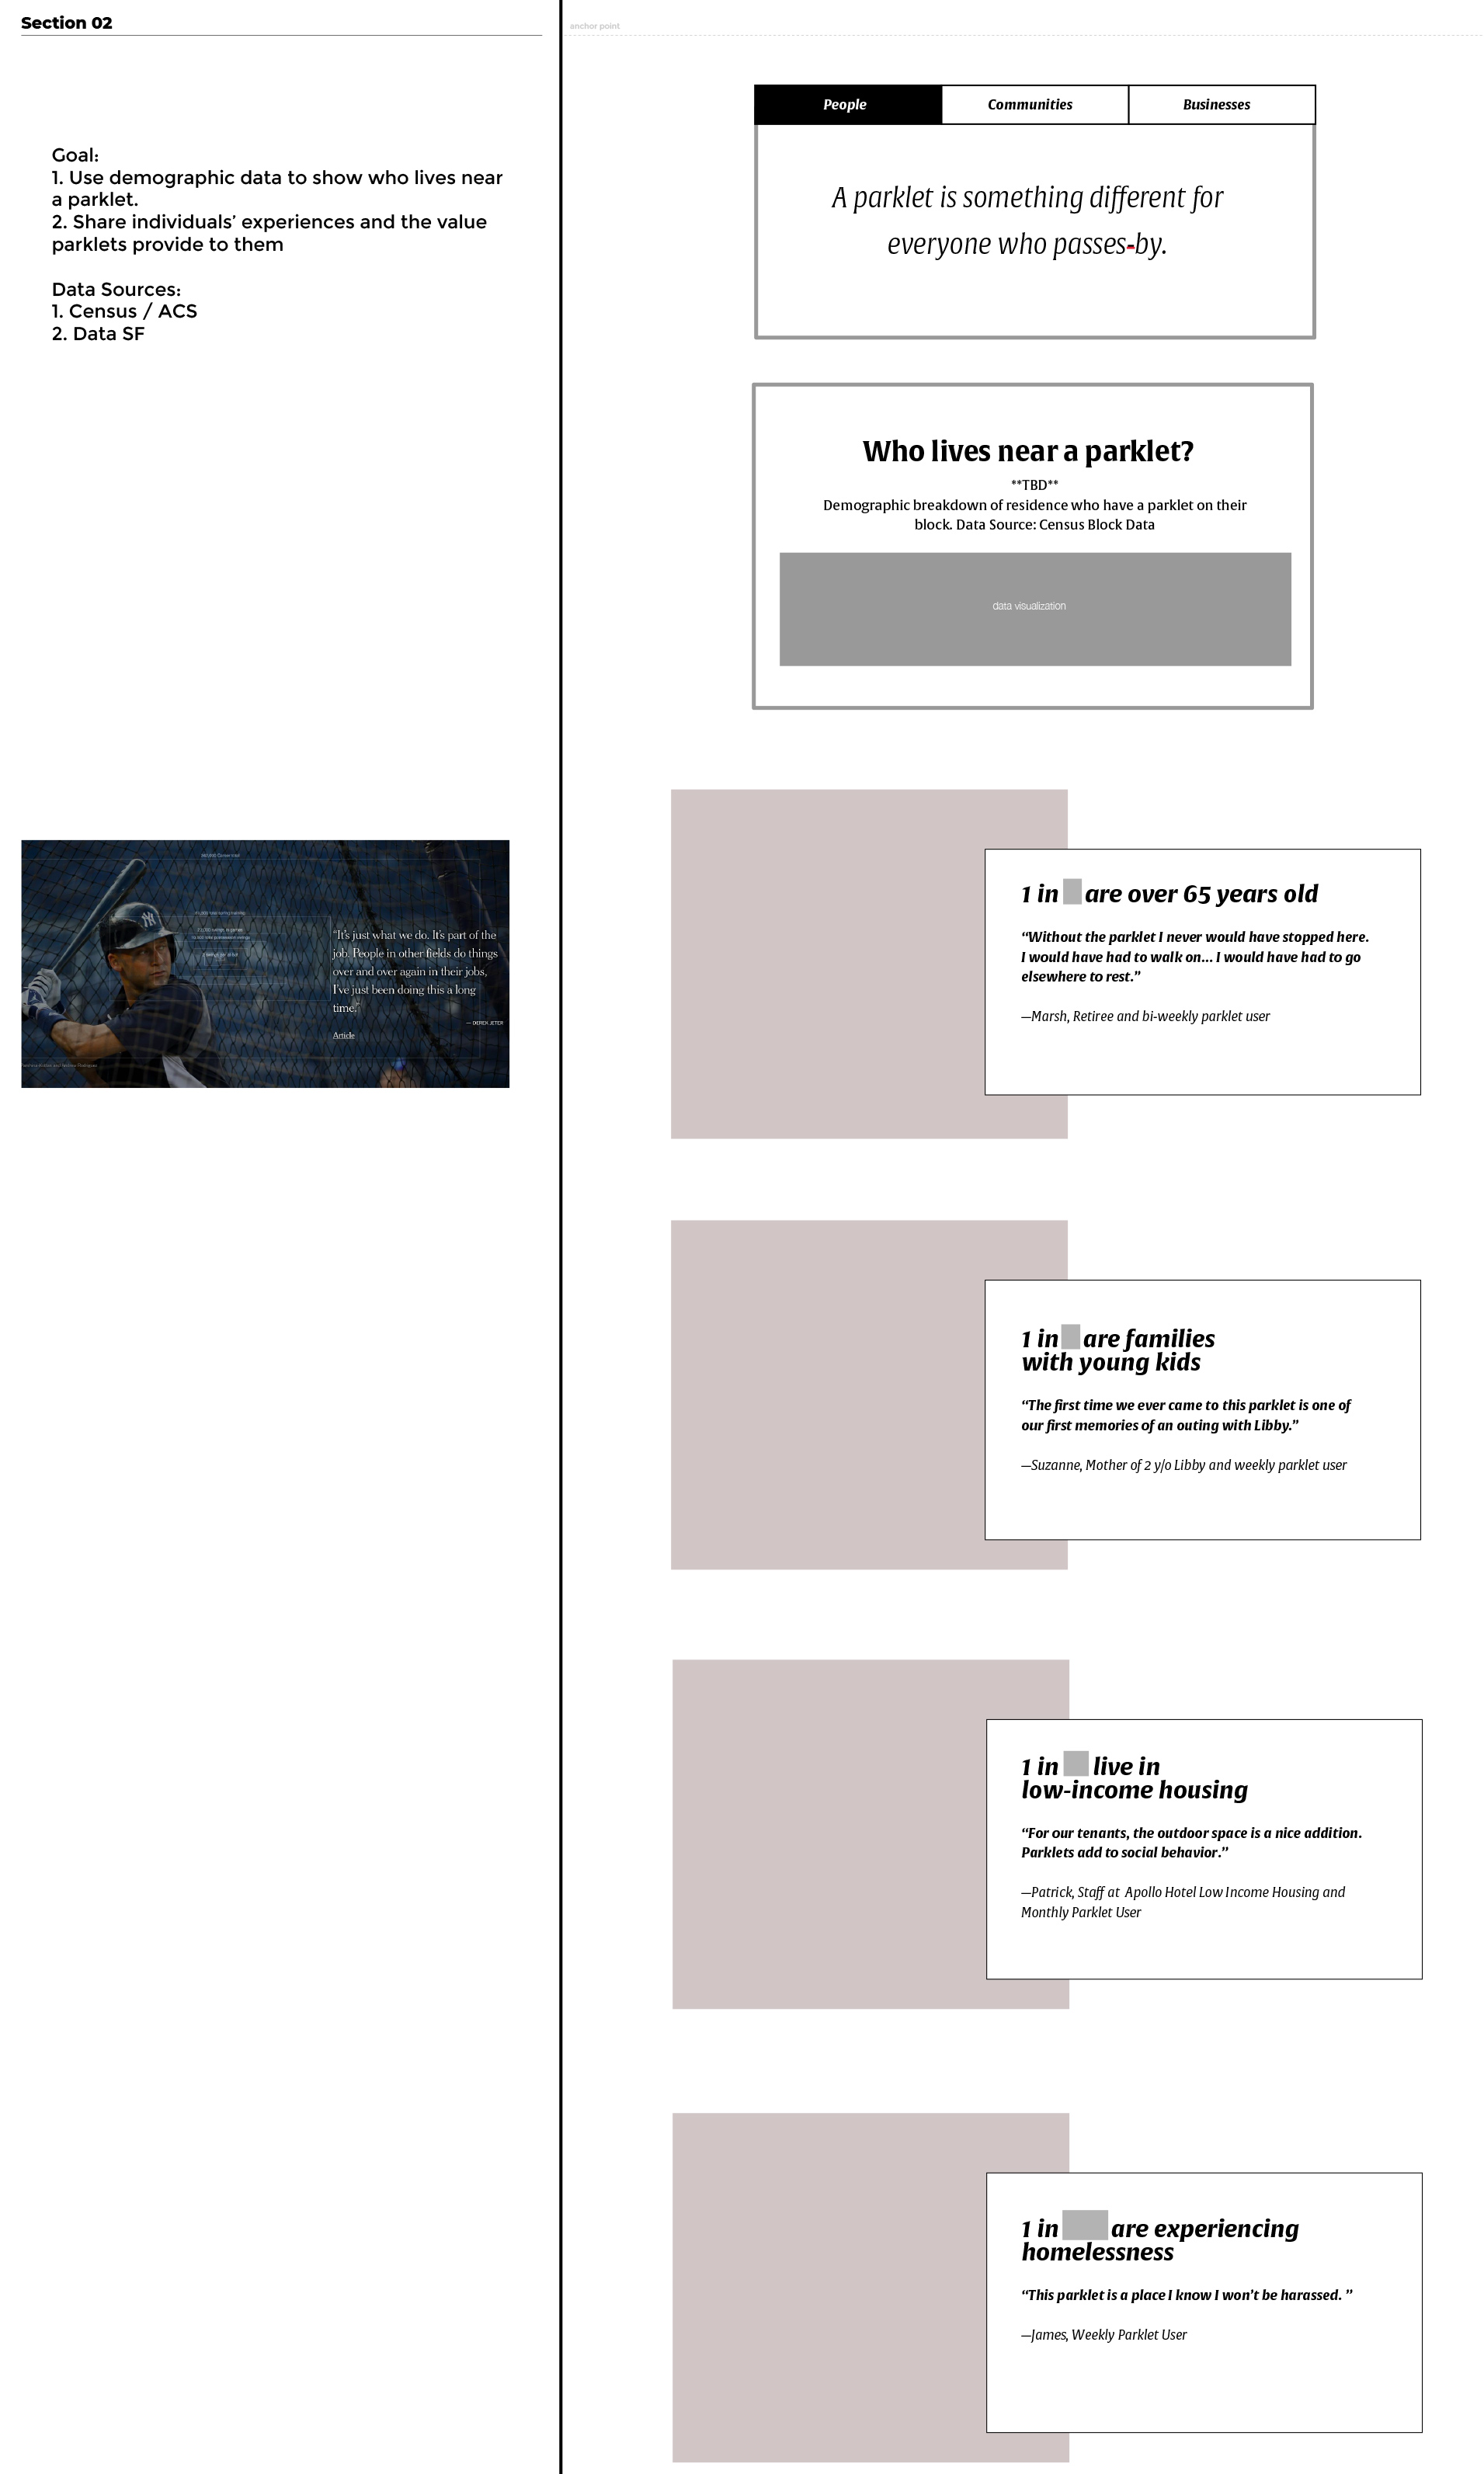
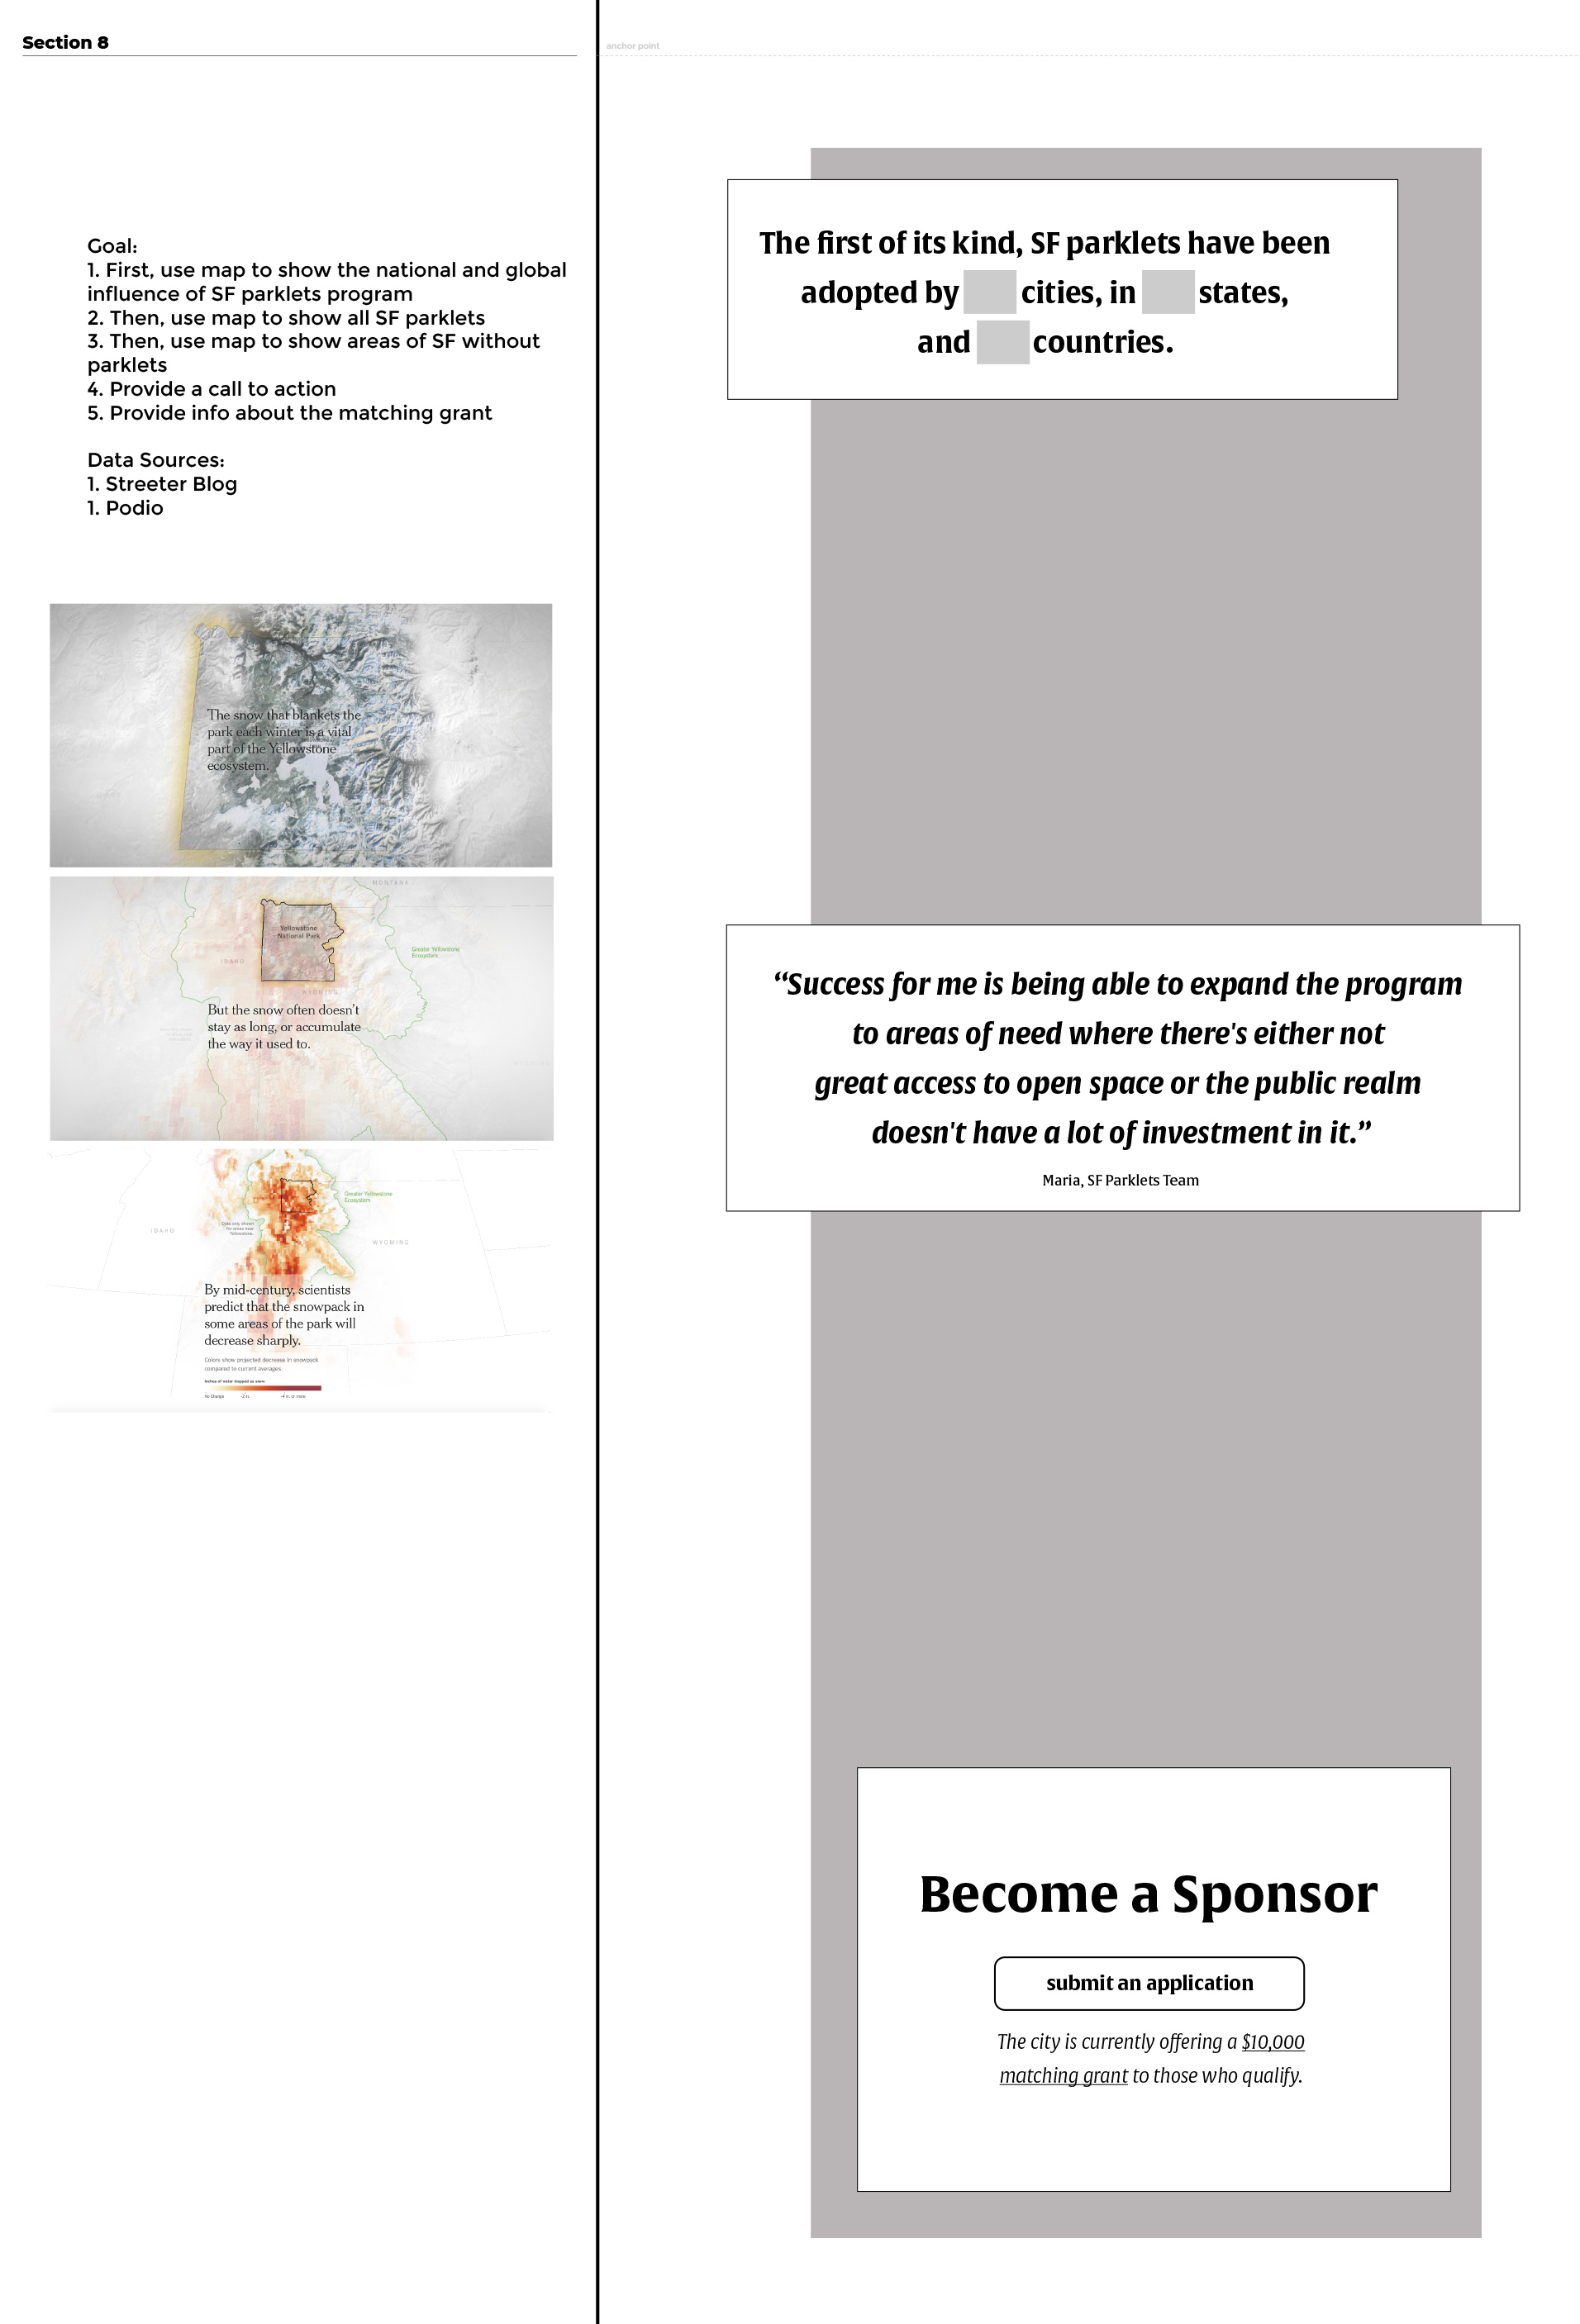
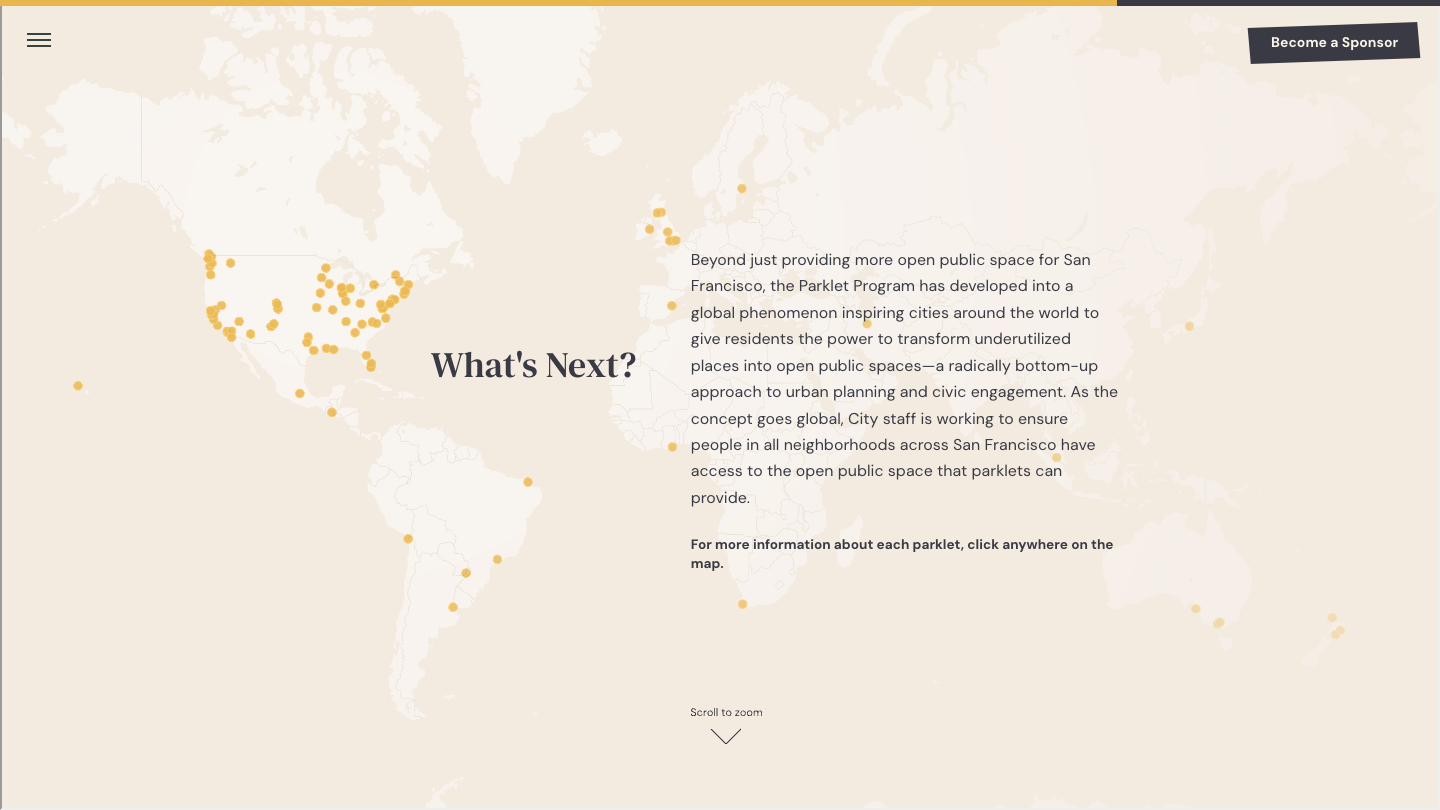
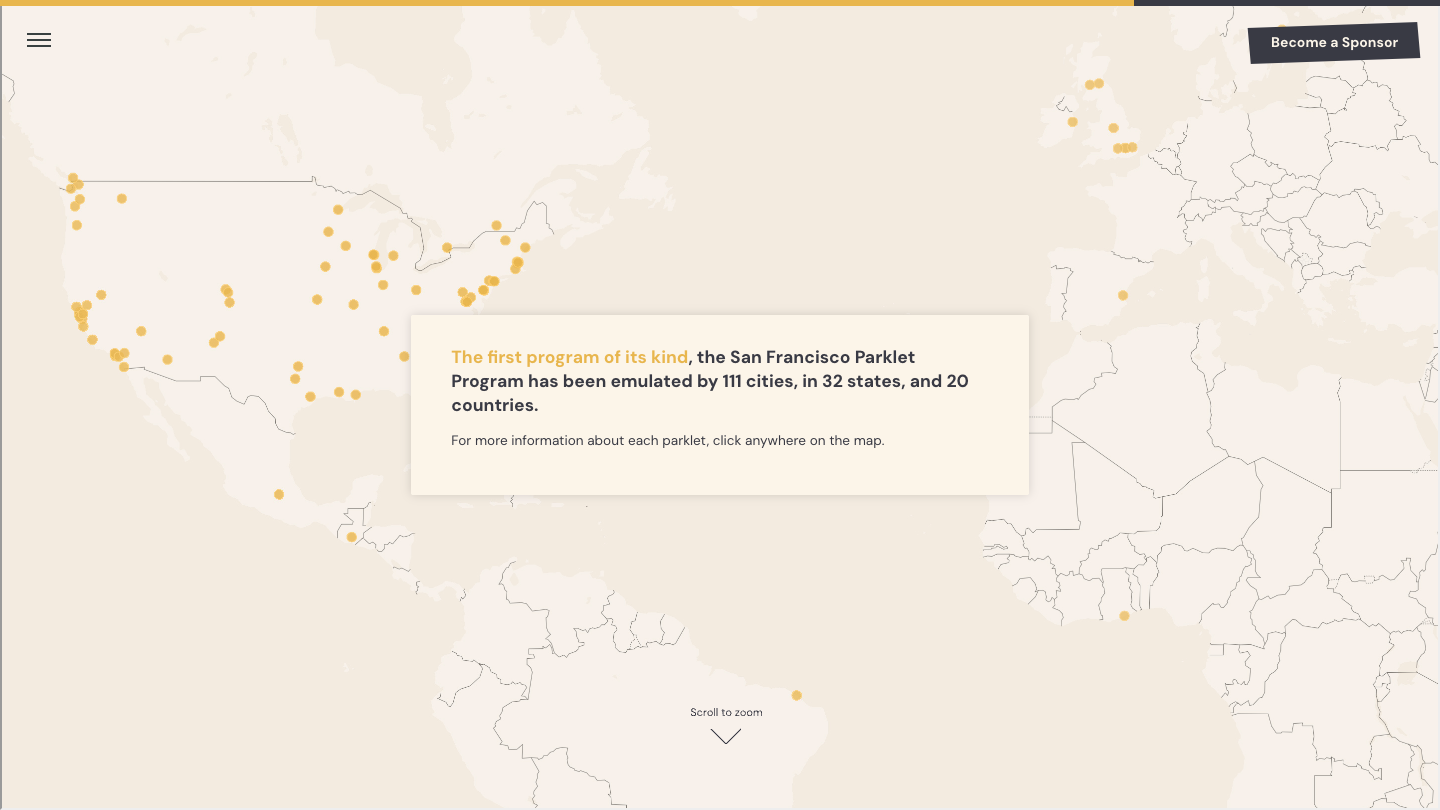
Combined, the two teams, along with input from SF Planning, designed an interactive web experience that combines data trends with quotes and feedback from local residents, and features organizations in neighborhoods outside of the areas traditionally associated with parklets.
Responsibilities
- Data Visualizations
- Wireframes
- Visual Design
Visualizing Data
“Data itself needs to be designed. There’s so much data that people need to know what they can do with it and how it can help them. As human-centered designers, we need to design the data experience so that anyone can easily access and interpret their city’s data to answer a question or provide evidence for an idea they want to advocate for.”
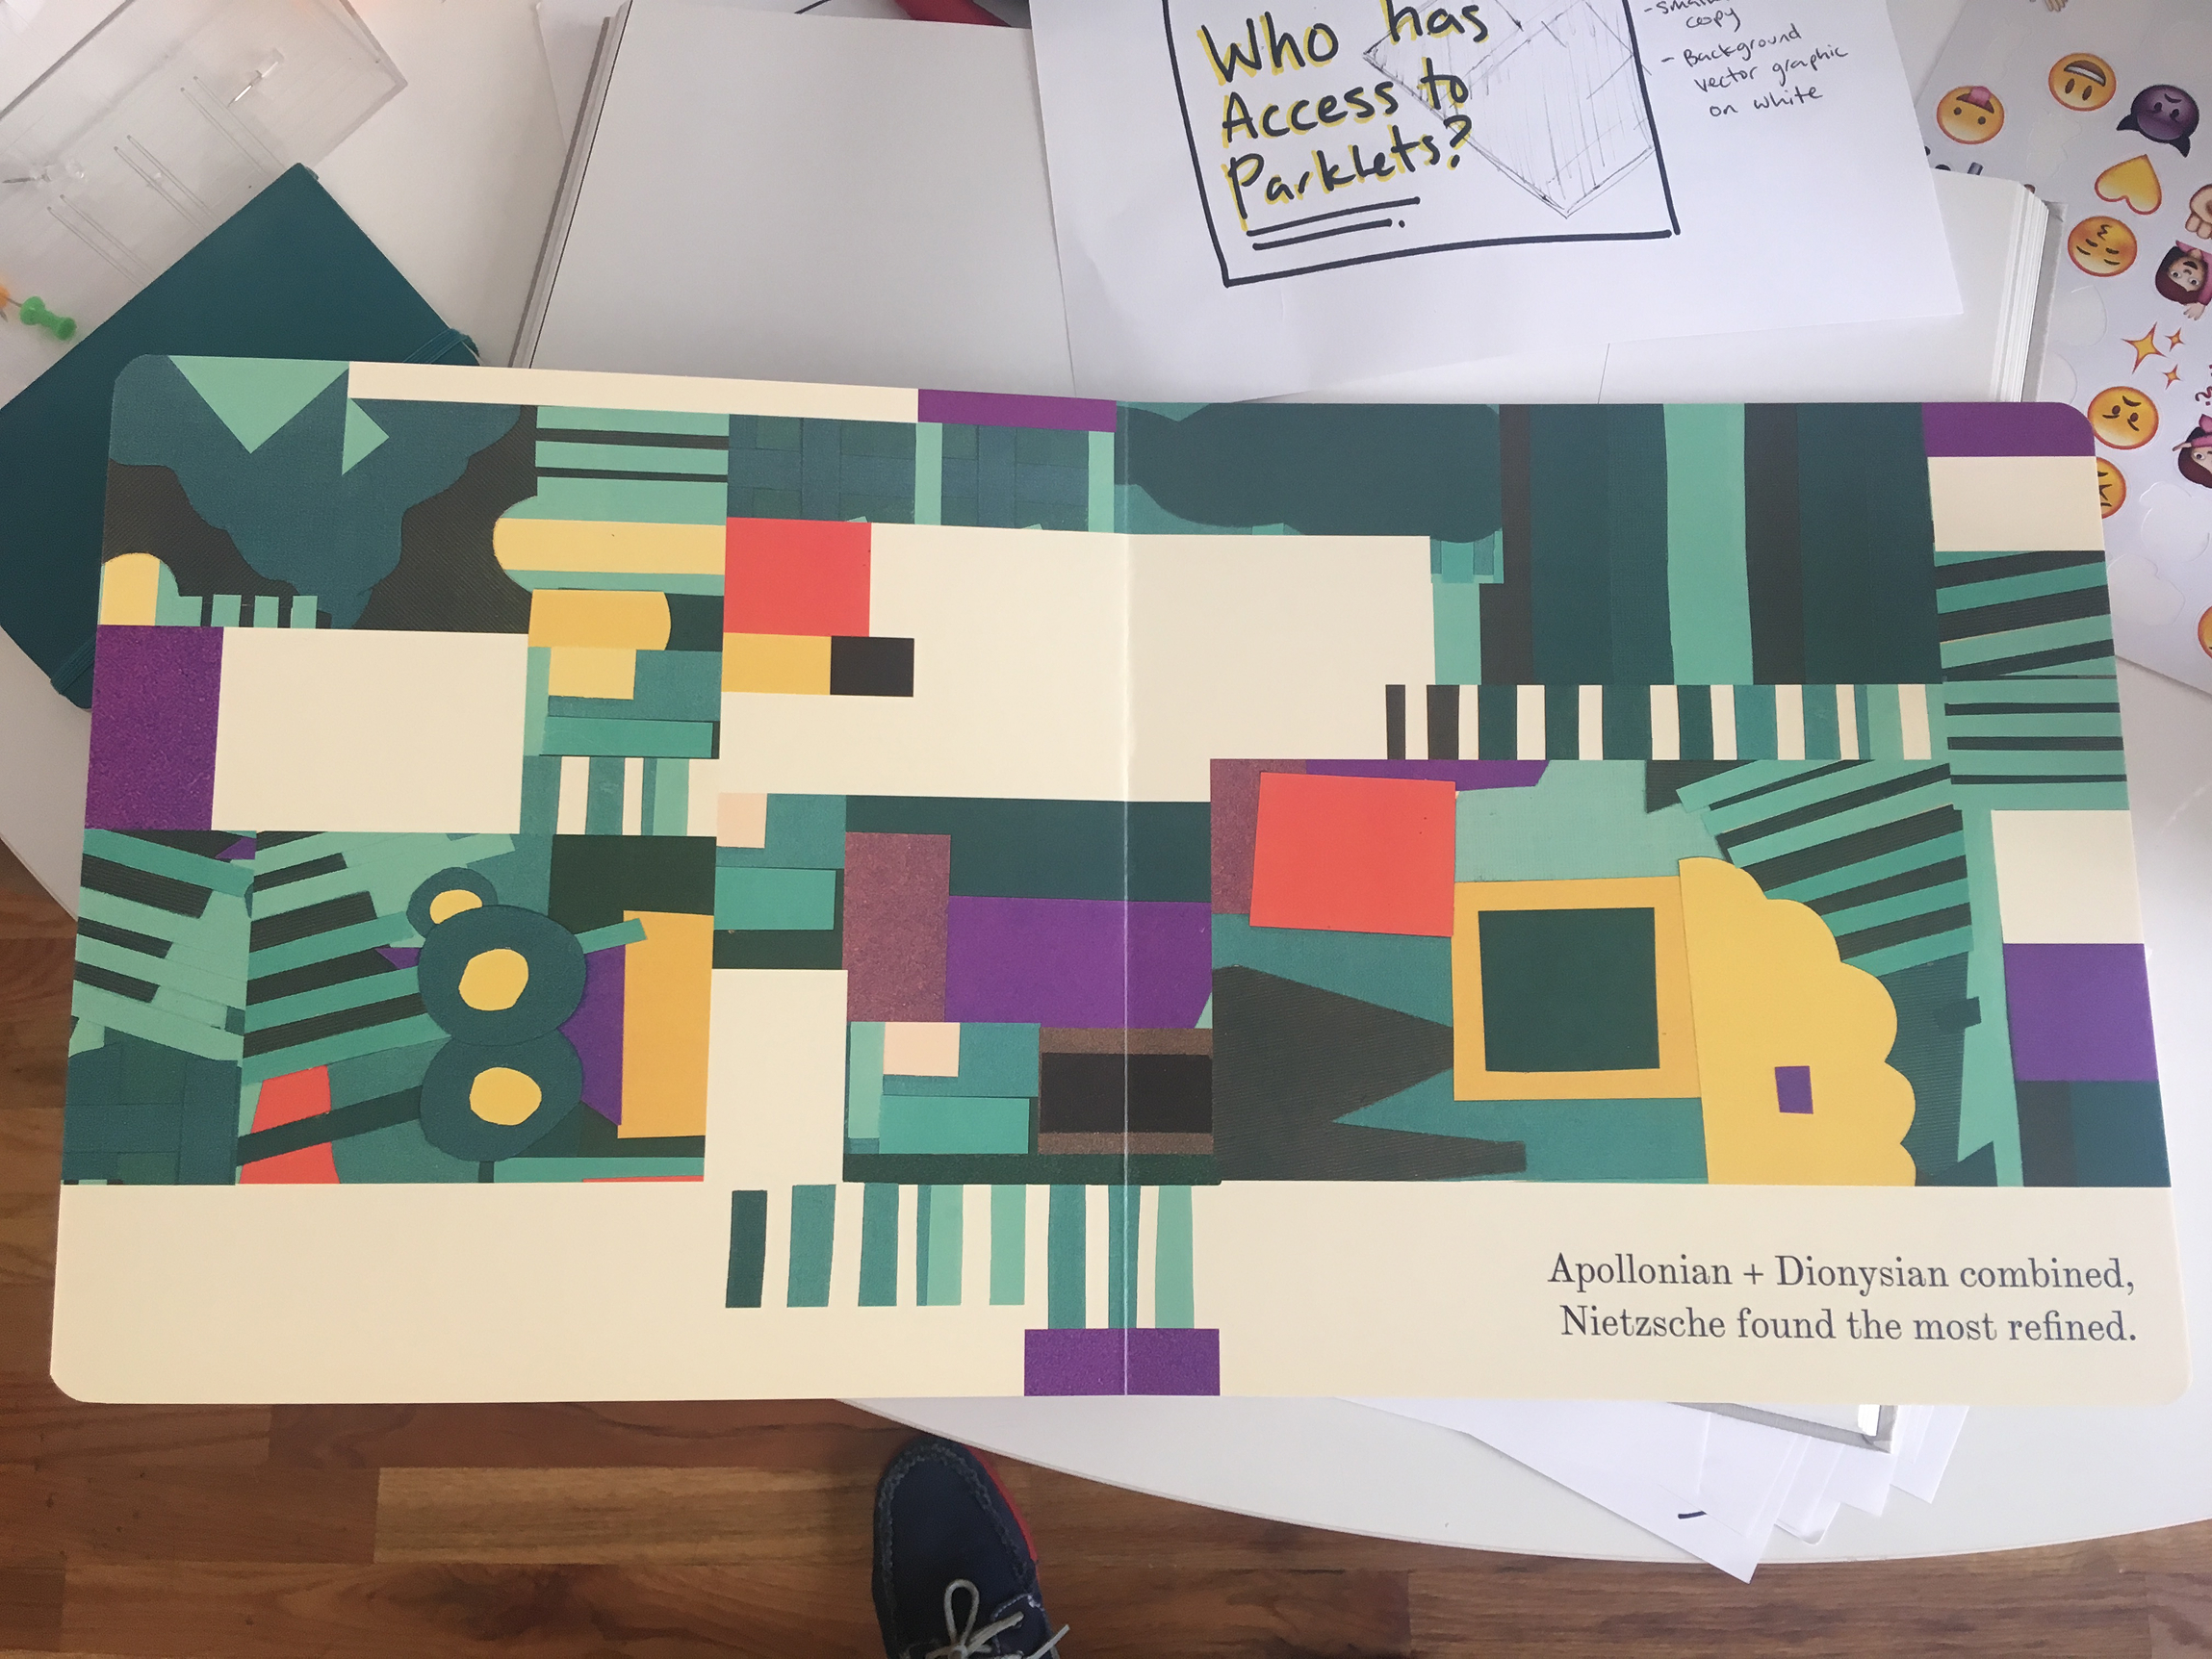
Initial Concepts

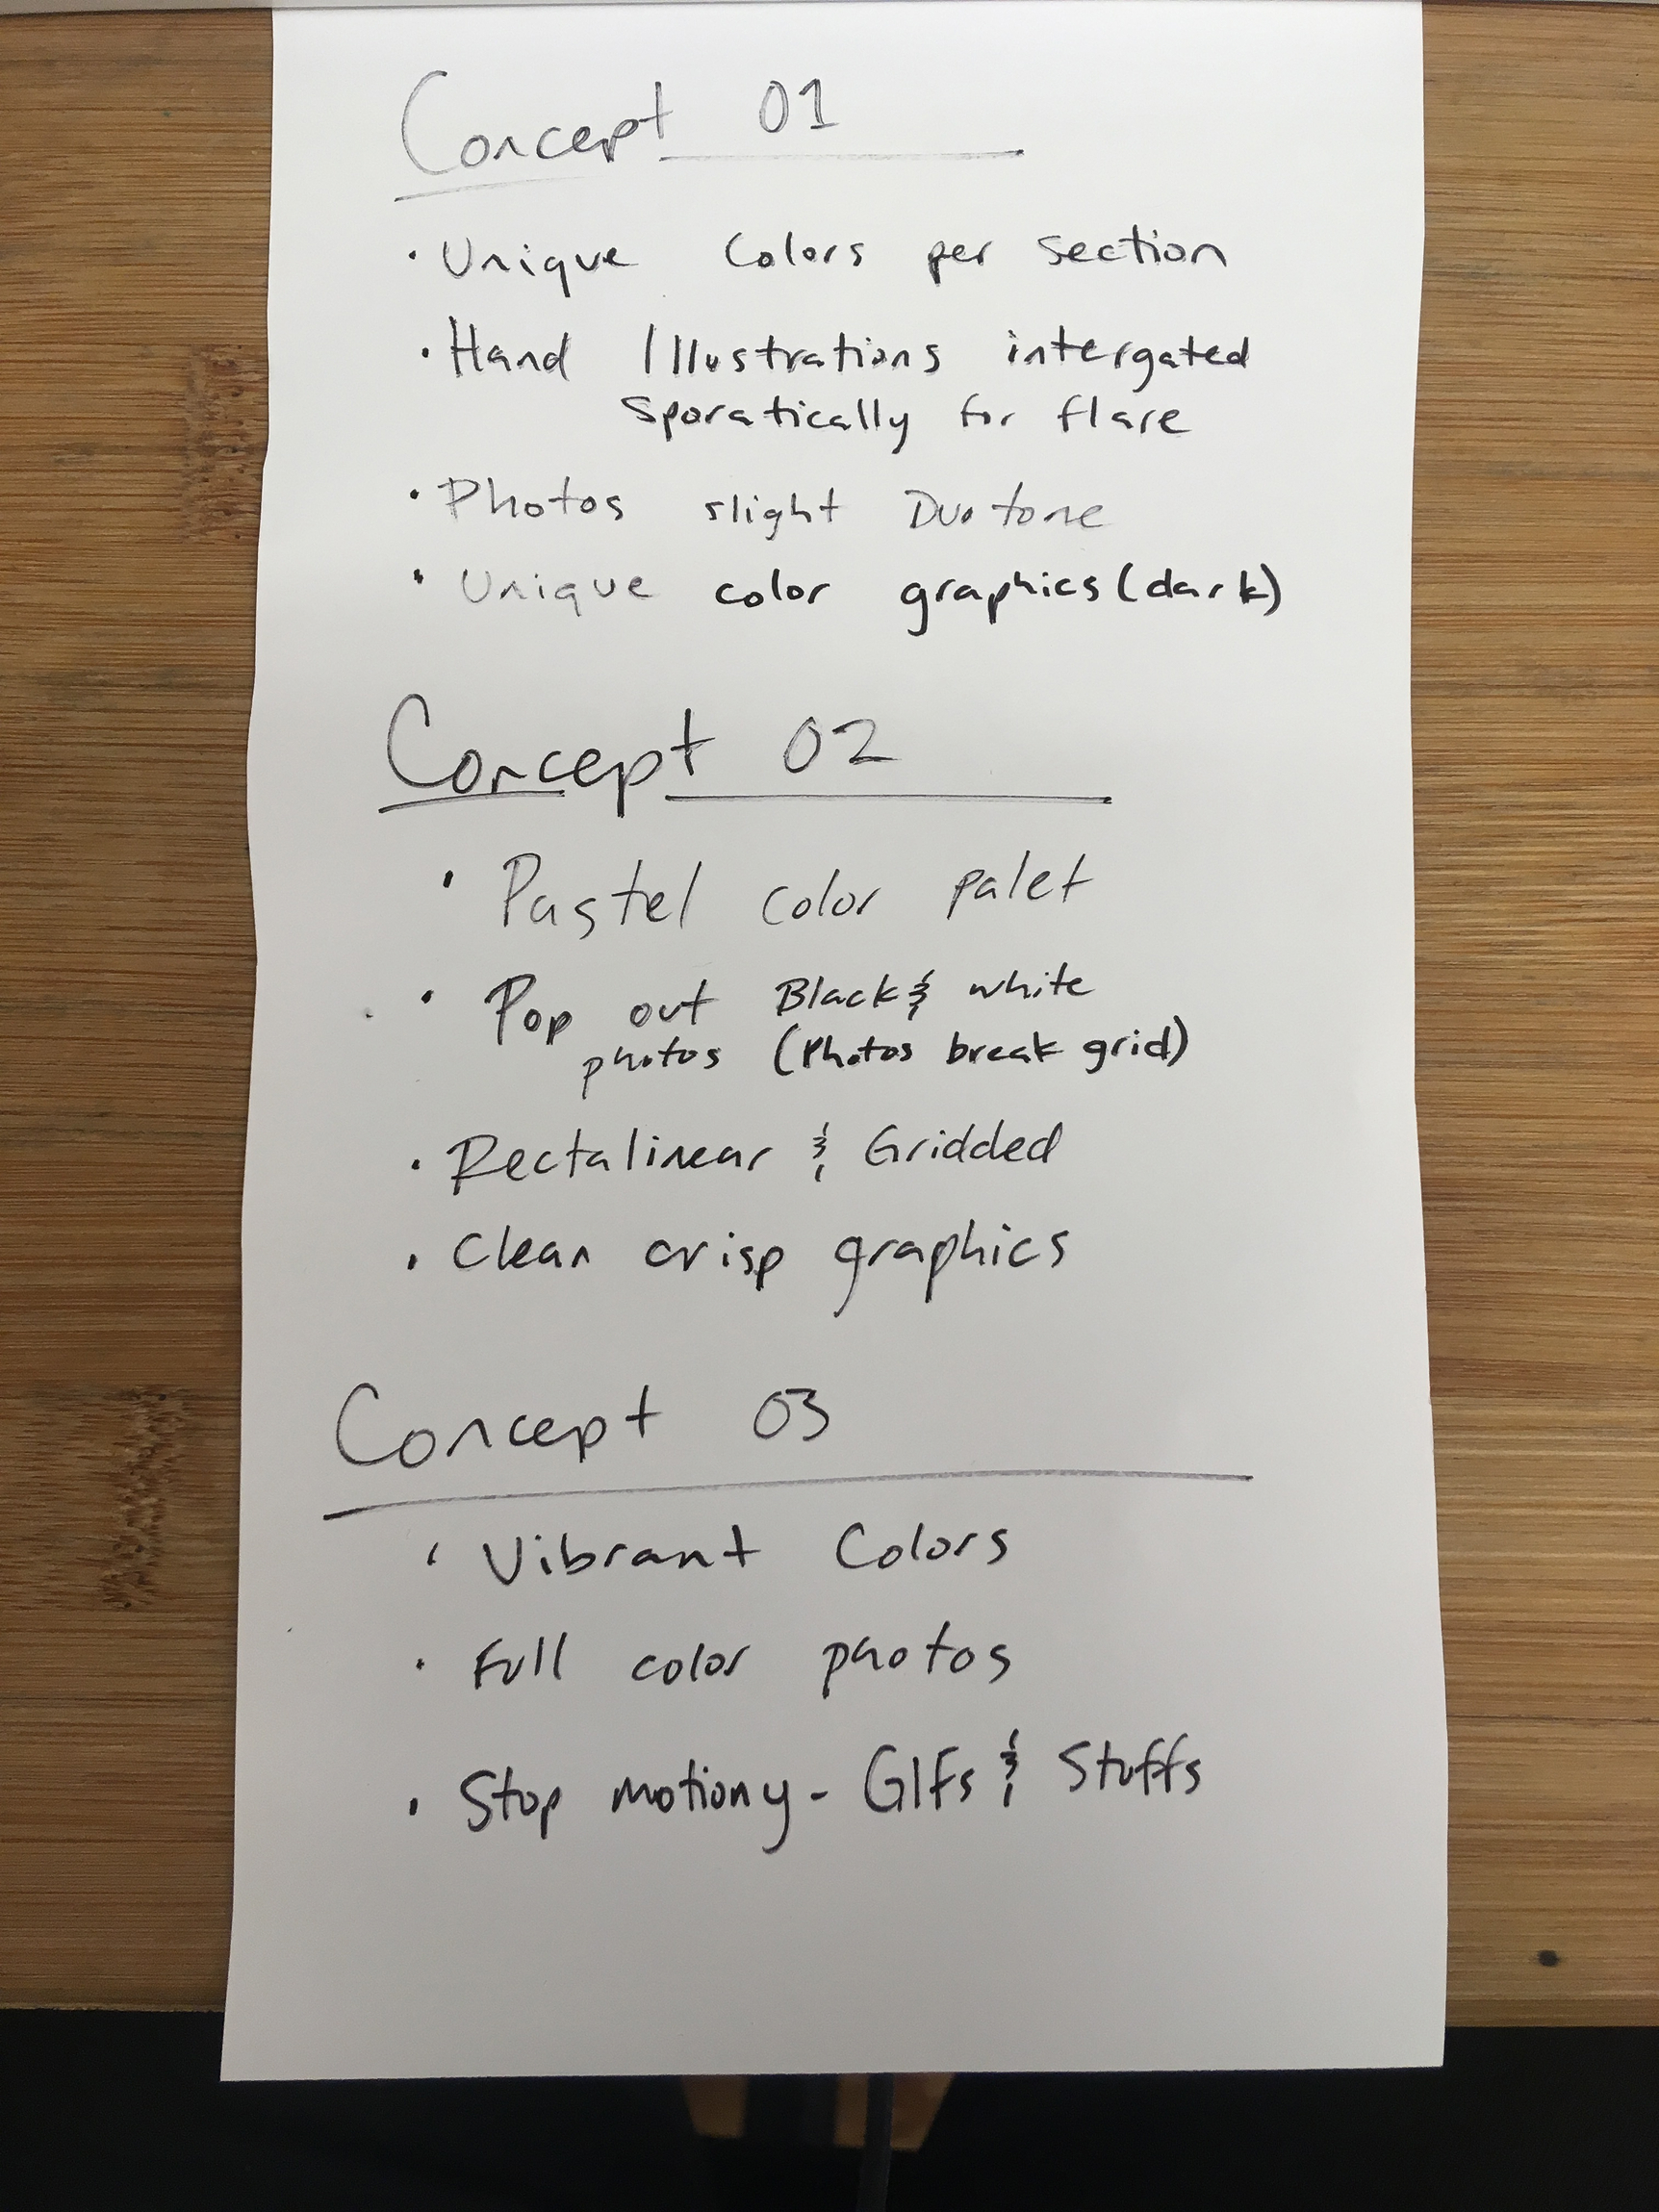


Wireframes





Navigation

Visualizing Parklet Data

Deliverables
Description
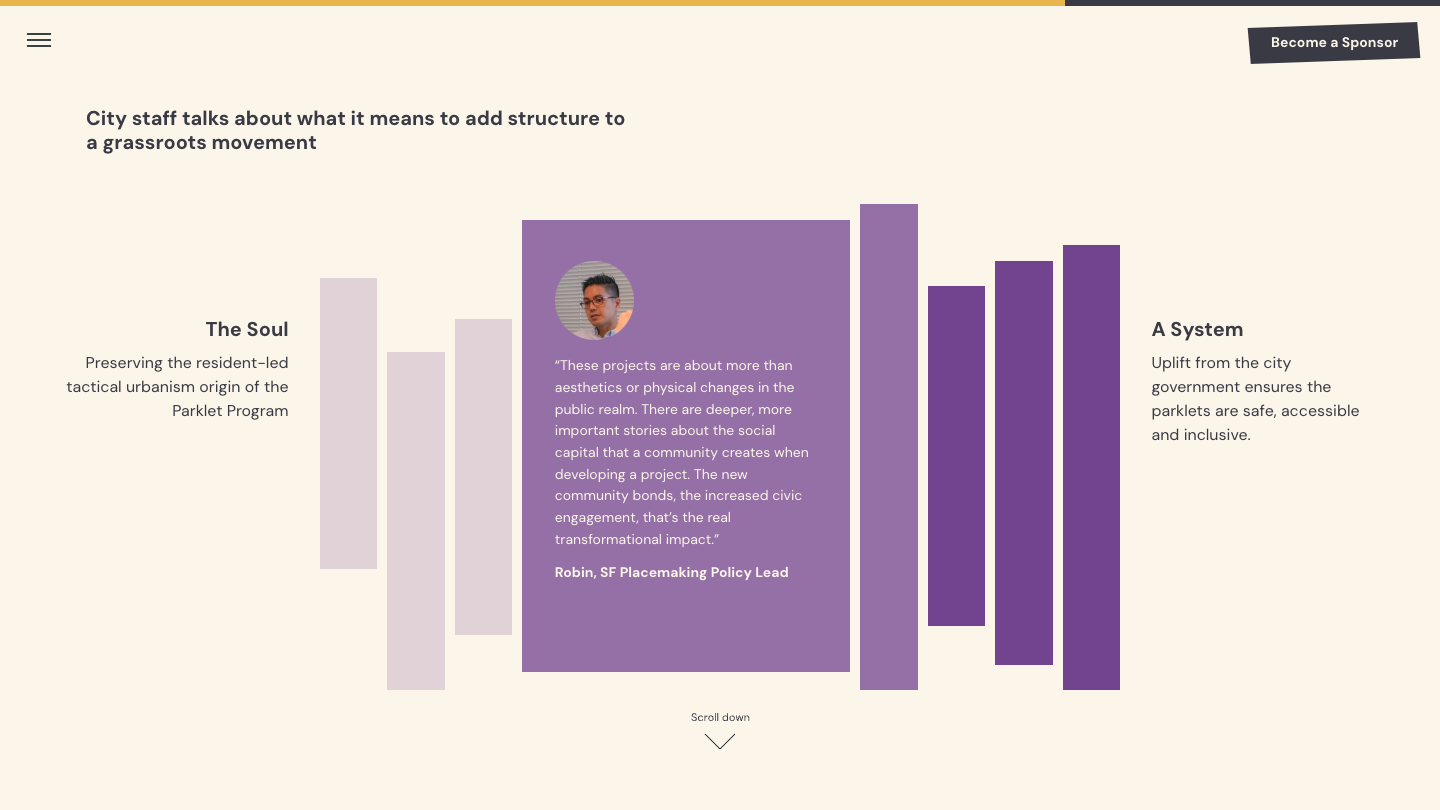
The final result is an interactive web experience called “A Look at the Human Impact of Parklets,” featuring a mix of qualitative and quantitative data, including first-person stories and perspectives of people who visit, steward, and design policy for parklets.
The narrative structure leverages experience from veteran parklet sponsors to increase transparency about the challenges of the program and to share tactics for success. The City also shares its perspective, including the pros and cons of introducing regulation, and the values that drive them.
Responsibilities
- Data Visualizations
- Front-End Web Development
- Visual Design
- Client Presentation
Final Design

Data Visualizations






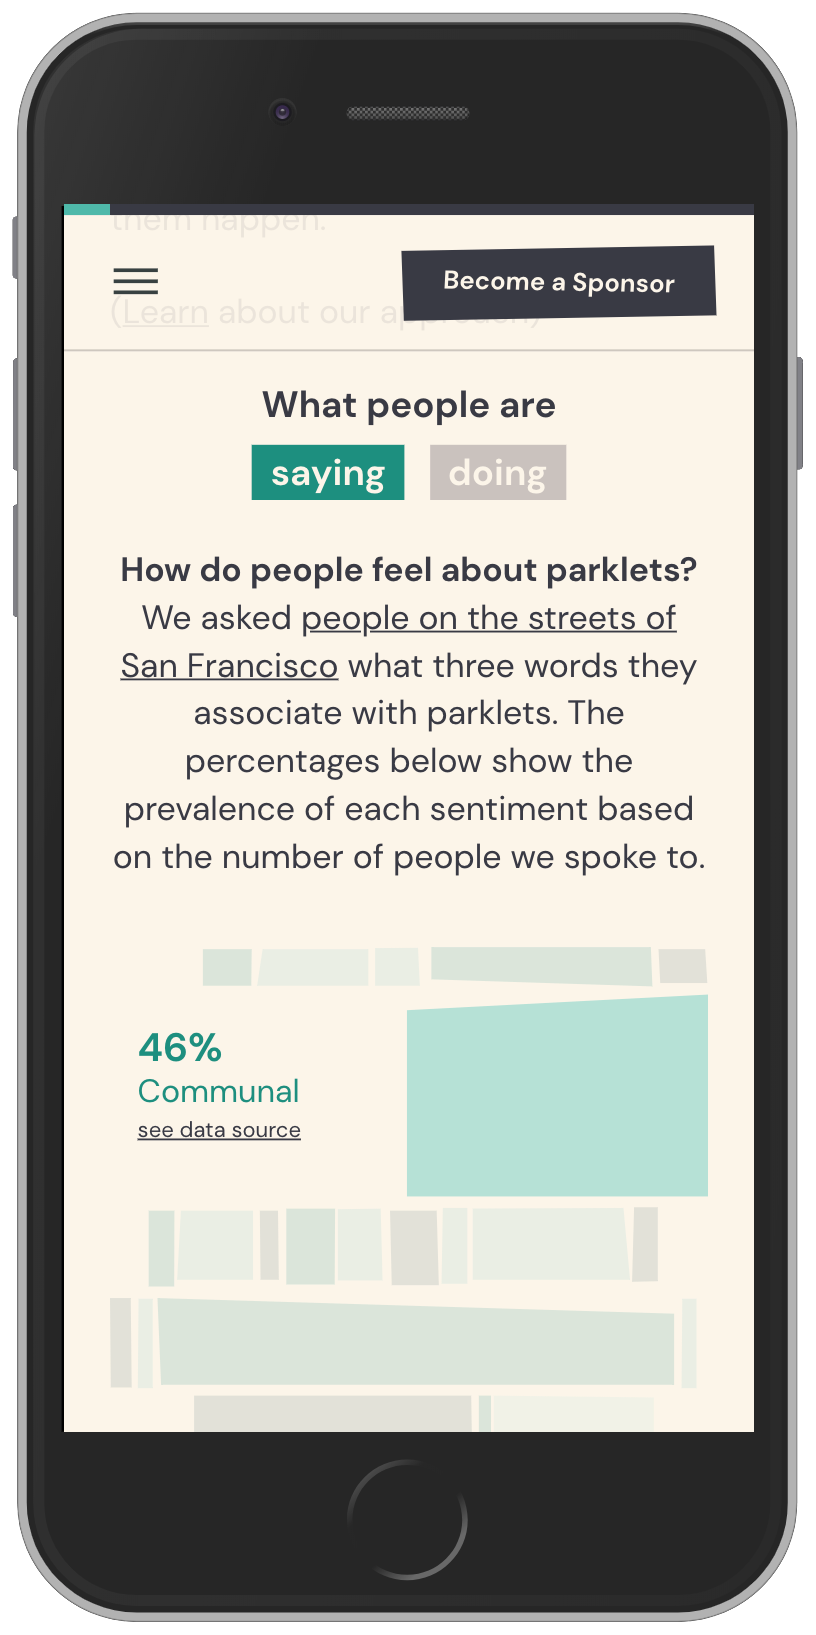
Responsive Design



Methodology & Sources


Making Data Accessible & Engaging
“Publishing open data is a terrific step for cities to take to make their projects and programs more participatory and accountable; but data alone, devoid of human context, often isn’t as meaningful as we might imagine. If we want the public to engage, we need to make the data engaging. I applaud SF Planning and the team at Openbox for bringing a human-centered narrative to the way in which new information about the parklets program is being shared online for the first time.”
Outcome

The interactive data story website still lives on the Groundplay: a multi-agency program of the city of San Francisco. It was met with very positive praise by the SF Planning department as well as those generally interested in the city’s parklets program.
Parklets Update

On Tuesday July 20, 2021, the Board of Supervisors unanimously passed the permanent Shared Spaces legislation. This marked the end of the parklets program and transitioned to the Shared Spaces program.